J-BTC
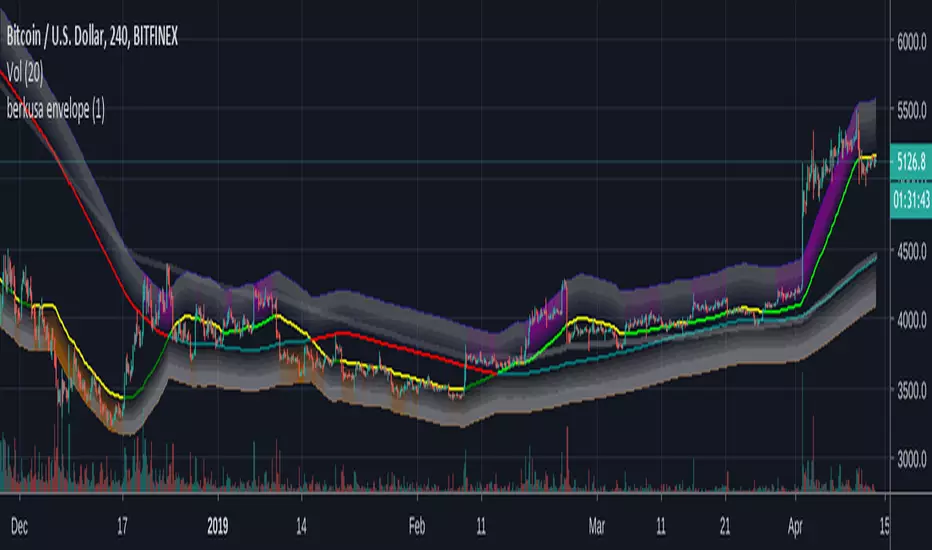
-- Prince Angel 2.0 -- By @CryptoNTez --Script designed for prince angel as requested.
The script is private and is only for the requestor or their partners.
Script based on different trading indicators to plot buy or sell signals.
Happy trading.

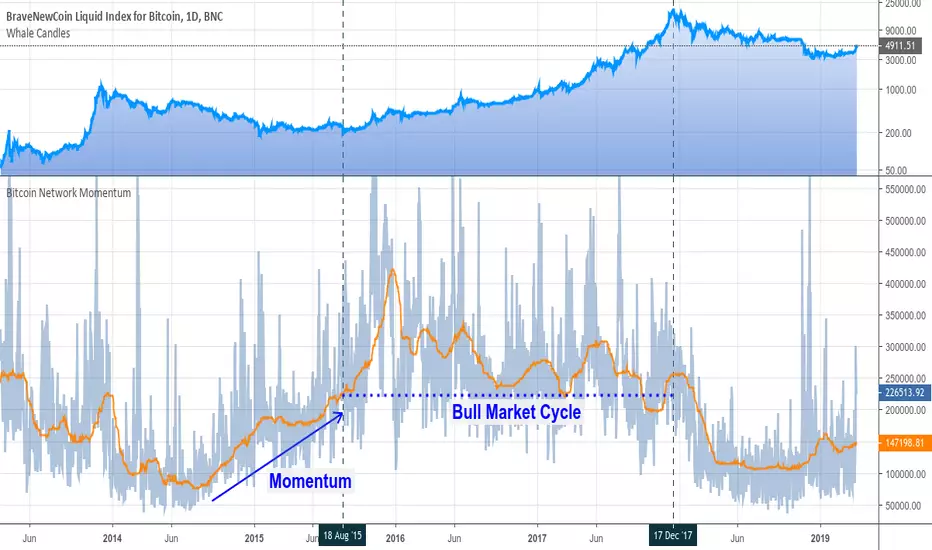
Bitcoin Network MomentumBitcoin Network Momentum is a leading indicator that relates On-Chain Transactional Volume (measured in BTC)with the evolution of the Bitcoin Price.
Further resources:
Woobull charts
Medium article
Credits: PositiveCrypto
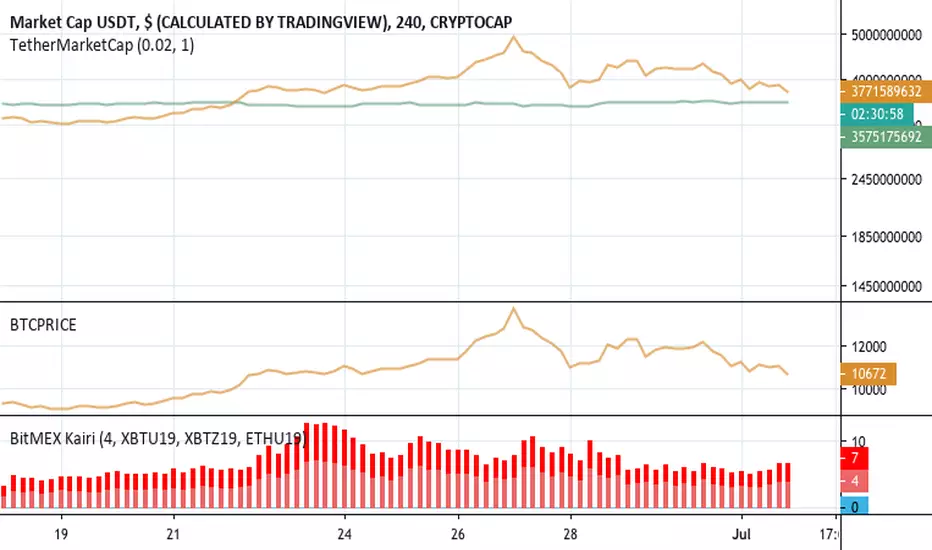
BitMEX KairiBitMEX Kairi
# Abstract
This script shows the divergence between BTC futures price and BTC actuals price of bitFlyer FX and BitMEX in percentage.
Usually, when people bought it or sold it too much on futures , the divergence between actuals and futures are getting expanding.
I believe this is really useful to find when the conversion of the trend happens.
Also supports USDT divergence too. If you wish to enable USDT mode, please check "Show only USDT divergence (Poloniex)" on the settings menu.
Enjoy :)
# Supports:
- BitMEX BTC Futures 3mo (orange)
- BitMEX BTC Futures 6mo (red)
- bitFlyer FX (blue)
- USDTUSD (Poloniex)
# Disclaimer:
This is a free script. Feedbacks are welcome! But I don't have any responsibility when this script has broken or something went wrong.
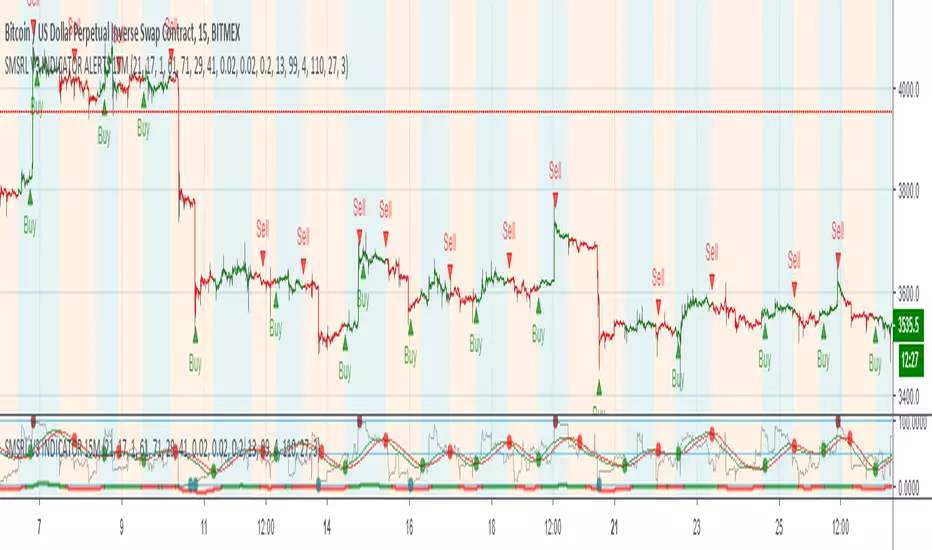
Bitcoin Stacked VolumesThe idea was to keep Bitcoin trading volumes on the different exchanges under control using only one chart and only one indicator. It works on ANY timeframe.
Settings
Lookback for SMA of volume from each exchange (default: 21 )
Option to include or not volumes that traded in stablecoin pairs (default: true )
Customizable volume quotas for alerts
Alerts
It has 30 different alerts which can be divided into 4 types:
Total Quota Exceeded
Total Volume/SMA Crossover
Quota Exceeded
Volume/SMA Crossover
Here are some examples how it helps to be aware the situation on 1-minute resolution:

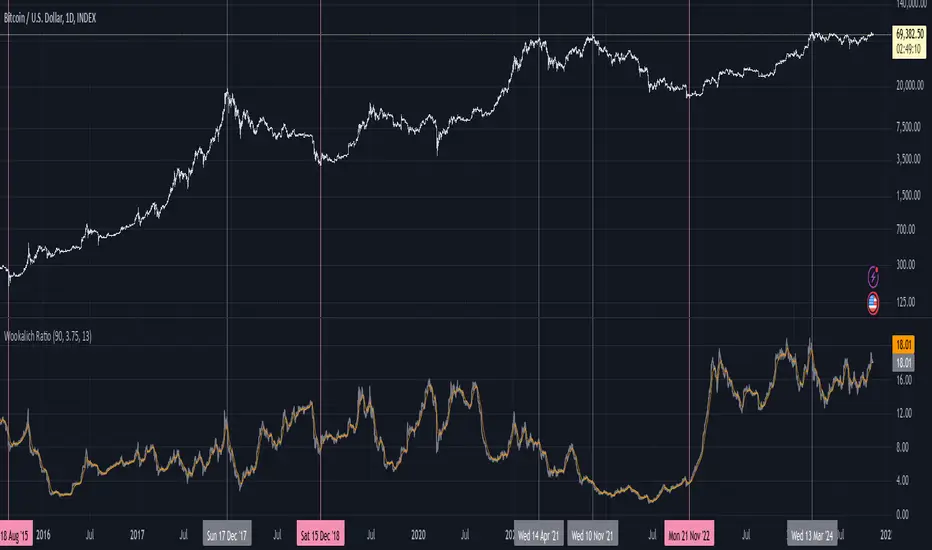
Bitcoin Wookalich Ratio (NVT)The Wookalich Ratio is an indicator derived from the NVT Signal . This is a tool used in Bitcoin markets to predict tops and bottoms.
The Wookalich Ratio aims to correct long-term inflation skewing through the use of a dilution factor.
I've setup this indicator for it to be possible to base the calculations on custom:
Transaction Periods
Overbought levels (110 by default)
Oversold levels (32 by default)
Credit for this idea goes to cryptopoiesis twitter.com
You're welcome to use add it to your charts.
Bitwise Spot Volume Index (@BTC_JackSparrow) [v2019-03-23]Following Bitwise's research on the legitimacy of volume on spot exchanges, they reported 95% of the Bitcoin market volume is fake.
According to the report 10 exchanges showed trustworthy regulated spot volume. Having accurate reporting of volume is important and therefore I have made this indicator that combines all 23 pairs listed on the exchanges mentioned by Bitwise that are available on TradingView.
The volume listed in this indicator could be used as a reference for true volume and therefore is an important addition to your trading toolkit and should more or less represent the data found on this page, released by Bitwise: www.bitcointradevolume.com
If you like this, give me a follow on TradingView and Twitter (@BTC_JackSparrow : twitter.com).
NOTE: as this indicator needs to pull a lot of data, it might take a moment to load!
How To Read?!
Volume is printed as the sum of all Bitcoins traded on the listed exchanges.
Trade safely!


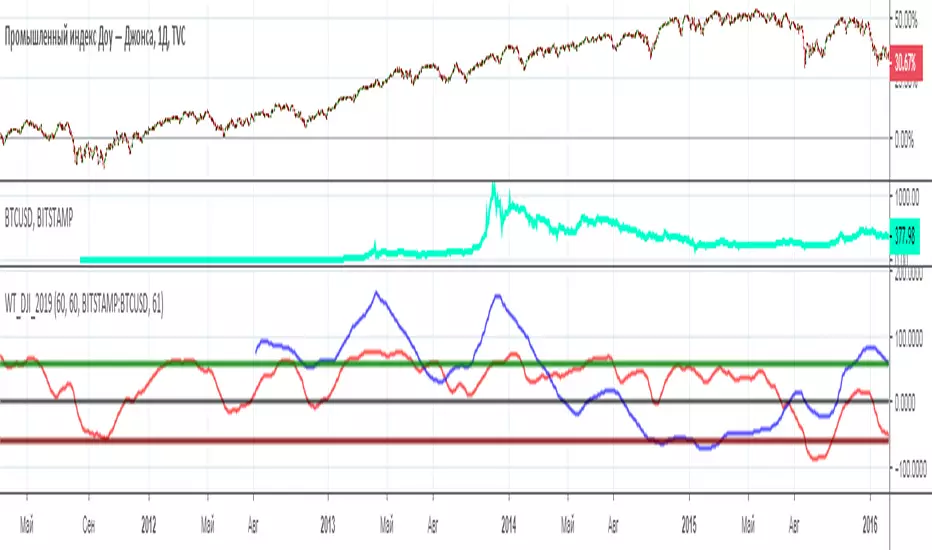
WT_BTC_Dow Jones_2019[wozdux]Comparison of two trading instruments using the indicator. Visual comparison often does not provide complete information. The scale and amplitude of the fluctuations of the two trading pairs are very different. Therefore, it is better to compare indicators from these pairs. I have used for this purpose, the speed indicator of price movement wt. The red line is the wt indicator from the trading instrument that is in the main window. The blue line is an indicator from the pair, which is written in the indicator settings. In addition, the calculation periods for each pair can be taken as the same or different. Often, trading pairs do not fluctuate synchronously, so it is necessary to select the periods of calculation of the wt indicator individually. In this example, Dow Jones and bitcoin were used.
-----------------------
Сравнение двух торговых инструментов с помощью индикатора. Визуальное сравнение часто не дает полной информации. Масштаб и амплитуда колебаний двух торговых пар бывают сильно различаются. Поэтому сравнивать лучше индикаторы от данных пар. Я использовала для этой цели индикатор скорости движения цены wt. Красная линия это индикатор wt от того торгового инструмента, который находится в главном окне. Синяя линия это индикатор от пары, которая прописывается в настройках индикатора. Кроме того, периоды вычислений для каждой пары можно брать как одинаковые, так и разные. Часто торговые пары колеблются не синхронно, поэтому стоит подбирать периоды вычислений индикатора WT индивидуально. В данном примере использовался Доу Джонс и биткоин.
BTC exchange trade vol / on-chain transaction volThis Bitcoin indicator shows the percentage that the exchange traded volume is from the sum of the exchange traded volume + on-chain transaction volume.
The thin red line is the non-smoothed value calculated from daily volumes.
The thick black line is the 7-day EMA-smoothed value.
The exchange traded volume and the on-chain transaction volume are reported by Quandl and have a 1D resolution - so it is best to use this indicator on the daily time frame.
When the value is high, it shows the the interest of traders is high and they are intensely trading BTC. When the indicator is low, it means that BTC is "dormant": it is used for transfers, but not so much for trading - traders forgot about it for a while - which may be a good time to accumulate if the economy is in a general bull market.

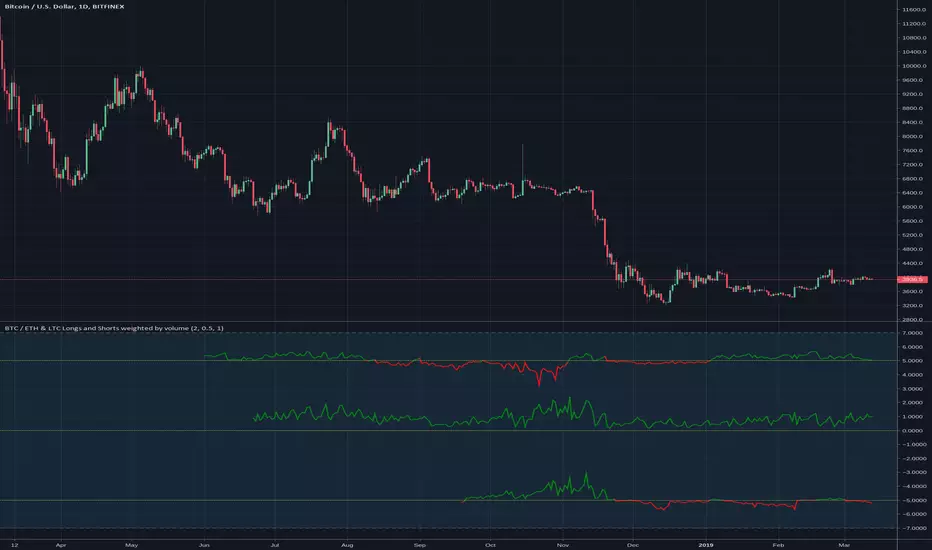
BTC / ETH & LTC Longs and Shorts weighted by volumeMy personal crypto market breadth.
The long and short contract come from Bitfinex, the daily volume for weighting is used from four different exchanges to average the result.
A line above the center line means more open long contracts (green) than open short contracts (red).
The upper indicator shows BTC ratio, the middle one ETH and the lower one LTC.
ABV Scalper - Free Bitcoin Scalper IndicatorExcited to bring you this totally free to use indicator to be used as a scalper for Bitcoin!
You are required to use the following:
Use with Bitfinex charts
Use Heiken Ashi candles
Use the 30m timeframe
UTC time setting
This indicator does not take new entries on weekends given lower volatility in the market. However, if it enters a trade it will manage the position over the weekend for Stop Loss and Take Profit logic.
This indicator is setup to be fully automated!
If you love this indicator and the work we put behind it - please give it a like and share it with your network!

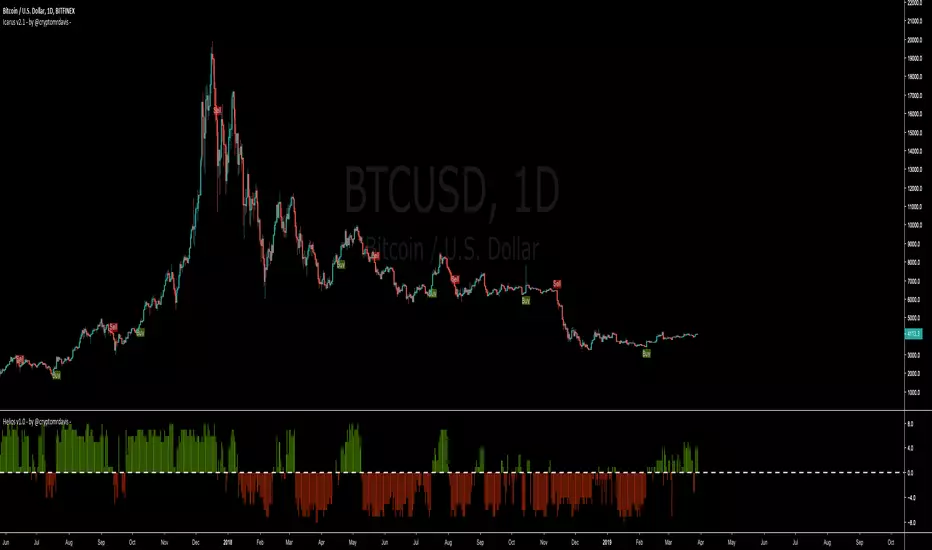
Icarus v2 - by @cryptomrdavis -This is the second version of this indicator. Now you have the ability to find the perfect settings for your asset. Just play around with those settings and if you find good ones, don't hesitate to share it with us.
Buy / Sell Signals will be plotted only once until the signal for open/close appears.
Reduce the noise with the ADX settings but there is still more room for better signals.
Catches most of the biggest moves quick but in the sideways they are still to much noise. Need to improve that. If you have some ideas just get at me.
Hope this tool is useful for you guys
Happy trading
+++ use this tool on your own risk. i'm not responsible for your loses. DYOR +++
____________________________________________________________________________
BTC: 1GVRDK3HHr9CKM5SF2CGpCNXFuavB3L4j9
ETH: 0x7b825fa752b9926D3E8397cDb1d9E5473D074646
XLM: GAXUQJSW55C7MAC4GI26NZUGIKSHFDVFRFKZCXPLMPY4HCADSDT55XK6
BCH: qz57n04ud6mn42u00aymqkku8tfh0lk4jv9c28mjvv
tippin.me
____________________________________________________________________________

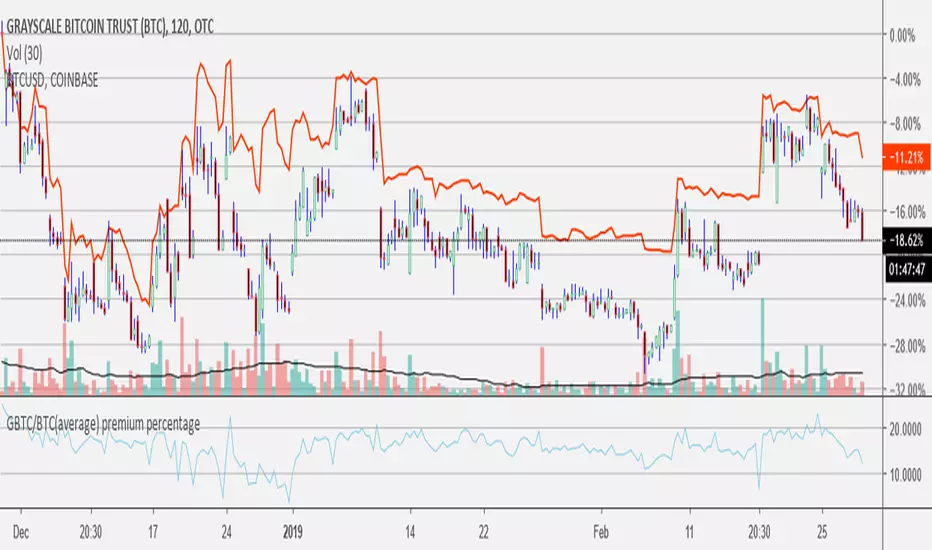
GBTC/BTC(average) premium percentageaverage bitcoin price used (average between bitfinex, coinbase, bitstamp, bittrex, and gemini).
find current amount of bitcoin per share here: grayscale.co
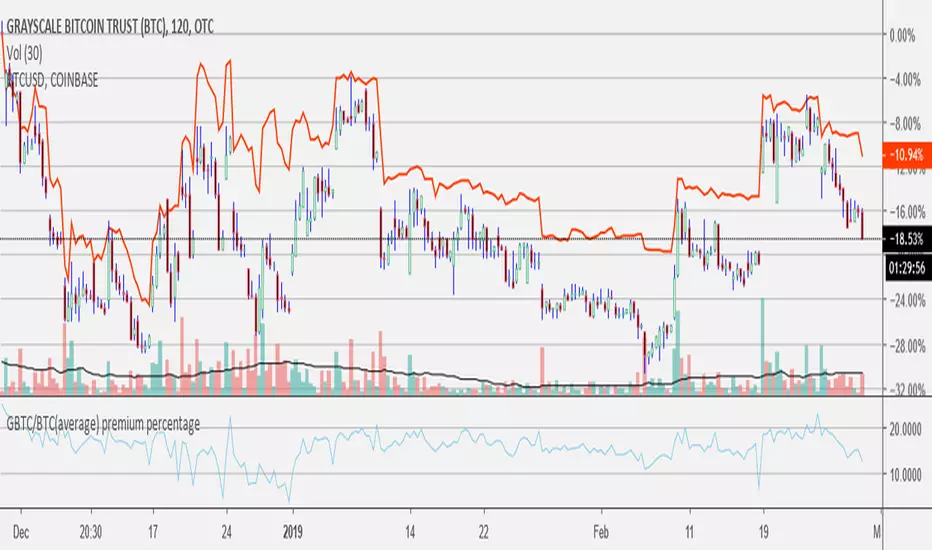
GBTC/BTC(average) premium percentageI updated the GBTC premium percentage indicator to the average bitcoin price (average between bitfinex, coinbase, bitstamp, bittrex, and gemini). I also left this new script open so you can update the amount of bitcoin per share because it is always changing. you can find the amount of bitcoin per share at grayscale.co half way down on the left.

Top 5 coins cummulated Upvol/Dnvol and Money FlowThis script reads price and volume information for the top 5 coins (on 9 exchanges, a total of 29 pairs), calculates the cummulative upvolume and downvolume according to the Money Flow (MFI) formula, and shows upvolume and downvolume separately on the chart as a green and a red line.
The coins used are BTC, ETH, LTC, XRP and EOS. They are the top 5 coins by daily volume, as of 24th of February 2019.
Because of the many security() calls needed, the script is VERY slow, so have lots of patience.
I find it useful as a broad crypto market indicator - for example to compare the current pump with the pumps in the past.
Can also calculate the aggregated Money Flow (MFI) if you check that option in the indicator's configuration. Make sure to wait for recalculation and rescale the chart afterwards - MFI has a value from 0 to 100 and you may need to zoom in.

Bitcoin Liquid Indexbravenewcoin.com
TV doesn't allow you to view the Bitcoin Liquid Index on lower time frames if you aren't a Premium subscriber >:(
I cheesed the system by recreating the formula that BNC uses. It isn't an exact replica, but very very close!
It can be slow to load due to the security( ) calls.
Default settings use the timeframe of the chart, however, you can set a custom timeframe if you wish.
Cheers
DasanC

Godmode StochasticGodmode Stochastic oscillator that can be used as alternative to Stoch RSI, since imho it better tracks price movements.

BTC Aggregate USD Volumeaggregated USD volume of BTC from Bittrex, Poloniex, OkCoin, Gemini, Binance, Bitstamp, Kraken, Bitfinex, Bitmex (leveraged), and Coinbase

Current volatilityHello everyone.
Today an other small indicator that show the current volatility .
It works on all tickers ( crypto-currencies / others ) .
Method :
- ((high-low) * 100) / open
Hope it will be useful for you :)
