Volatility Adjusted Grid [Gann]█ OVERVIEW
Gann Square of 9 is one of the many brilliant concepts from W.D.Gann himself where it revolves around the idea that price is moving in a certain geometrical pattern. Numbers on the Square of 9 spiral tables, especially those lie in every 45degree in the chart act as key vibration levels where prices have tendency to react to (more on the table below).
There are few square of 9 related scripts here in Tradingview and while there's nothing wrong with them, it doesn't address 1 particular issue that i have: The numbers can be too rigid even when scaled based on current price because the levels are fixed, which makes them not tradable on certain timeframes depending on where the price currently sitting.
Heres 5min and 1hour Bitcoin chart to illustrate what i mean: Grey line on the left is based on Volatility Adjusted levels, while red/blue on the right are the standard Gann levels.
You can see that on 1hour chart, it provides a good levels (both Volatility Adjusted and the standard one happened to share the same multiplier in this case),
1Hour Chart:
On 5 min chart tells a different story as the range between blue/red levels can be deemed as to big for a short term trade, while the grey line is adjusted to suit that particular timeframe (You can still adjust to make it bigger/smaller from the settings, more on this below)
5Min Chart:
█ Little bit on Gann Square of 9 table
This is the square of nine table, the numbers highlighted in Red are known as Cardinal Cross and considered to be a major Support/Resistance while those in Blue color are known as Ordinal Cross considered as minor (but still important) Support/Resistance levels
Similarly, this script use these numbers (and certain multipliers) to print out the levels, with Cardinal numbers represented by solid lines and Ordinal numbers by dotted lines.
█ How it Works and Limitations
The Volatility Adjusted grid will go through several iterations of different multipliers to find the Gann number range that is at least bigger than times ATR. Because it's using ATR to determine the range, occasionally you'll notice that the line become smaller as ATR contracting (and vice versa). To overcome this, you can change the size range multiplier from the settings to retrieve the previous range size.
Use the size guide at the bottom left to find the multiplier that suits your need:
1st Row -> Previous Range -- Change Range Size to number lower than this to get a smaller range
2nd Row -> Next Range -- Change Range Size to number higher than this to get a larger range
Example:
Before:
After:
As you'll soon realise, the key here is to find the range that fits the historical structure and suits your own strategy. Enjoy :)
█ Disclaimer
Past performance is not an indicator of future results.
My opinions and research are my own and do not constitute financial advice in any way whatsoever.
Nothing published by me constitutes an investment recommendation, nor should any data or Content published by me be relied upon for any investment/trading activities.
I strongly recommends that you perform your own independent research and/or speak with a qualified investment professional before making any financial decisions.
Any ideas to further improve this indicator are welcome :)
Keylevel

RSI, Range, and Key Level Support Tool v2.1This indicator is actually 3 different indicators combined to be able to watch key levels such as daily/weekly/monthly opens, previous days and week range highs and lows, as well as see Oversold and Overbought conditions relating to the Relative Strength Index (RSI).
- RSI DOTS SYSTEM
The first part is a custom Relative Strength Index indicator that shows RSI dots above in Red and Below in Green of the bars.
As the RSI Dots go from dark and barely visible to bright and Red For Oversold or Green for Overbought it gives a direct representation above the bar chart of Overbought or Oversold conditions. The brighter the color, the closer to 100 (Overbought and Red) or 0 (Oversold and Green) the current RSI is.
As the Overbought and Oversold conditions reverse this will show a bright Yellow Dot over the bar if it crosses a value from Overbought conditions to not Overbought conditions and the same if it crosses from Oversold conditions to not oversold conditions. To put it simply, it shows RSI reversal.
- KEY LEVELS OPENS - Daily, Weekly, Monthly Opens
This is a simple line indicator that shows 3 key levels: Daily Open, Weekly Open, and Monthly Open.
These higher time frame key levels show precisely at what price that time frame opened based on 0 UTC.
- PREVIOUS HIGHS/LOWS
This part of the indicator will show the previous day and even week highs and lows. This will help the user establish a functional range of the previous days and weeks.
The highs and lows for the daily are rows of circles above and below the high and low for that specific day and the previous weekly range are rows of crosses above and below the high and low for the past week.
How to Best use the indicator:
The RSI dots will help the user find the tops and bottoms where the Key Levels Opens and Previous Highs and Lows will help the user establish the range.
Knowing where the local top/bottom is in correlation to the potential range tops and bottoms allows the user to effectively time trend reversals and potential tops/bottoms.
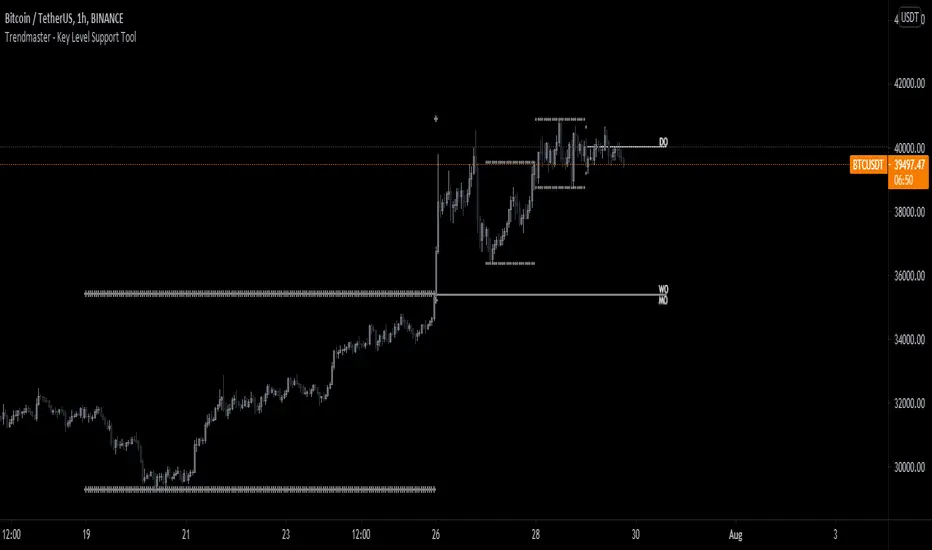
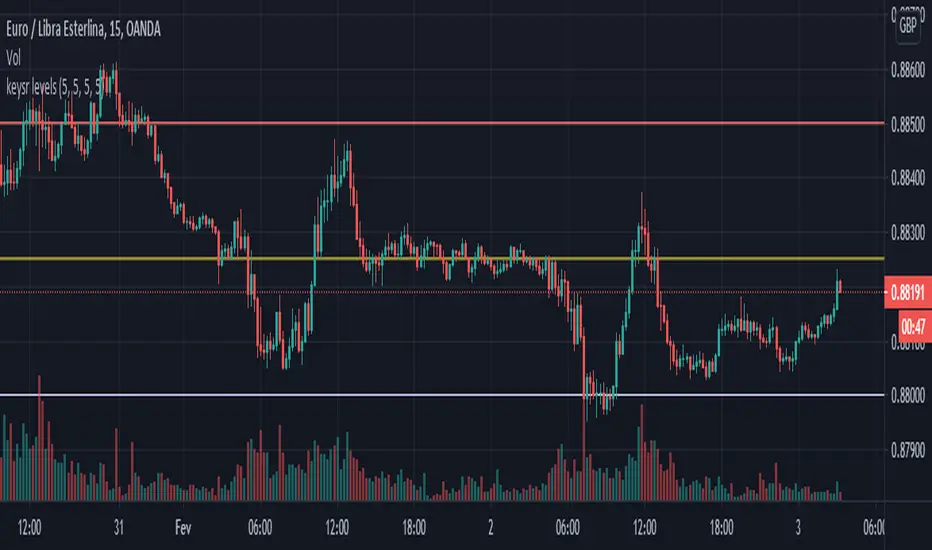
Key SR Levels. I am the original creator of this indicator for tradingview, it can be used separately now, it is a PVSRA indicator, where it marks the key points of support and resistance.
Market makers pull the market above the key level for distribution in bearish and pull below the key level for accumulation in bullish
Mainly used for
We have Whole level: main resistance ended in 000
We have a Key level ending in 250
We have half level finished in 500
And we have a Key level ending in 750.
Enjoy the indicator, share with friends. If it happens to be dented, pull until the graph stretches.
Note. This indicator works only for Forex, it can make a difference in pairs with Japanese Yen.
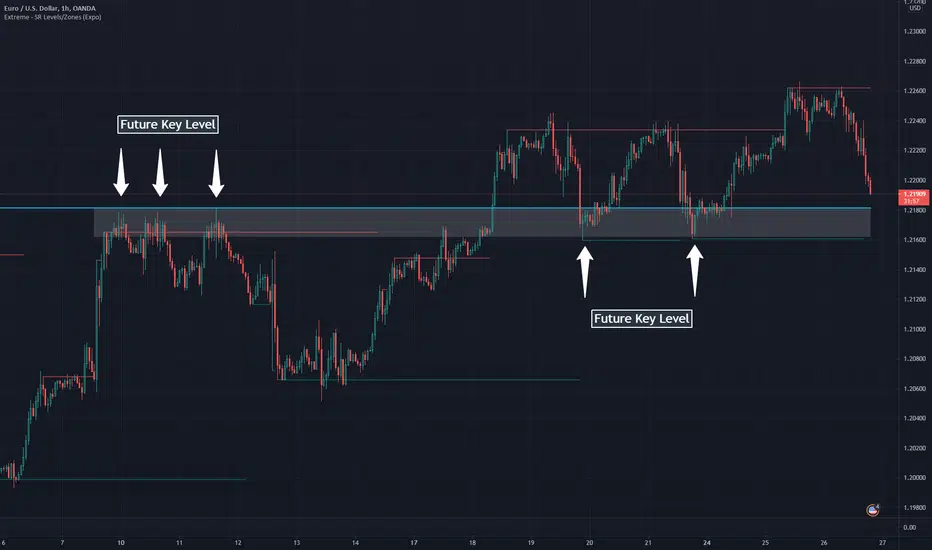
Extreme - SR Levels/Zones (Expo)Extreme - SR Levels/Zones (Expo) automatically searches and prints key support and resistance levels based on "extreme" high & low values.
When the extreme condition is met there is a high probability that the market pauses, makes a pullback, or that the trend change direction. If the current trend is strong, the price will breakout from the previous extreme level.
The indicator can be used standalone or as a part of your current trading strategy.
Real-time
No repainting
Works on any market
HOW TO USE
1. Use the indicator to identify key support and resistance levels.
2. Use the indicator to identify potential breakouts.
3. Use the indicator to identify potential reversal points.
INDICATOR IN ACTION
Daily chart
I hope you find this indicator useful , and please comment or contact me if you like the script or have any questions/suggestions for future improvements. Thanks!
I will continually work on this indicator, so please share your experience and feedback as it will enable me to make even better improvements. Thanks to everyone that has already contacted me regarding my scripts. Your feedback is valuable for future developments!
ACCESS THE INDICATOR
• Contact me on TradingView or use the links below
-----------------
Disclaimer
Copyright by Zeiierman.
The information contained in my scripts/indicators/ideas does not constitute financial advice or a solicitation to buy or sell any securities of any type. I will not accept liability for any loss or damage, including without limitation any loss of profit, which may arise directly or indirectly from the use of or reliance on such information.
All investments involve risk, and the past performance of a security, industry, sector, market, financial product, trading strategy, or individual’s trading does not guarantee future results or returns. Investors are fully responsible for any investment decisions they make. Such decisions should be based solely on an evaluation of their financial circumstances, investment objectives, risk tolerance, and liquidity needs.
My scripts/indicators/ideas are only for educational purposes!
ADX + KeylevelThe Average Directional Movement Index (ADX) help to determine the trend strength with a key level.

Manual Levels PlotterThis script was designed to make it easier to manually draw in Key Price Levels, whether you are on the computer or on TradingView's Mobile App.

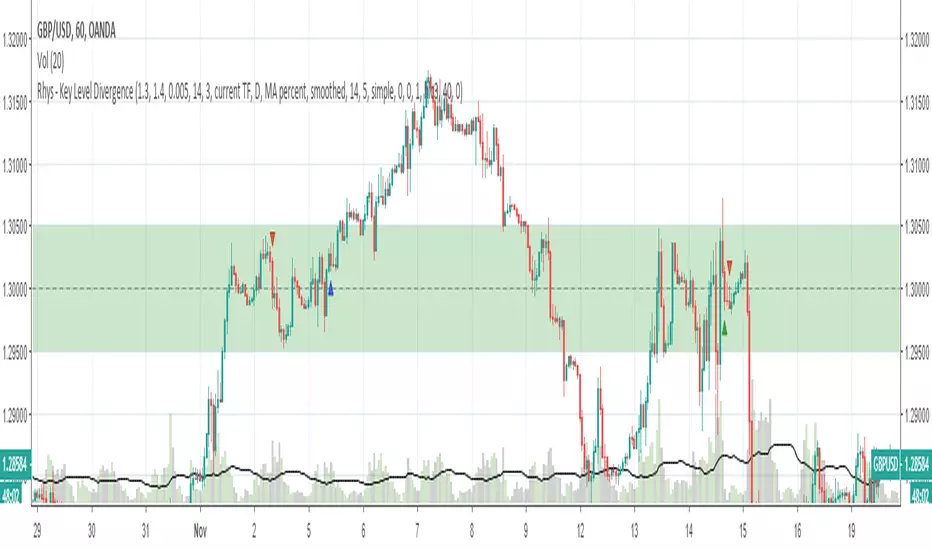
Rhys - Key Level DivergenceThis is a custom script created as part of Backtest Rookies development services. It has been published only for customer acceptance and testing. As such, I cannot grant access to anyone other than the client. Sorry about that.
See the Backtest Rookies profile for open source scripts. Visit our website for free pine-script and algorithmic trading tutorials. For those interested in custom development services, more information can be found on our website.
Key Level Divergence Indicator
A script to detect divergences only at key levels specified by the user.
Features
Select up to 2 key levels
Customize-able buffer zone around the key level
Divergence Detection - Hidden and Regular
Customize-able Pivot detection (for divergences)
Integration of proprietary momentum oscillator.
Alerts when divergences happen in key level zones.