Multi-Mode Grid StrategyGrid Strategy (SIMPLE)
█ Overview
This script is a system trading tool designed to generate cash flow from market volatility without relying on short-term directional predictions. It operates on the principle of Grid Trading , creating a mesh of buy and sell orders within a user-defined price range.
The strategy automates the process of "buying the dip" and "selling the bounce" repeatedly. It is most effective in sideways markets or during accumulation phases where the price oscillates within a specific channel.
█ TRADING MINDSET & SETUP GUIDE
To use this tool effectively, you must shift your perspective from "Sniper" (trying to hit the perfect entry) to "Manager" (managing a zone). Here is the required mindset for setting up this strategy:
Shift from Prediction to Range Definition
Don't ask: "Will the price go up or down tomorrow?"
Ask instead: "What is the price range the asset is unlikely to break out of in the coming weeks?"
Your primary job is to define the Grid Top Price (Ceiling) and Grid Bottom Price (Floor). As long as the price stays within this "Arena," the strategy will continue to execute trades.
Embrace Volatility as Fuel
For a trend follower, chop/sideways action is a nightmare. For a Grid Trader, it is fuel. Every time the price crosses a grid line down, it builds inventory. Every time it crosses back up, it realizes profit. You want the price to wiggle as much as possible within your defined boundaries.
Capital Allocation & Survivability
The biggest risk in grid trading is the price crashing below your Grid Bottom Price .
Mindset Check: Before launching, assume the price WILL drop to your bottom price immediately. Can your account handle that drawdown?
The script includes leverage and capital percentage inputs to help you size your position correctly. Never allocate 100% of your capital to a tight range without understanding the liquidation risk.
█ HOW IT WORKS
Grid Construction:
The script divides the space between your Upper Border and Lower Border into specific levels based on the Grid Quantity .
- Arithmetic: Equal spacing between lines (Standard).
- Geometric: Spacing based on mathematical ratios (useful for wider ranges).
Execution Logic:
- Entry: When price crosses below a grid line, a Long position is opened.
- Exit: When price bounces back up by a specific number of grid levels (defined by "Distance of TP"), the specific position is closed for a profit.
Time & Backtesting:
You can set specific Start and End Times . This allows you to backtest how the grid would have performed during specific historical volatility events before deploying it on live markets.
█ VISUALIZATION DASHBOARD
To keep you informed without cluttering the chart, the script features an information table at the bottom right:
Cash Out: Total realized profit booked into the account.
Open Position: How many grid levels are currently active (holding bags) vs. total levels.
Open Trade: The current floating P/L of held positions (Unrealized).
Max Drawdown: The deepest drawdown the strategy experienced during the test period.
RISK DISCLAIMER
Grid trading involves significant risk, particularly in strong trending markets that break out of your range against your position. This strategy does not use a stop-loss per trade; it relies on the user defining a safe "Bottom Price" and allocating capital accordingly. Past performance in backtesting does not guarantee future results. This script is a tool for execution and analysis, not financial advice.
Leverage

Stoch TraderSimple example strategy that has greater than 60% win rate on 1m, 3m, and 5m views. Using something as simple as this with leverage can produce decent returns within 15-30min. It's also very easy to lose money doing this.
LETF Leveraged Edge Strategy v1.5Overview
The strategy is based on Stochastics to detect trends and then makes Buys and Sell based on custom entry and exit criteria as described below in the Execution Logic Rules section. It will NOT work with standard Stochastics.
This is not a standard Stochastics implementation. It has been customized and modified, and does not match any widely known Stochastics variations (like Fast, Slow, or Full Stochastics) in its smoothing and iterative calculation process with:
• A unique smoothing mechanism.
• Iterative calculations.
• Additional conditional logic for strategy execution.
This strategy is designed to focus on volatile, liquid leveraged ETFs to capture gains equal to or better than Buy and Hold, and mitigate the risk of trading with a goal of reducing drawdown to a lot less than Buy and Hold. It has had successful backtest performance to varying degrees with TQQQ, SOXL, FNGU, TECL, FAS, UPRO, NAIL and SPXL. Results have not been good on other LETFs that have been backtested.
Performance
In this backtest the Net Profit shows to be $4,561 or 45.61%. Considering the initial order size was $1,000 I have to wonder if the Strategy Tester is calculating this correctly. The Strategy Tester Performance Summary shows the Buy and Hold Return at $61,165 or 611.7%. Based on calculating the price of the last shares sold, less the price paid, times the number of initial shares purchased, my math shows the Buy and Hold Gain at $4,572 or about equal with the strategy performance in this case. The Performance Summary also states the strategy had a Max DD of 3.46% which I believe is incorrect. Based on other backtests I’ve done, I believe the strategy drawdown here was closer to 28.4% and the Buy and Hold Drawdown at 82.7%. I manually calculated the Buy and Hold drawdown.
How it Works
The author provides training and support resource materials for this at his website. The strategy execution logic is driven by these rules:
Execution Logic Rules
Buy the LETF When:
BR #1a) The Daily Fast Line (FL) crosses above the Daily Slow Line (SL) and the FL is between the Low (L*) and High (H*) Range set (often referred to as Oversold and Overbought Lines). This can execute (Buy) any trading day of the week.
BR #1b) Re-Buy the next day after any Stop or Take Profit Sell if the Buy Rule condition is true (FL is above SL), if not, remain in cash and wait for the next Buy Signal.
Sell the LETF When:
SR #1a) The Daily Fast Line (FL) crosses below Daily Slow Line (SL) within the Low (L*) and High (H*) Range (often referred to as Oversold and Overbought Lines). “Crossunder Range Exit” This can execute (Sell) any trading day of the week.
SR #1b) If the (FL) crosses Below the SL above the Exit Level*, wait. Only Sell if the FL drops down below the Exit Level* “Crossunder Level Exit” This can execute (Sell) any trading day of the week.
SR #2a) Sell at the open any day the gap-down price is at or below the 1-Day Stop%*, based on previous day’s closing price (Execute on the day it happens.)
SR #2b) Sell intraday any day the price is at or below the 1-Day Stop %*, based on previous day’s closing price (Execute on the day it happens.)
SR #3a) Sell at the open any day the price is at or below the Trailing Stop %*, based on highest intraday price since Buy date (Execute on the day it happens.)
SR #3b) Sell intraday any day the price is at or below the Trailing Stop%*, based on highest intraday price since Buy date (Execute on the day it happens.)
SR #4) Sell any day when the opening price exceeds, or intraday price meets the Profit Target % price* (Execute on the day it happens.)
SR #5) After each Sell go to Rule BR #1b to determine if a Re-Buy should occur the next day, or stay in cash until next Buy Signal
Settings:
Properties Tab – Initial Capital has been set to $10,000 and order size 10% of Equity, 0.1% commission and 3 Ticks for slippage. Net order size is $1,000
Input Tab:
Stochastic
Timeframe is selected to Daily or Weekly based on preference. Daily has more trades, but on average higher profitability.
Type: Proprietary (best selection for most LETFs, but a few will work better with the Full selection
%k Length 20, %K Smoothing 14, %D Smoothing (many LETFs work better with a specific Stoch setting, often each different) A List of these is provided for your starting point.
Trade Settings
Direction: Longs (This strategy only works on the Long side)
Stop Type: Trailing is recommended, but Fixed is an option.
Stop % (based on user risk tolerance)
PD Stop % (Suggest start at 5%. Based on volatility of LETF and is a stop percentage from prior day’s close. Designed to protect against sudden market volatility. Will need to balance between strategy performance and user risk tolerance)
Profit Target: User preference. (I can help with suggestions based on historical performance)
Entry/Exit Conditions
Enter on Tie: Default Checked – if a Fast line crosses a Slow line for a Buy signal, but doesn’t do so in the range set, this will trigger if it crosses at a tie.
Renter – Default Checked – If stopped out of a position, this tells the strategy to re-buy the position the next day if the conditions are still positive.
Exit Level: This is a exit level for a Fast cross below a Slow line that takes place above the Sell Range, but only happens if the Fast continues down to the level set. These usually don’t happen often, but can have a significant impact on performance. Unfortunately, it’s a trial and error process starting with 90 and working down to see if there’s any positive impact.
Trade Range
Buy Range: Start at typical 20 to 80. Expand the low end down first to check on performance impact. Normally a wide buying range is better for performance.
Sell Range: Start at 20 to 80 and tighten gradually to see performance impact. In some cases a very tight sell range does better. I have worked on our primary LETFs for many months to determine ranges for each that typically produce better results.
External Indicator: Some additional indicators have a positive impact on the strategy performance by increasing P/l, reducing drawdown and reducing the number of trades. This is not always the case and each LETF and time period for the LETF will have a bearing on whether the secondary indicator will help or not. Two that have helped are the MACD Histogram, and the Sloe-Velocity Indicator by Kamleshkumar43. Sometimes a couple of different indicators will have a positive impact, then it’s a personal preference which you pick to use with the strategy.
Since this strategy is focused on a very narrow selection of liquid LETFs, I have a lot of experience experimenting with the settings for the primary ones and can suggest things that will help. Additional training on the rules, working with the settings, and mitigating some of the negative trades during choppy markets is available at the website.
Chart
The strategy can be selected to use either a Daily or Weekly version of stochastic. This is important because the characteristics are different while still generating very good gains and minimal drawdowns. Generally, the daily stochastic will have a greater number of, and certainly more frequent, trades than the weekly stochastic. However, on average the daily version of the stochastic will generates greater profitability.
The Settings tabs have tooltip icons that will assist in inputting values that correspond to the written rules for the strategy, and some include specific rule detail.
Buying
The strategy generates Buy signals with the Fast line crossing over the Slow line within a “Buy Range” which is adjusted based on volatility of the leveraged ETF. This is unique in that a default is set for these entries to occur if the values are tied and doesn’t need to be within the high and low range if that occurs. The trader can select in the strategy for this to occur the same day, if he’s selected a Daily Stochastic timeframe, or at the end of the trading week if he’s selected a Weekly stochastic timeframe. The volatility of a leveraged ETF will sometimes cause a shake-out exit, a trailing stop can be hit, or there can be an exit based on taking a profit. A big part of the timing challenge was how to handle these. The strategy normally (set as a default) will immediately re-buy the next day only if the original buy conditions are still true. This helps capture gains when conditions are still favorable but keeps the trader out when they’re not.
Selling
Exits are handled in several ways. The strategy will exit if there is a fast line cross below a slow line within the “range”. The range is adjusted based on volatility of the leveraged ETF. The exit occurs at the close of the day if the trader has selected to use a Daily stochastic setting. The exit will occur at the end of the trading week if the trader has chosen a weekly stochastic strategy. The trader will set a level based on the instrument and volatility for another exit type. The level will sometimes coincide with the range exit high level but does not need to. If a fast line crosses down through a slow line above the level set, and then comes down to that level, the strategy will exit the position.
Another unique aspect of the strategy is the PD Stop setting. This is short for “Prior Day”, Rather than a normal stop based on the price paid for a position, the PD Stop is based on a percentage drop from the previous day’s closing price. This helps account for the volatility of the leveraged ETF and will cause an exit quickly if there’s a market, or index moving event. This helps capture gains and reduce risk should there be continued pullback.
Exits will also occur based on setting a trailing stop level and profit taking level. These are adjusted based on the leveraged ETFs volatility and historical performance.
Limitations
Choppy, or sideways markets are the most prone to poor performance and potential for being stopped out multiple times. If stopped out two consecutive times, make sure you’re monitoring market health and there are clear signs of a new uptrend such as a 10D and 21D MA in proper alignment and moving up. If you get a Buy signal from the strategy and you’re not confident yet about market and price direction then it’s fine to wait a day, or several days, to enter after the Buy signal when you have greater confidence about market direction. The author can help with a short list of tactical rules developed for these sideways or choppy markets.
This strategy has proven successful backtest results with a very limited set of LETFs as discussed earlier. The author does not know if it will prove successful with any others, or other types of ETFs such as 2X or plain ETFs. A lot more testing needs to be done.
The strategy buys and sells , excluding stops or take profit, at the market close. It can be very challenging to enter an order at market close.
Disclaimer
Please remember that past performance may not be indicative of future results.
Due to various factors, including changing market conditions, the strategy may no longer perform as well as in historical backtesting. This post and the script do not provide any financial advice and are for educational and entertainment purposes only.

Bitcoin Leverage Sentiment - Strategy [presentTrading]█ Introduction and How it is Different
The "Bitcoin Leverage Sentiment - Strategy " represents a novel approach in the realm of cryptocurrency trading by focusing on sentiment analysis through leveraged positions in Bitcoin. Unlike traditional strategies that primarily rely on price action or technical indicators, this strategy leverages the power of Z-Score analysis to gauge market sentiment by examining the ratio of leveraged long to short positions. By assessing how far the current sentiment deviates from the historical norm, it provides a unique lens to spot potential reversals or continuation in market trends, making it an innovative tool for traders who wish to incorporate market psychology into their trading arsenal.
BTC 4h L/S Performance
local
█ Strategy, How It Works: Detailed Explanation
🔶 Data Collection and Ratio Calculation
Firstly, the strategy acquires data on leveraged long (**`priceLongs`**) and short positions (**`priceShorts`**) for Bitcoin. The primary metric of interest is the ratio of long positions relative to the total of both long and short positions:
BTC Ratio=priceLongs / (priceLongs+priceShorts)
This ratio reflects the prevailing market sentiment, where values closer to 1 indicate a bullish sentiment (dominance of long positions), and values closer to 0 suggest bearish sentiment (prevalence of short positions).
🔶 Z-Score Calculation
The Z-Score is then calculated to standardize the BTC Ratio, allowing for comparison across different time periods. The Z-Score formula is:
Z = (X - μ) / σ
Where:
- X is the current BTC Ratio.
- μ is the mean of the BTC Ratio over a specified period (**`zScoreCalculationPeriod`**).
- σ is the standard deviation of the BTC Ratio over the same period.
The Z-Score helps quantify how far the current sentiment deviates from the historical norm, with high positive values indicating extreme bullish sentiment and high negative values signaling extreme bearish sentiment.
🔶 Signal Generation: Trading signals are derived from the Z-Score as follows:
Long Entry Signal: Occurs when the BTC Ratio Z-Score crosses above the thresholdLongEntry, suggesting bullish sentiment.
- Condition for Long Entry = BTC Ratio Z-Score > thresholdLongEntry
Long Exit/Short Entry Signal: Triggered when the BTC Ratio Z-Score drops below thresholdLongExit for exiting longs or below thresholdShortEntry for entering shorts, indicating a shift to bearish sentiment.
- Condition for Long Exit/Short Entry = BTC Ratio Z-Score < thresholdLongExit or BTC Ratio Z-Score < thresholdShortEntry
Short Exit Signal: Happens when the BTC Ratio Z-Score exceeds the thresholdShortExit, hinting at reducing bearish sentiment and a potential switch to bullish conditions.
- Condition for Short Exit = BTC Ratio Z-Score > thresholdShortExit
🔶Implementation and Visualization: The strategy applies these conditions for trade management, aligning with the selected trade direction. It visualizes the BTC Ratio Z-Score with horizontal lines at entry and exit thresholds, illustrating the current sentiment against historical norms.
█ Trade Direction
The strategy offers flexibility in trade direction, allowing users to choose between long, short, or both, depending on their market outlook and risk tolerance. This adaptability ensures that traders can align the strategy with their individual trading style and market conditions.
█ Usage
To employ this strategy effectively:
1. Customization: Begin by setting the trade direction and adjusting the Z-Score calculation period and entry/exit thresholds to match your trading preferences.
2. Observation: Monitor the Z-Score and its moving average for potential trading signals. Look for crossover events relative to the predefined thresholds to identify entry and exit points.
3. Confirmation: Consider using additional analysis or indicators for signal confirmation, ensuring a comprehensive approach to decision-making.
█ Default Settings
- Trade Direction: Determines if the strategy engages in long, short, or both types of trades, impacting its adaptability to market conditions.
- Timeframe Input: Influences signal frequency and sensitivity, affecting the strategy's responsiveness to market dynamics.
- Z-Score Calculation Period: Affects the strategy’s sensitivity to market changes, with longer periods smoothing data and shorter periods increasing responsiveness.
- Entry and Exit Thresholds: Set the Z-Score levels for initiating or exiting trades, balancing between capturing opportunities and minimizing false signals.
- Impact of Default Settings: Provides a balanced approach to leverage sentiment trading, with adjustments needed to optimize performance across various market conditions.

How to use Leverage in PineScriptI believe there are many friends who have been confused by the leverage problem of TradingView strategy, when backtesting, it is always unable to bring its own leverage, so it is impossible to do leverage sustained compounding, this key point, and many friends are looking forward to solve. In particular, the default_qty_value = 100, where 100 is the upper limit.
Here I have used the official RSI strategy for demonstration, using the qty to place orders. Through strategy.equity, leverage and close price, and rounding, directly calculate the specific number of contracts need to be opened.
I hope you can enjoy solving the leverage problem, and I look forward to your pointing out my problems and shortcomings to me. Thank you.

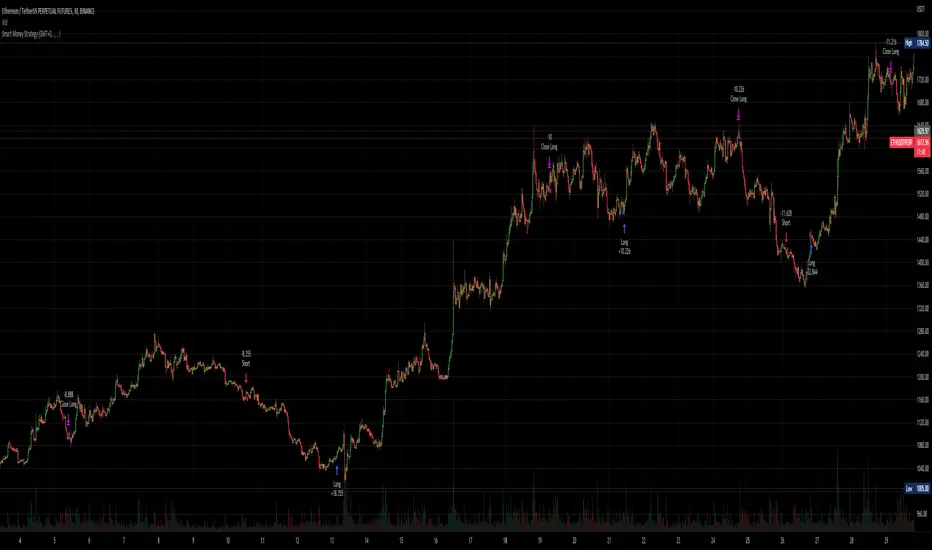
Smart Money - Oscillator and Volume StrategyOverview
This is a no-repaint strategy that is highly optimized for BINANCE:ETHUSDTPERP 30m, normal candles. It is a long/short strategy that is based on CMF, ADX/DMI, Keltner Channels, and other oscillators to identify smart money.
The overall idea of the strategy is to effectively capture the beginnings and ends of trends in price action, and go long/short accordingly. To achieve this, potential entry points are identified with various oscillators and these are then filtered using a variety of moving averages and strength/momentum indicators.
Short and sell inflections are found when ADX, DMI, and/or CMF oscillate below a specified threshold, and Keltner Channels are also used to indicate potential trades.
The indicator will continue to be updated and optimized for current and future market conditions.
If purchased, access to the indicator will be available within 24 hours.
Backtest Results
Parameters:
- 2021-01-01 to present (19 months)
- 100% equity order size
- 0.04% commission fees
- No leverage
17,089% net profit through 296 trades with 60.47% of trades being profitable.
Profit factor of 2.862, Sharpe Ratio of 1.158
Parameters:
- 2021-01-01 to present (19 months)
- $1,000 initial capital
- $1,000 order size
- 0.04% commission fees
- No leverage
584% net profit through 296 trades with 60.47% of trades being profitable.
Parameters:
- 2021-01-01 to present (19 months)
- 500% equity order size
- 0.04% commission fees
- 5x leverage
8,587,557% net profit through 299 trades with 59.87% of trades being profitable.
Hulk Strategy x35 Leverage 5m chart w/Alerts This strategy is a pullback strategy that utilizes 2 EMAs as a way of identifying trend, MACD as an entry signal, and RSI and ADX to filter bad trades. By using the confirmation of all of these indicators the strategy attempts to catch pullbacks, and it is optimized to wait for high probability setups. Take not that the strategy is optimized for use on BTCUSDT along with 35 times leverage(Using leverage is risky). The Hulk Strategy waits for strong trend confirmation and then attempts to identify pullbacks using MACD and RSI. By using these it identifies strong short term movement against the trend(hence the name Hulk). To use the strategy wait for the strategy to make an entry, and then enter with a stop loss of 1.1% and a take profit of 1.35% with respect to if it is a long or short position. The trade frequency of this strategy is high as it is made for use on the 5m timeframe. But this does not mean you will have to be staring at your computer constantly as an average of 1 trade takes place each day. This will vary a lot though, somedays the strategy enters up to 4 times. I wish you good trading and hope that you like this strategy!
P.S. The indicators on my chart are visualizations of the indicators used in the strategy, they are not necessary for the strategy to work though. Also the colored in cloud on the price chart is an EMA cloud and it comes with the strategy when you add it to your chart. This EMA cloud consists of two EMAs a 50 and a 200 EMA.

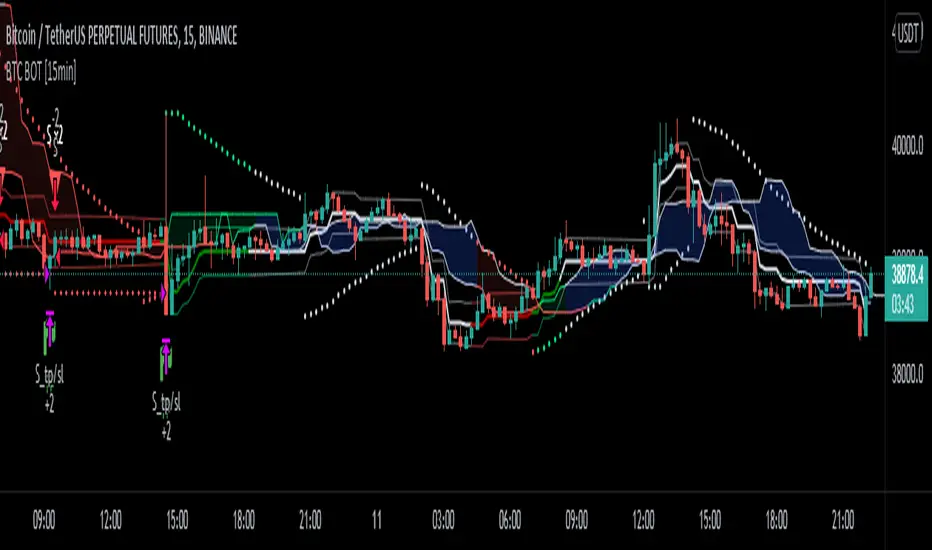
BTC BOT [15min]This BOT is specialy designed for BTCUSDT 15 min Chart. It reacts to every Upward/Downward direction as fast as possible. It does not work well on higher time frame.
This BOT using 10 indicators to open a basic LONG/SHORT position.
1. CLOUD
2. TREND DETECTOR
3. TREND STRENGTH
4. PARABOLIC SAR
5. JMA
6. RANGE FILTER
7. ADX
8. TWAP TREND
9. FAST MA
10. MOMENTUM
This BOT also use 02 independent strategies for entering positions.
1. REVESALS (RSI Crossovers)
2. SCALPING (It can increase net profit but it can be risky)
ADX is the main component of this BOT.
This is purely BTC 15min strategy but this BOT could be easily convert into Altcoins Scalper.
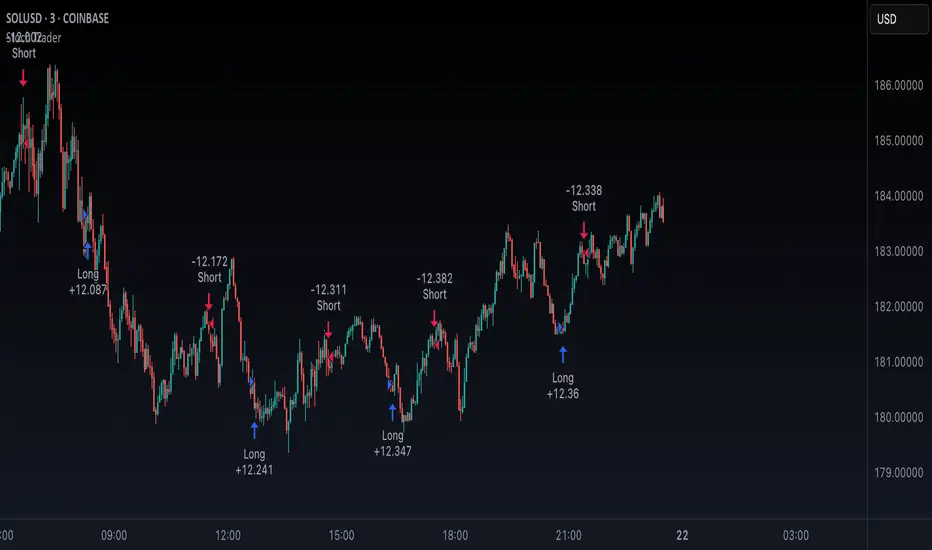
Ultimate ABC Reversal by @DaviddTechIn this indicator we are looking for HH & LL to create an ABC pattern.
Shorts are defined by an ABC pattern.
Short:
* Starting with a low to a Higher High
* Breaking that trend to a new low
* Creating a new Higher High (FOMO HH)
* If the price breaks below the previous HH we have our entry.
Longs:
* Starting with a Hight to a Lower Low
* Breaking that trend to a new high
* Creating a new Lower Low (FOMO LL)
* If the price breaks above the previous LL we have our entry.
Stop loss just above or below the FOMO LL/HH.
Take Profit using a Fib or Risk to Reward.
WARNING:
- For purpose educate only - My mission is to debunk fake strategies with code to find THE ONE.
- Plots EMAs and other values on chart.
- This script to change bars colors.
If you have any questions or feedback, please let me know in the comments.

How to use Leverage and Margin in PineScriptEn route to being absolutely the best and most complete trading platform out there, TradingView has just closed 2 gaps in their PineScript language.
It is now possible to create and backtest a strategy for trading with leverage.
Backtester now produces Margin Calls - so recognizes mid-trade drawdown and if it is too big for the broker to maintain your trade, some part of if will be instantly closed.
New additions were announced in official blogpost , but it lacked code examples, so I have decided to publish this script. Having said that - this is purely educational stuff.
█ LEVERAGE
Let's start with the Leverage. I will discuss this assuming we are always entering trades with some percentage of our equity balance (default_qty_type = strategy.percent_of_equity), not fixed order quantity.
If you want to trade with 1:1 leverage (so no leverage) and enter a trade with all money in your trading account, then first line of your strategy script must include this parameter:
default_qty_value = 100 // which stands for 100%
Now, if you want to trade with 30:1 leverage, you need to multipy the quantity by 30x, so you'd get 30 x 100 = 3000:
default_qty_value = 3000 // which stands for 3000%
And you can play around with this value as you wish, so if you want to enter each trade with 10% equity on 15:1 leverage you'd get default_qty_value = 150.
That's easy. Of course you can modify this quantity value not only in the script, but also afterwards in Script Settings popup, "Properties" tab.
█ MARGIN
Second newly released feature is Margin calculation together with Margin Calls. If the market goes against your trades and your trading account cannot maintain mid-trade drawdown - those trades will be closed in full or partly. Also, if your trading account cannot afford to open more trades (pyramiding those trades), Margin mechanism will prevent them from being entered.
I will not go into details about how Margin calculation works, it was all explainged in above mentioned blogpost and documentation .
All you need to do is to add two parameters to the opening line of your script:
margin_long = 1./30*50, margin_short = 1./30*50
Whereas "30" is a leverage scale as in 30:1, and "50" stands for 50% of Margin required by your broker. Personally the Required Margin number I've met most often is 50%, so I'm using value 50 here, but there are literally 1000+ brokers in this world and this is individual decision by each of them, so you'd better ask yourself.
--------------------
Please note, that if you ever encounter a strategy which triggers Margin Call at least once, then it is probably a very bad strategy. Margin Call is a last resort, last security measure - all the risks should be calculated by the strategy algorithm before it is ever hit. So if you see a Margin Call being triggred, then something is wrong with risk management of the strategy. Therefore - don't use it!

Crypto Strategy for Bearish Markets (Binance, FTX, Futures...)BINANCE:BTCUSDTPERP
Even in months like May '21 you can win by going long on Bitcoin. This strategy proves it and is not overwhelmed by Elon's ...
The backtest was carried out during the month of May of this year and, as you can see, all the long operations opened during the fall were successful.
So if we are going to continue to have a bear market for some time, why not take advantage of it while we remain bulls?
This strategy uses Dollar-Cost-Average (DCA) to average the entry price. Thanks to this, it is able to close profitable trades even in times of great volatility and bearish pressure.
It includes alerts that can be configured that will be sent every time the conditions to operate are met. These alerts can also be linked with 3commas for a fully automatic operation.
For Leverage Futures or Margin traders, all you have to do is divide the initial capital by the leverage used.
Enjoy!

IBVOL SignalsThis indicator can be used for swing algorithmic trading. It will give Buy and Sell signals on the chart based on concepts of volatility and momentum.
This works for the IBVOL-USD token on FTX exchange.
Value for the traders: During periods of sideways price action by BTCUSD, the value of IBVOL will go up and the indicator will give a buy signal and traders will profit if they buy the token. Just before an impending volatility, such as spike of BTC price, it will signal a sell, so traders can sell this token and reinvest their profits in BTC trade.
The strategy has so far had 100% hit rate, with very low drawdown (0.01%), and high profit factor of 2176.
For access please contact me via DM on TradingView.

London breakout GBPUSD daytradeHello,
First I want to WARN THAT YOU NEED A MINIMUM OF 30X LEVERAGE FOR THIS STRATEGY IN ORDER TO WORK.
THE REASON IS THAT THE SIZE IS CALCULATED BASED ON A VERY SHORT STOP LOSS LEVEL IN PIPS
UTILIZE IT AT YOUR OWN RISK
This is a daytrading strategy, that's suited for GBPUSD 1H timechart.
It a very simple strategy that utilizes 2 moving averages : a very fast one and a very slow one.
It will always enter only at the beginning candle of London session, and it will always exit at the candle at the finish of London session.
So the rules are simple :
If its 8 am GMT and the candle close or high cross the slow moving average and we are above at the same over the slow moving average we make a long movement. The oposite condition is applied for short.
At the same time we always use a very small stop loss = 50-100 points ( 5-10 pips).
We dont have a take profit, in our case the trade ends always at the end of London session. In this case at 15h GMT
It might work on other currencies aswell, but it has to be tested first.
For any questions or suggestions, please let me know.

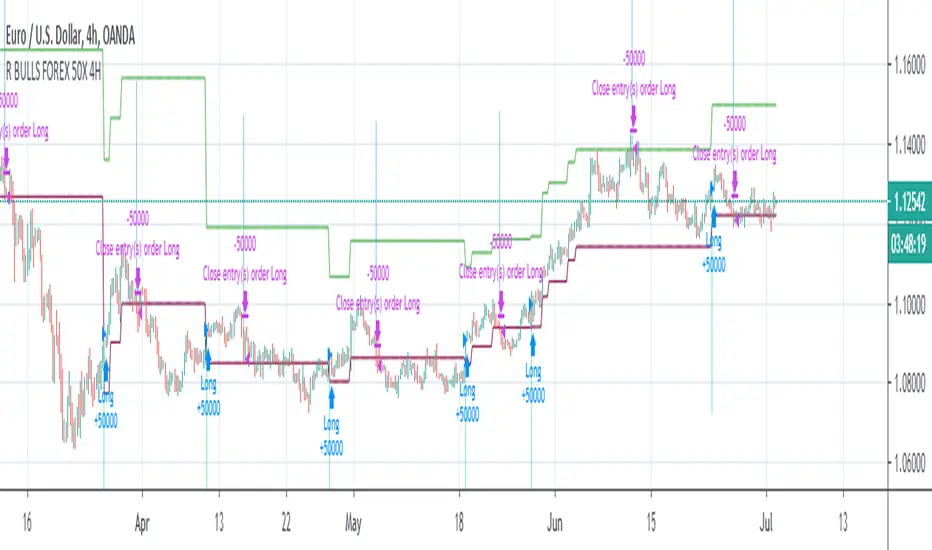
Relativity BEARS FOREX 50X 4H AlgorithmHello, this script is the correction of my old script related to Forex. (Bear market)
Old script :
4H was chosen as the time frame.
Thus, larger pips are at our disposal and we benefit more from the hedge effect of the leverage.
Commissions per trade have been removed to get more realistic commissions.
Because every wrong trade deletes all the 1% position size.
(with leverage effect)
Use the links below to obtain access to this indicator :

Relativity BULLS FOREX 50X 4H Algorithm
Hello, this script is the correction of my bull script related to Forex. (Bull market)
Old script :
4H was chosen as the time frame.
Thus, larger pips are at our disposal and we benefit more from the hedge effect of the leverage.
Commissions per trade have been removed to get more realistic commissions.
Because every wrong trade deletes all the 1% position size.
(with leverage effect)
Use the link below to obtain access to this indicator :
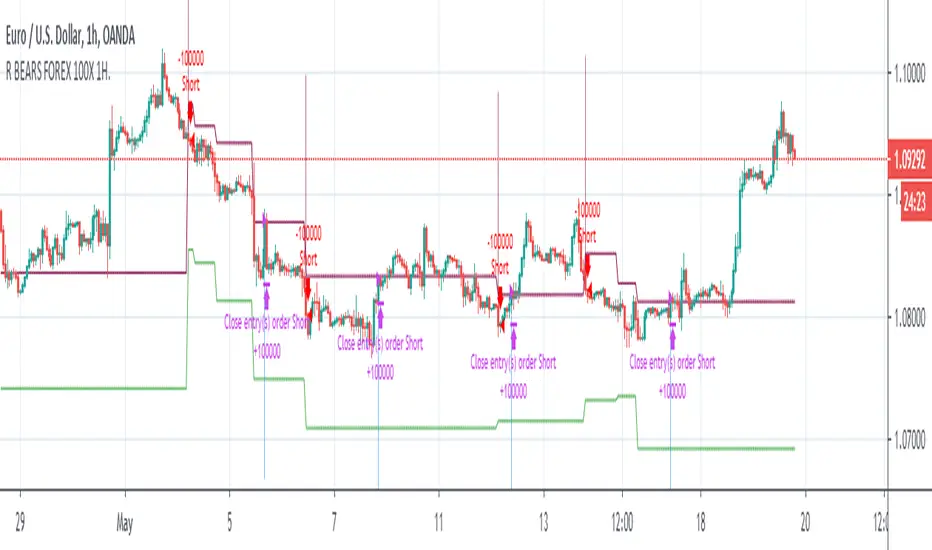
Relativity BEARS FOREX 100X 1H AlgorithmHi,
This system is prepared only for leveraged markets and only for Forex.
System parameters:
Timeframe = 1H (1 Hours)
Leverage = 100X
Position Size = %1 (0.01) Each Trade
System features :
- It targets the Risk /Reward Ratio of 1/3 and above. (Risk/Reward Ratio >= 3 )
- If a Take Profit Point has come in a successful trade but the parameter conformity has not deteriorated, system continues the trade.
- In this way, you can catch strong short trends several times a year.
But it is strict as stop-loss and avoids large declines,whipsaws whenever possible.
- The system tries to avoid unnecessary processes as much as possible.
This means less commission and less sideways market.
- Since it takes advantage of the reverse market, it is suitable not only for long and short but only for short position, ie "bears".
But this neutralizes unnecessary processes.
- Stop-Loss points and Take Profit (TP) points are shown in red and green.
-However, if there is a small amount of follow-up available at the computer, it is recommended to put stop-loss only.
Because the system revises both stop-loss and take profit points according to the conditions formed.
Doing this in the right major long trend here allows you to be in trades.
-The system takes into account the risk and only opens transactions where the value corresponding to 100 leverage ratio is greater than the risk.
This provides as much protection from risk as possible.
-Alerts added.
***Since it is located in the most risky market, the forex market, a balanced algorithm has been optimized, considering that it has a very unstable structure similar to dilithrium crystals (same logic as investment bank trader test).
So if this algorithm was a person, it would be an incredibly disciplined but equally skeptical person =)
Also, like other systems, this system also uses ANN (Artificial Neural Networks).
About Backtest :
Since this system is for leveraged market, backtest results are not healthy.
But since it targets the 1/3 Risk Reward Rate (3.00),
we must look Ratio Avg Win/Loss and it must be over 0.5 because :
This ratio means: When we reach 33% of our correct trades in all our trades, we are at breakeven.
This is 100 - 33 = 66
33/66 = 0.5
So whenever this rate is over 0.5, we make a profit.
*** The fact that this ratio must over 0.75 (worst scenario) in terms of securing ourselves because there will be extra comission fees for worst scenario.
Above this ratios ,we can do successful snowball trades.
And we achieve success cumulatively.
Important Note : This system is prepared only for these parameters.
NOTE :
The system has been prepared as a strategy to present success in a transparent manner.
Please check "Ratio Avg . Win / Avg Loss" rates in backtests.
Important Note 2 -
Although the system revises the stop and take profit points in the required parameters, the most accurate place is when the signal comes.
It should be entered when the signal comes as much as possible and if this did not happen,
trade must be opened in the nearest bars after the signal comes.
Best regards.
EDIT : Comission added. (%0.1)
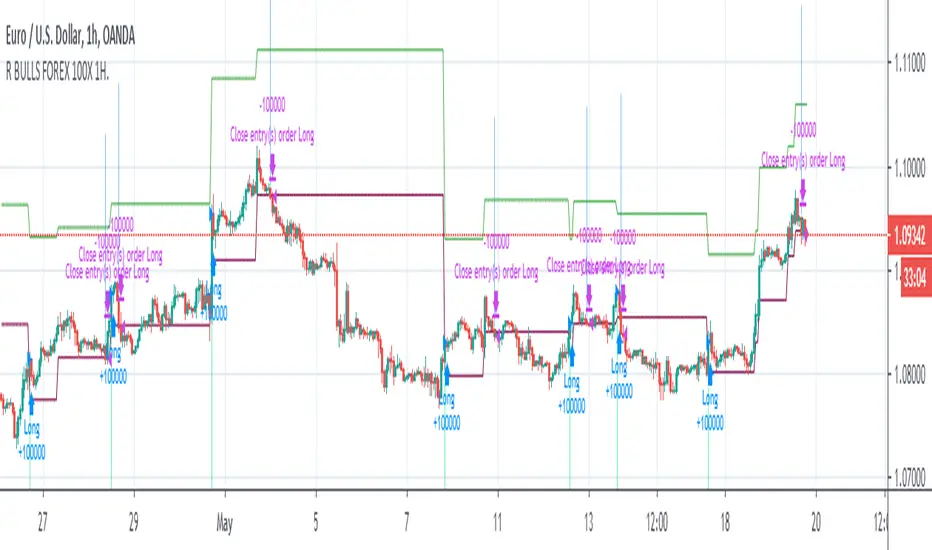
Relativity BULLS FOREX 100X 1H AlgorithmHi,
This system is prepared only for leveraged markets and only for Forex.
System parameters:
Timeframe = 1H (1 Hours)
Leverage = 100X
Position Size = %1 (0.01) Each Trade
System features :
- It targets the Risk /Reward Ratio of 1/3 and above. (Risk/Reward Ratio >= 3 )
- If a Take Profit Point has come in a successful trade but the parameter conformity has not deteriorated, system continues the trade.
- In this way, you can catch strong long trends several times a year.
But it is strict as stop-loss and avoids large declines,whipsaws whenever possible.
- The system tries to avoid unnecessary processes as much as possible.
This means less commission and less sideways market.
- Since it takes advantage of the reverse market, it is suitable not only for long and short but only for long position, ie "bulls".
But this neutralizes unnecessary processes.
- Stop-Loss points and Snow-take points are shown in red and green.
-However, if there is a small amount of follow-up available at the computer, it is recommended to put stop-loss only.
Because the system revises both stop-loss and take profit points according to the conditions formed.
Doing this in the right major long trend here allows you to be in trades.
-The system takes into account the risk and only opens transactions where the value corresponding to 100 leverage ratio is greater than the risk.
This provides as much protection from risk as possible.
-Alerts added.
***Since it is located in the most risky market, the forex market, a balanced algorithm has been optimized, considering that it has a very unstable structure similar to dilithrium crystals (same logic as investment bank trader test).
So if this algorithm was a person, it would be an incredibly disciplined but equally skeptical person =)
Also, like other systems, this system also uses ANN (Artificial Neural Networks).
About Backtest :
Since this system uses leveraged market, backtest results are not healthy.
But since it targets the 1/3 Risk Reward Rate (3.00),
we must look Ratio Avg Win/Loss and it must be over 0.5 because :
This ratio means: When we reach 33% of our correct trades in all our trades, we are at breakeven.
This is 100 - 33 = 66
33/66 = 0.5
So whenever this rate is over 0.5, we make a profit.
*** The fact that this ratio must over 0.75 (worst scenario) in terms of securing ourselves because there will be extra comission fees for worst scenario.
Above this ratios ,we can do successful snowball trades.(Because future contracts have loss of maturity and end dates)
And we achieve success cumulatively.
Important Note : This system is prepared only for these parameters.
NOTE :
The system has been prepared as a strategy to present success in a transparent manner.
Please check "Ratio Avg . Win / Avg Loss" rates in backtests.
Important Note 2 -
Although the system revises the stop and take profit points in the required parameters, the most accurate place is when the signal comes.
It should be entered when the signal comes as much as possible and if this did not happen,
trade must be opened in the nearest bars after the signal comes.
Best regards.
EDIT : Comission added. (%0.1)
Relativity BEARS FUTURES 50X 4H AlgorithmHi,
This system is prepared only for leveraged markets and for Futures and CFD markets.
Leveraged processing apply to cryptocurrency contracts that are also subject to.
System parameters:
Timeframe = 4H (4 Hours)
Leverage = 50X
Position Size = %1 (0.01) Each Trade
Market Direction : Short
System features :
- It targets the Risk /Reward Ratio of 1/3 and above. (Risk/Reward Ratio >= 3 )
- If a Take Profit Point has come in a successful trade but the parameter conformity has not deteriorated, system continues the trade.
- In this way, you can catch strong long trends several times a year.
But it is strict as stop-loss and avoids large declines,whipsaws whenever possible.
- The system tries to avoid unnecessary processes as much as possible.
This means less commission and less sideways market.
- Since it takes advantage of the reverse market, it is suitable not only for long and short but only for short position, ie "bears".
But this neutralizes unnecessary processes.
- Stop-Loss points and Snow-take points are shown in red and green.
-However, if there is a small amount of follow-up available at the computer, it is recommended to put stop-loss only.
Because the system revises both stop-loss and take profit points according to the conditions formed.
Doing this in the right major long trend here allows you to be in trades.
-The system takes into account the risk and only opens transactions where the value corresponding to 10 leverage ratio is greater than the risk.
This provides as much protection from risk as possible.
-Alerts added.
About Backtest :
Since this system uses leveraged market, backtest results are not healthy.
But since it targets the 1/3 Risk Reward Rate (3.00),
we must look Ratio Avg Win/Loss and it must be over 0.5 because :
This ratio means: When we reach 33% of our correct trades in all our trades, we are at breakeven.
This is 100 - 33 = 66
33/66 = 0.5 (Ratio Avg. Win / Avg Loss )
So whenever this rate is over 0.5, we make a profit.
*** The fact that this ratio is over 0.70-1.00 in terms of securing ourselves because there is a maturity in the future indicates that we are doing
successful snowball trades.(Because future contracts have loss of maturity and end dates)
And we achieve success cumulatively.
Important Note : This system is prepared only for these parameters.
These parameters are designed for Futures and CFDs.
It doesn't work in spot markets and Forex Markets.
NOTE :
The system has been prepared as a strategy to present success in a transparent manner.
Please check "Ratio Avg . Win / Avg Loss" rates in backtests.(Especially preferred financial instruments what you trade generally)
Important Note 2 -
Although the system revises the stop and take profit points in the required parameters, the most accurate place is when the signal comes.
It should be entered when the signal comes as much as possible and if this did not happen,
trade must be opened in the nearest bars after the signal comes.
If the position is not closed, renew your position in the new month by observing the maturity conditions.
Here you should pay attention to the maturity, the cost of transportation.
Because the more time to maturity, the more advantageous it will be.
Best regards.

Relativity BULLS FUTURES 50X 4H AlgorithmHi,
This system is prepared only for leveraged markets and for Futures and CFD markets.
Leveraged processing apply to cryptocurrency contracts that are also subject to.
System parameters:
Timeframe = 4H (4 Hours)
Leverage = 50X
Position Size = %1 (0.01) Each Trade
System features :
- It targets the Risk /Reward Ratio of 1/3 and above. (Risk/Reward Ratio >= 3 )
- If a Take Profit Point has come in a successful trade but the parameter conformity has not deteriorated, system continues the trade.
- In this way, you can catch strong long trends several times a year.
But it is strict as stop-loss and avoids large declines,whipsaws whenever possible.
- The system tries to avoid unnecessary processes as much as possible.
This means less commission and less sideways market.
- Since it takes advantage of the reverse market, it is suitable not only for long and short but only for long position, ie "bulls".
But this neutralizes unnecessary processes.
- Stop-Loss points and Snow-take points are shown in red and green.
-However, if there is a small amount of follow-up available at the computer, it is recommended to put stop-loss only.
Because the system revises both stop-loss and take profit points according to the conditions formed.
Doing this in the right major long trend here allows you to be in trades.
-The system takes into account the risk and only opens transactions where the value corresponding to 10 leverage ratio is greater than the risk.
This provides as much protection from risk as possible.
-Alerts added.
About Backtest :
Since this system uses leveraged market, backtest results are not healthy.
But since it targets the 1/3 Risk Reward Rate (3.00),
we must look Ratio Avg Win/Loss and it must be over 0.5 because :
This ratio means: When we reach 33% of our correct trades in all our trades, we are at breakeven.
This is 100 - 33 = 66
33/66 = 0.5
So whenever this rate is over 0.5, we make a profit.
*** The fact that this ratio is over 0.70-1.00 in terms of securing ourselves because there is a maturity in the future indicates that we are doing
successful snowball trades.(Because future contracts have loss of maturity and end dates)
And we achieve success cumulatively.
Important Note : This system is prepared only for these parameters.
These parameters are designed for Futures and CFDs.
It doesn't work in spot markets and Forex Markets.
NOTE :
The system has been prepared as a strategy to present success in a transparent manner.
Please check "Ratio Avg . Win / Avg Loss" rates in backtests.
Important Note 2 -
Although the system revises the stop and take profit points in the required parameters, the most accurate place is when the signal comes.
It should be entered when the signal comes as much as possible and if this did not happen,
trade must be opened in the nearest bars after the signal comes.
If the position is not closed, renew your position in the new month by observing the maturity conditions.
Here you should pay attention to the maturity, the cost of transportation.
Because the more time to maturity, the more advantageous it will be.
Best regards.

Relativity BEARS FUTURES 10X 1D AlgorithmHi,
This system is prepared only for leveraged markets and for Futures and CFD markets.
Leveraged processing apply to cryptocurrency contracts that are also subject to.
System parameters:
Timeframe = 1D (1 Day)
Leverage = 10x
Position Size = %1 (0.01) Each Trade
System features :
- It targets the Risk /Reward Ratio of 1/3 and above. (Risk/Reward Ratio >= 3 )
- If a Take Profit Point has come in a successful trade but the parameter conformity has not deteriorated, system continues the trade.
- In this way, you can catch strong long trends several times a year.
But it is strict as stop-loss and avoids large declines,whipsaws whenever possible.
- The system tries to avoid unnecessary processes as much as possible.
This means less commission and less sideways market.
- Since it takes advantage of the reverse market, it is suitable not only for long and short but only for short position, ie "bears".
But this neutralizes unnecessary processes.
- Stop-Loss points and Snow-take points are shown in red and green.
-However, if there is a small amount of follow-up available at the computer, it is recommended to put stop-loss only.
Because the system revises both stop-loss and take profit points according to the conditions formed.
Doing this in the right major long trend here allows you to be in trades.
-The system takes into account the risk and only opens transactions where the value corresponding to 10 leverage ratio is greater than the risk.
This provides as much protection from risk as possible.
-Alerts added.
About Backtest :
Since this system uses leveraged market, backtest results are not healthy.
But since it targets the 1/3 Risk Reward Rate (3.00),
we must look Ratio Avg Win/Loss and it must be over 0.5 because :
This ratio means: When we reach 33% of our correct trades in all our trades, we are at breakeven.
This is 100 - 33 = 66
33/66 = 0.5
So whenever this rate is over 0.5, we make a profit.
*** The fact that this ratio is over 0.70-1.00 in terms of securing ourselves because there is a maturity in the future indicates that we are doing
successful snowball trades.(Because future contracts have loss of maturity and end dates)
And we achieve success cumulatively.
Important Note : This system is prepared only for these parameters.
These parameters are designed for Futures and CFDs.
It doesn't work in spot markets and Forex Markets.
NOTE :
The system has been prepared as a strategy to present success in a transparent manner.
Please check "Ratio Avg . Win / Loss" rates in backtests.
Important Note 2 -
Although the system revises the stop and take profit points in the required parameters, the most accurate place is when the signal comes.
It should be entered when the signal comes as much as possible and if this did not happen,
trade must be opened in the nearest bars after the signal comes.
Here you should pay attention to the maturity, the cost of transportation.
Because the more time to maturity, the more advantageous it will be.
Best regards.

Relativity BULLS FUTURES 10X 1D AlgorithmHi,
This system is prepared only for leveraged markets and for Futures and CFD markets.
Leveraged processing apply to cryptocurrency contracts that are also subject to.
System parameters:
Timeframe = 1D (1 Day)
Leverage = 10x
Position Size = %1 (0.01) Each Trade
System features :
- It targets the Risk /Reward Ratio of 1/3 and above. (Risk/Reward Ratio >= 3 )
- If a Take Profit Point has come in a successful trade but the parameter conformity has not deteriorated, system continues the trade.
- In this way, you can catch strong long trends several times a year.
But it is strict as stop-loss and avoids large declines,whipsaws whenever possible.
- The system tries to avoid unnecessary processes as much as possible.
This means less commission and less sideways market.
- Since it takes advantage of the reverse market, it is suitable not only for long and short but only for long position, ie "bulls".
But this neutralizes unnecessary processes. (Short market direction, the system for bears will be published separately.)
- Stop-Loss points and Snow-take points are shown in red and green.
-However, if there is a small amount of follow-up available at the computer, it is recommended to put stop-loss only.
Because the system revises both stop-loss and take profit points according to the conditions formed.
Doing this in the right major long trend here allows you to be in trades.
-The system takes into account the risk and only opens transactions where the value corresponding to 10 leverage ratios is greater than the risk.
This provides as much protection from risk as possible.
-Alerts added.
About Backtest :
Since this system uses leveraged market, backtest results are not healthy.
But since it targets the 1/3 Risk Reward Rate (3.00),
we must look Ratio Avg Win/Loss and it must be over 0.5 because :
This ratio means: When we reach 33% of our correct trades in all our trades, we are at breakeven.
This is 100 - 33 = 66
33/66 = 0.5
So whenever this rate is over 0.5, we make a profit.
*** The fact that this ratio is over 0.70-1.00 in terms of securing ourselves because there is a maturity in the future indicates that we are doing
successful snowball trades.(Because future contracts have loss of maturity and end dates)
And we achieve success cumulatively.
Important Note : This system is prepared only for these parameters.
These parameters are designed for Futures and CFDs.
It doesn't work in spot markets.
NOTE :
The system has been prepared as a strategy to present success in a transparent manner.
Please check "Ratio Avg. Win / Loss" rates in backtests.
Important Note 2 -
Although the system revises the stop and take profit points in the required parameters, the most accurate place is when the signal comes.
It should be entered when the signal comes as much as possible and if this did not happen,
trade must be opened in the nearest bars after the signal comes.
Best regards.

Leverage Strategy and a few words on risk/opportunityHello traders,
I started this script as a joke for someone... finally appears it could be used for educational content
Let's talk about leverage and margin call
Margin Call
A margin call is the broker's demand that an investor deposit additional money or securities so that the account is brought up to the minimum value, known as the maintenance margin.
A margin call usually means that one or more of the securities held in the margin account has decreased in value below a certain point.
Leverage
A leverage is a system which allows the trader to open positions much larger than his own capital. ... “Leverage” usually refers to the ratio between the position value and the investment needed,
Strat
The strategy simulates long/short positions on a 4h high/low breakout based on the chart candle close.
The panel below shows the strategy equity curve. Activating the margin call option will show when the account would be margin called giving the settings
Casino
I'm not doing any financial recommendation here.
I made this strategy so that people include more risk management metrics into their strategy.
From the code, we see it's fairly easy to calculate a leveraged position size and a margin call flag - when that flag is hit, the system stops trading.
I simplified things to the extreme here but my point is that the leverage is a double-edge sword gift.
Assuming we always take the same position sizing, increasing the leverage speed up how fast a margin could be ..... called. (bad joke? feel free to tell me). Not saying it will, saying it introduces more risk by design.
Then one could say "I'll just turn off that stupid margin call option". And that's when someone starts backtesting with unrealistic market conditions.
Finally...
When I backtest I always assume the worst in every scenario possible (because I'm French), I always try to minimize the risk first (also because I'm French), keeping as close from 0 as possible (French again)
Then I add the "opportunity" component, looking to catch the maximum of opportunity while keeping the risk low.
It's like a Rubix cube puzzle - decreasing the risk is one side of the equation but whenever I try to catch more opportunity... my risks increases.
Then I update my risk... and now the opportunity decreases... (#wut #wen #simple)
Completely removing the risk from a trading strategy isn't something I wouldn't dare doing.
Trading involves risk. Being obsessed by decreasing the risk is what I do BEST :)
Dave

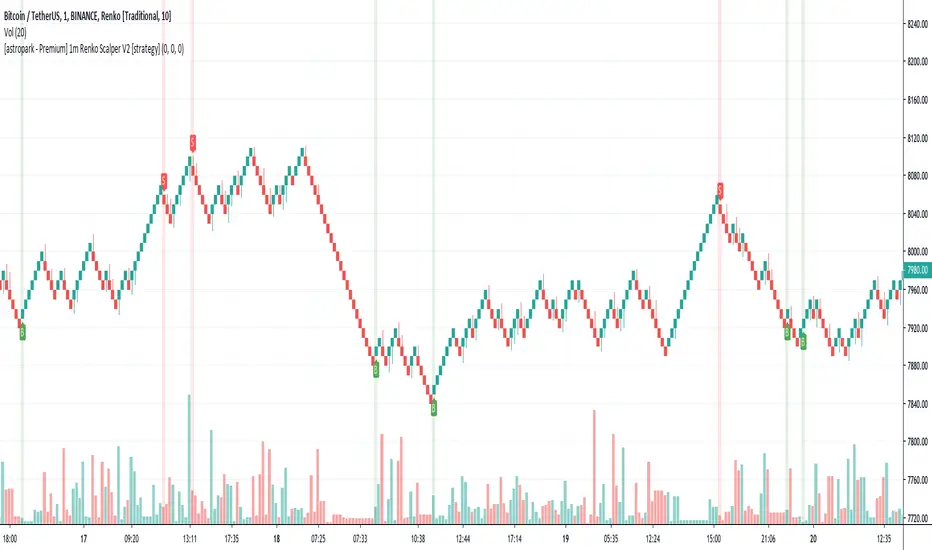
[astropark - Premium] 1m Renko Scalper V2 [strategy]Dear Followers,
today a new Scalper Tool , which works great on 1 minute timeframe , which is the best and more secure timeframe to use on a Renko chart, besides it works great up to 15m (I don't suggest to use a renko chart over 15m timeframe)!
It is an upgraded version of Bitmex Renko Scalper that you can find in my tradingview script page.
This tool has some cool features:
it works on 1 minute timeframe : so you can enjoy high-frequency trading by using a 24/7 running bot;
wait bricks optional mode : you may like to make script wait for triggering a new signal by waiting 1 or 2 more confirmation bricks
trailing stop : you can set a trailing stop in trade, so script will alert you if it will be reached in chart
This strategy can trigger till 5 buy or 5 sell signals in a row before reverting, so use a proper money management .
Strategy results are calculated on the timeframe from july to now, so on about 4 months, using 10000$ as initial capital and working at 3x leverage (very safe leverage!).
The user who wants to use this strategy, especially via an automated bot, must always set a stoploss at 5% from entry point or use a proper risk management strategy .
This is not the "Holy Grail", so use it with caution.
This script will let you backtest this script and find best settings for your preferred market. On Bitmex XBTUSD chart best settings is Traditional Renko chart with 10$ box size.
The alarms version of this indicator, which will let you set all notifications you may need in order to be alerted on each triggered signals, can be found by searching for "1m Renko Scalper V2".
This is a premium indicator , so send me a private message in order to get access to this script .