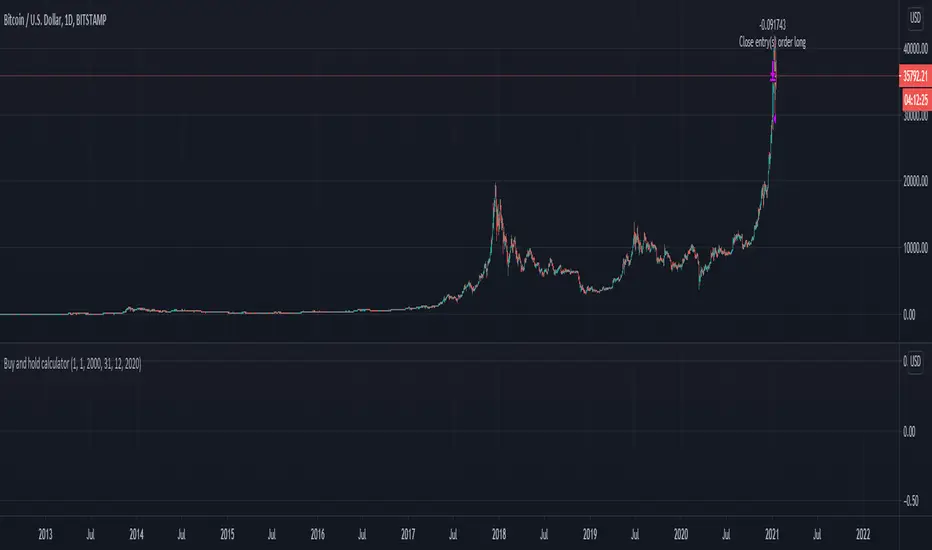
Buy and hold calculatorThis is a simple buy and hold calculator.
You have an initial date and once that dated it passed it will sell the product that was bought initially.
This strategy buys and sell 100% of the initial volume.
Longterm
Buy the Dips (by Coinrule)Taking your first steps into automated trading may be challenging. Coinrule's mission is to make it as easy as possible, also for beginners.
Here follows the best trading strategy to get started with Coinrule. This strategy doesn't involve complex indicators, yet was proved to be effective in the long term for many coins. Results seem to be improved when trading a coin vs Bitcoin.
The strategy buys the dips of a coin to sell with a profit. A stop-loss protects every trade.
Crypto markets offer high volatility and, thus, excellent opportunities for trading. Excluding times of severe downtrend, buying the dip is a simple and effective long-term trading strategy. The buy-signal is set to a 2% drop in a 30-minutes time frame.
Each trade comes with a take profit and a stop loss. Both set at 2%.
You can adjust these percentages to the market volatility as an advanced setup. You can backtest the outcomes using the backtesting tool from Tradingview
The strategy assumes each order to trade 30% of the available capital. A trading fee of 0.1% is taken into account. The fee is aligned to the base fee applied on Binance, which is the largest cryptocurrency exchange.

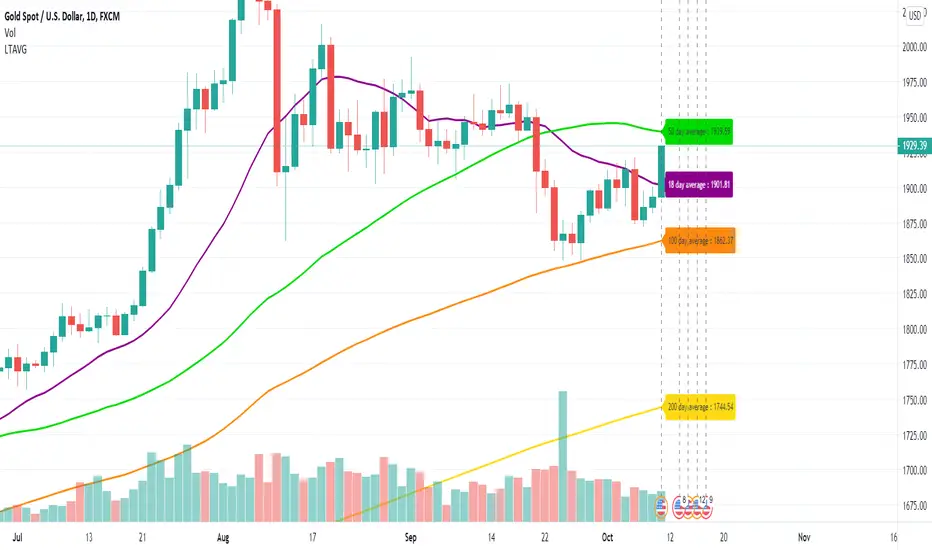
Long Term Moving AverageThis scripts plots the long term moving average calculated daily for 4 sets.
The default averages are:
18 day
50 day
100 day
200 day
The settings can be used to flexibly change this and to hide / show labels
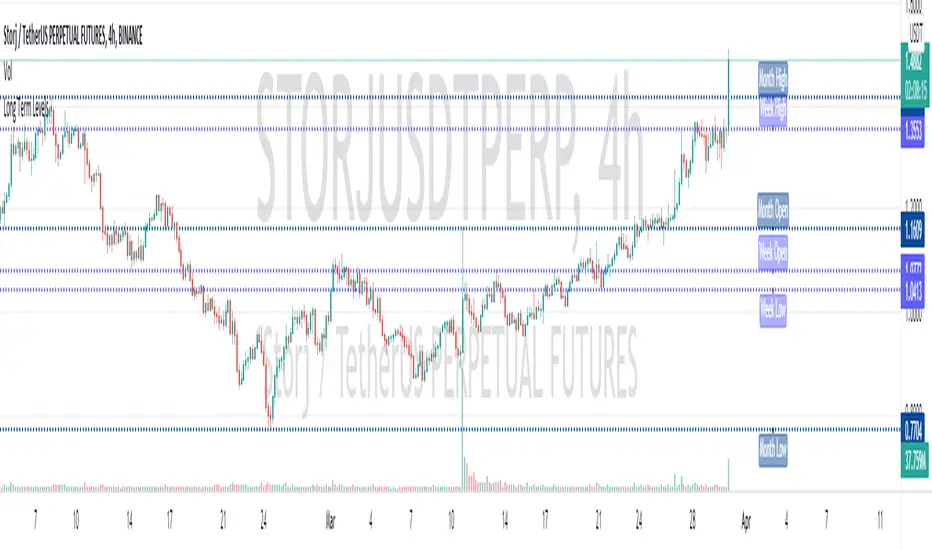
Long Term Levels (4h, D, W, M, Q, & Y)This shows and labels the highs and lows from the previous 4h, daily, weekly, monthly, quarterly and yearly session. By default it only shows weekly, monthly and yearly. It also has an option to use small labels (M vs Monthly High) to save your eyeballs. You may need to adjust your charts right hand margin to see them properly.
Everything is shown in very tasteful shades of blue. For a faster loading version of this check my other indicators.
GDAX EMA Cross[26,12]This indicator allow to show the EMA of the price similar to GDAX user interface.
The purpose of this indicator is twice:
Allowing the user to show a double EMA with the possibility to show when a EMA crossing happens.
Showing in a more user friendly interface the GDAX ema line.
As a matter of fact is proven that those 2 EMA act as support/resistance during Bulls/Bear periods. The indicator works fine in the GDax timeframes, or rather 5m, 15m, 1h and daily excluding 3h and 6h as they're less used at the moment.

Coppock Curve with its own Moving AverageIt shows Coppock with its own moving average. (Yes, in a way, 3 moving averages.)
Advised to use :
for long term, certainly not for day-trade;
on daily charts;
not as a standalone indicator, helps to read RSI, Klinger, TSI, CCI, etc.
as momentum-signaling: crossing 0, inflection points, crossover
as a quasi-centered, quasi oscillator, but not proportional always.
Weakness: mourning period certainly not the same for everyone.

MAGNUS® CyclesThis indicator will help you if you struggle making any profit in bitcoin.
It generates very few signals with very nice profit potential ( around 100% this year ! ).
Perfect tool for longterm swing traders and new traders that need help figuring out the midterm trend.
Use it with these parameters only:
weekly: 13, 5, 12
daily: 92, 21, 96
