Keltner-Aroon-EFI FlowKeltner-Aroon-EFI Flow - |K| |A| |E| |F|
KAE Flow is a quantitative trend-aggregation engine designed to determine the dominant market bias by fusing three distinct market dimensions: Volatility, Trend Strength, and Volume.
This script does not rely on a single metric. Instead, it creates a composite "Flow" score derived from the Daily timeframe to act as a high-level bias filter for intraday or swing trading.
1. The Quantitative Logic (The Engine)
The core of this indicator is the KAE Engine, which polls data from the Daily timeframe (by default) to ensure you are always trading in alignment with the macro trend. It aggregates three logical components:
K (Keltner Channels): Measures Volatility Breakouts.
Logic: Returns bullish if price closes above the Upper Channel, bearish if below the Lower Channel. This captures the expansion phase of price action.
A (Aroon): Measures Trend Age & Strength.
Logic: Returns bullish only if the Aroon Up is > 70 and dominating the Aroon Down. This ensures the trend is not just present, but mathematically strong.
E (Elder’s Force Index): Measures Volume-Weighted Momentum.
Logic: Uses volume pressure to confirm price moves. Positive smoothed force indicates bullish accumulation.
2. Signal Processing (ALMA)
Raw data is noisy. The KAE Flow takes the aggregated raw score from the components above and runs it through an ALMA (Arnaud Legoux Moving Average).
Why ALMA? It offers the best balance between smoothness and responsiveness, removing "false flips" in the trend bias while reacting quickly to genuine reversals.
The Color (The Bias):
Deep Blue: Strong Bullish Flow (KAE Score > 0.1). Look for Long entries .
White: Strong Bearish Flow (KAE Score < -0.1). Look for Short entries.
Gray: Neutral/Transition. Volatility is contracting or the trend is conflicting.
5. Settings & Configuration
Keltner/Aroon/EFI Lengths: Fully customizable to fit different asset classes (Crypto vs. Forex).
Active Smoothing: Toggle ALMA on/off.
Active Components: You can toggle specific engines (K, A, or E) on or off. Default uses Keltner + Aroon for a pure Price/Time analysis.
Risk Warning: This indicator pulls higher-timeframe data (Daily) to color lower-timeframes. While this provides a powerful macro view, be aware that closed candle data is used to prevent repainting issues in real-time.
D_Quant --- Trade With Discipline
Lowtimeframe

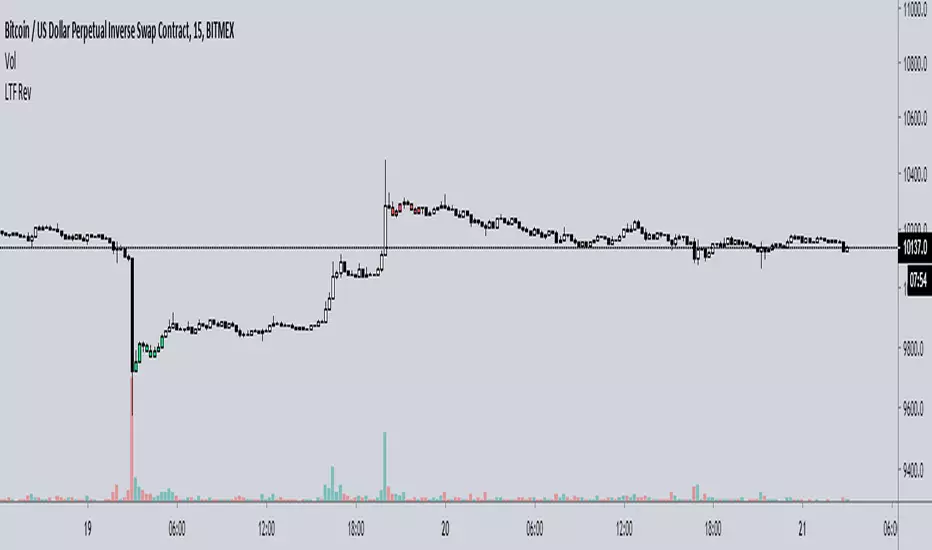
Overlay Mini Plot(s) of Correlated Asset(s)Overlay a small plot of a correlated asset of your choosing. Shrink/expand, Set vertical and horizontal position, plot multiple mini-plots via duplicate indicators with varied settings.
Plots the last X bars of any asset; including the live candle currently painting
Useful for low time frame trading when you want to see correlated asset price movement right alongside the price movement you're watching.
Useful for quick and simple comparisons; when you don't want the clutter of split screen or multi-pane view.
Useful for backtesting.
Price scale agnostic; just plots the shape of the recent price action, with several optional labels: Asset+timeframe | Live Price | Highest price over X bars | Lowest price over X bars.
Works fine with all the assets i've tested it on.
~~User inputs~~
-number of bars to paint.
-horizontal offset: plot to right X bars or to left X bars
-vertical offset: shift up or down, shrink or expand; by using 2 'spacer' inputs
-color/transparancy of candles and price labels.
-width (pixels) of candle bodies.
-choose to display price labels or not
-choose to display asset label or not
~~Tips~~
--Add several of these indicators; changing the vertical 'Shift/Shrink' settings on each to visually separate them.
--In the above chart or EurUsd, there are three indicators =>> three mini-plots overlaid: DXY, EurGbp and GbpUsd. Using the following settings for Space Above:Space Below: DXY- 0.1:4.5 | EurGbp- 1.8:1.8 | GbpUsd- 4.5:0.1
--the more you add, the more you'll have to vertically shrink the plots
© twingall

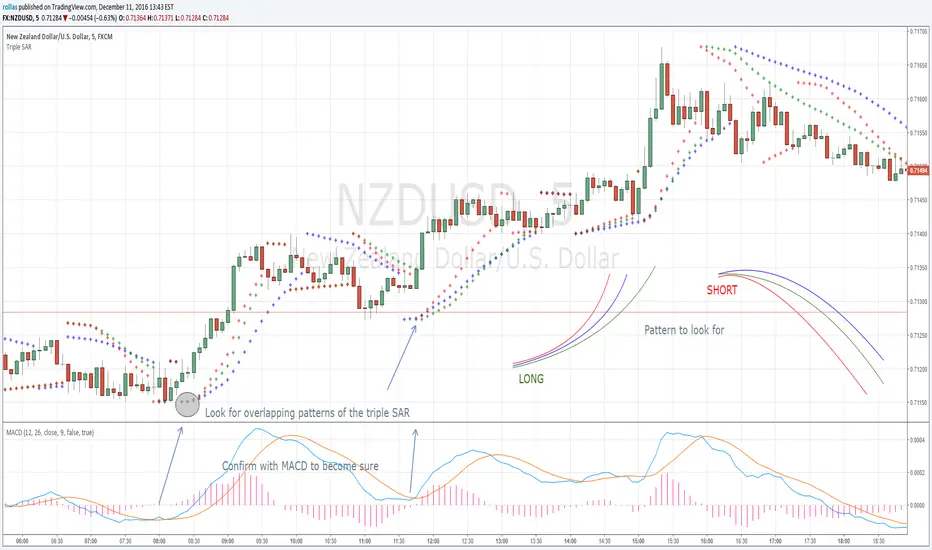
Triple SAR Scalping 5MTriple SAR scalping method must be used with a 5 minute chart. Look for the patterns that 3 bands overlap. Close deal within 4-5 pip profit or build your own style after getting comfortable with this technique and share your approach with us for maybe higher profits.