Lunar Astronomical EventsThis script plots lunar events such as blood moons, blue moons, and super moons.אינדיקטור Pine Script®מאת PkpTrout114
LunarSolverLunarSolver Library Implements analytical approximations from Éphéméride Lunaire Parisienne (ELP2000-82B) lunar theory (Chapront-Touzé & Chapront). Uses truncated Fourier series of the main problem in Delaunay arguments D, l, l', F. Exported functions: delta_t(t_ms) → ΔT (seconds); polynomial fit valid ~1950–2050. julian_day_tt(t_ms) → JD in Terrestrial Time from UTC millisecond timestamp. jde_tt_to_utc_ms(jde_tt) → Approximate UTC millisecond timestamp from JD TT. elp_true_distance_km_50(jd_tt) → Geocentric distance (km); 50 largest-amplitude terms. elp_new_moon_solver_50(k) → JDE TT of new moon nearest lunation number k (k=0 ≈ 2000-01-06); 50-term longitude series + Newton-Raphson iteration (convergence <0.005 days). elp_full_moon_solver_50(k) → JDE TT of full moon nearest k (k=0 ≈ 2000-01-21); 50-term longitude series + nutation correction + damped iteration (convergence <0.001 days). Accuracy (truncation-limited): - Distance: typically ± 10 - 100 km. - Syzygy times: typically ± few minutes. Import: import telephonejack/LunarSolver/1 as lunar Usage examples: //@version=6 indicator("Lunar Distance Demo") float jd_tt = lunar.julian_day_tt(time) float dist_km = lunar.elp_true_distance_km_50(jd_tt) plot(dist_km, "Distance (km)") // Approximate lunation k for current bar float k_approx = (lunar.julian_day_tt(time) - 2451550.25977) / 29.530588861 int k = math.round(k_approx) float new_jde = lunar.elp_new_moon_solver_50(k) float full_jde = lunar.elp_full_moon_solver_50(k) Coefficients: top 50 terms by amplitude from ELP main problem series (radius vector & longitude). Phase solvers use longitude terms only. Library contains no latitude series. Disclaimer: The library was developed with assistance from Grok 4.1, always under human supervision and decision-making. ספריית Pine Script®מאת telephonejack4
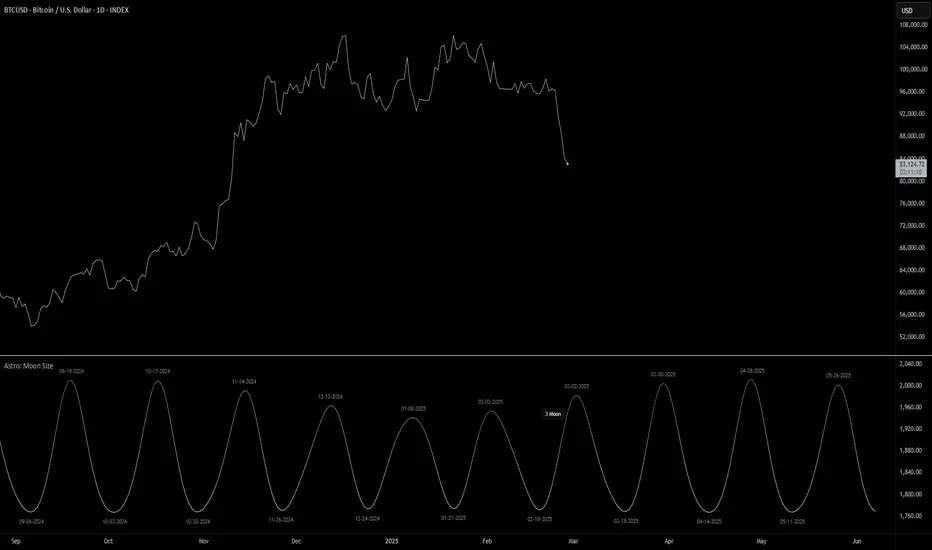
Astro: Moon SizeThe Astro: Moon Size indicator, built using AstroLib , calculates the distance and visualizes the apparent size of the Moon based on astronomical positioning. This script is tailored for the 1D timeframe and provides insights into lunar perigees (closest approach) and apogees (farthest distance), making it useful for astrologically-informed trading strategies. New Astro Indicators Feature: By setting the Julian Date to X number of days in the future, and offsetting the plot by X number of bars accordingly, it is now possible to visualize future projections of TradingView indicators that reference the AstroLib . This feature has been long requested and is far overdue, so thank you to everyone who pushed for this feature release. Enjoy, time travelers from the future!! Key Features: Moon Size Calculation: Uses Julian Date (J2000) conversion and AstroLib functions to determine the Moon's apparent distance. Future Projection: Displays the Moon's distance from 28 up to 500 days ahead, with color gradients indicating proximity/size. Pivot Identification: Marks local maxima (apogees) and minima (perigees) with labeled date stamps for easy reference. Dynamic Labeling: Adapts label positioning and size based on the Moon's current trend and relative size. Usage Notes: ⚠️ Timeframe Restriction: For now, the script only functions on the 1D timeframe and will prompt an error otherwise. ⚠️ Asset Restriction: This script is meant to be loaded on charts for assets that trade 24/7, like BTCUSD historical index.אינדיקטור Pine Script®מאת BarefootJoey55154
Lunar Cycles Projected Forward; Moon phases into futureProjecting Lunar Cycles/ half-cycles forward in time User sets the recent Full moon in history to anchor from; Indicator projects 1/2 cycles forward in time //inputs// -input number of full lunar cycles to project forward from input full moon time -choose color/opacity/border color/text displayאינדיקטור Pine Script®מאת twingallמעודכן 66638
Moon Phases + Daily, Weekly, Monthly, Quarterly & Yearly Breaks█ Moon Phases From LuxAlgo description. Trading moon phases has become quite popular among traders, believing that there exists a relationship between moon phases and market movements. This strategy is based on an estimate of moon phases with the possibility to use different methods to determine long/short positions based on moon phases. Note that we assume moon phases are perfectly periodic with a cycle of 29.530588853 days (which is not realistically the case), as such there exists a difference between the detected moon phases by the strategy and the ones you would see. This difference becomes less important when using higher timeframes. █ Daily, Weekly, Monthly, Quarterly & Yearly Breaks This indicator marks the start of the selected periods with a vertical line that help with identifying cycles. It allows to enable or disable independently the daily, weekly, monthly, quarterly and yearly session breaks. This script is based on LuxAlgo and kaushi / icostan scripts. Moon Phases Strategy Year/Quarter/Month/Week/Day breaks Month/week breaks אינדיקטור Pine Script®מאת Yatagarasu_468
Moon Phases/Apogee & Perigee/Eclipses/North Node by BTThis script helps us to display date of different lunar properties on price chart. Simply following items could be used to see dates. New moon Full moon Apogee Perigee North node I've used following web site (fourmilab.ch) for obtaining exact dates, according to web site "All dates and times are Universal time (UTC); to convert to local time add or subtract the difference between your time zone and UTC" אינדיקטור Pine Script®מאת boratuncerמעודכן 2323278
Moon Phases Strategy [LuxAlgo]Trading moon phases has become quite popular among traders, believing that there exists a relationship between moon phases and market movements. This strategy is based on an estimate of moon phases with the possibility to use different methods to determine long/short positions based on moon phases. Note that we assume moon phases are perfectly periodic with a cycle of 29.530588853 days (which is not realistically the case), as such there exists a difference between the detected moon phases by the strategy and the ones you would see. This difference becomes less important when using higher timeframes. Settings New Moon Reference Date: Date of a new moon to be used as starting point for the cycle calculation. Buy: Determine the condition to be used to open a long position Sell: Determine the condition to be used to open a short position Description The strategy can use different buy/sell conditions, these are determined in the Buy/Sell settings drop-down menu. By default, the strategy goes long on a new moon and short on a full moon. This setup is common since full moons are said to be related to depressed mood. However, it is possible to use inverse conditions. Users can also go long on higher moons (new moons or full moons occurring at a price that is higher than the previous one when a new/full moon occurred) and short on lower moons, this would return a trend following strategy, using the inverse conditions (buy lower moons/sell higher moons) would return a contrarian strategy. The above chart displays the strategy using default conditions. The above chart displays the strategy of going long on a higher moon and selling on a lower moon. Quick Summary We provide a quick summary of the strategy using default conditions (buy on a new moon, sell on a full moon) on various tickers using the 4h timeframe (note that using a lower timeframe would return a backtest executing a lower number of trades). Constant position sizing is used and no frictional costs are considered. BTCUSD The moon phases strategy has been regularly tested with BTCUSD, with traders highlighting how moon phases tend to occur during tops/bottoms. We test the strategy from 2019-01-06 00:00. Net Profit: $68544.86 Closed Trades : 67 % Profitability : 50.75 Max Drawdown : $18541.24 Max TSLA The strategy is tested from 2011-01-04 14:30 Net profit: $349.17 Closed Trades : 265 % Profitability : 54.34 Max Drawdown : $262.72 EURUSD The strategy is tested from 2018-01-16 14:00. Net profit: $-0.18 Closed Trades : 91 % Profitability : 50.55 Max Drawdown : 0.36 אסטרטגיית Pine Script®מאת LuxAlgoמעודכן 1919 6.3 K