NeuroPip OscillatorNeuroPip Oscillator – Adaptive Momentum Oscillator with Deviation “Bursts”
Indicator published by PipGuard.
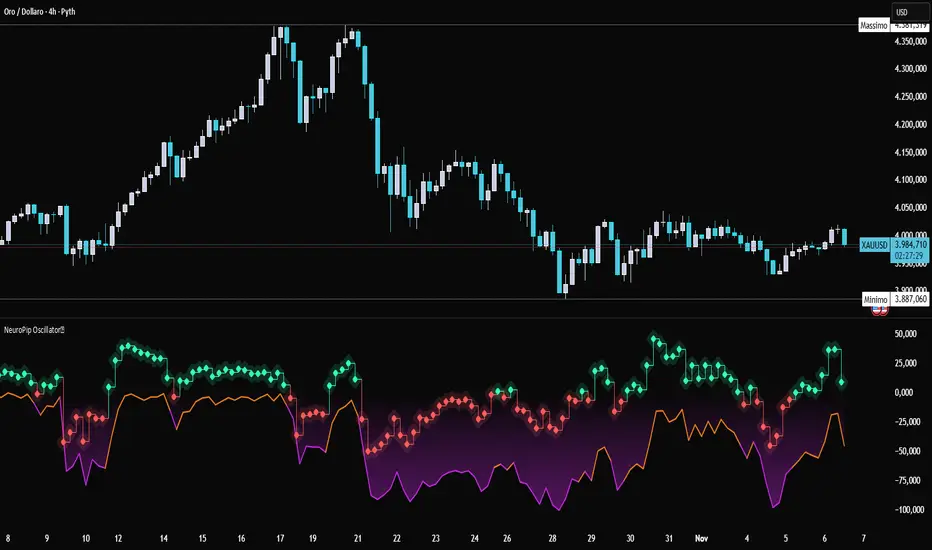
NeuroPip Oscillator is an adaptive momentum oscillator displayed in a separate panel , designed to read market momentum and regime shifts through a dynamically adjusted signal line.
The main signal ( NeuroPulse ) changes color according to the active regime, while the Synapse Burst line highlights real-time deviations and momentum acceleration phases.
How it Works
• Non-Classical Logic:
Unlike conventional 3-candle swing models, NeuroPip uses a custom adaptive mechanism that blends trend behavior , volatility , and closing dynamics over a dynamic bar range .
This allows the oscillator to filter noise and focus on true structural impulses , rather than random fluctuations, producing smoother and more reliable regime detection.
• Color Shift & Waves:
The NeuroPulse line turns orange in bullish phases and violet in bearish phases.
A Colour fill between the signal and baseline visually represents the intensity and direction of momentum in real time.
• Synapse Burst (Active Deviation):
The Synapse Burst line measures the distance between the momentum curve and its adaptive baseline, revealing acceleration "bursts" or momentum drops as they occur.
How to Use
1. Add the oscillator to your chart (separate panel).
2. Read the color of the signal to determine the current market regime (bullish/bearish).
3. Observe the wave strength to gauge momentum continuity and pressure .
4. Use Synapse Burst spikes to confirm acceleration or deceleration in price movement.
5. Combine its insights with your risk management and main chart analysis.
EXAMPLE OF USE
EXAMPLE OF USE
Settings
• All parameters are internally preconfigured for stability and visual consistency.
• Colors and waves are optimized and not user-editable.
• Works on all markets and timeframes (panel overlay=false ).
Alerts (Recommended to Enable)
Two built-in alerts trigger on bar close when the regime changes:
• Bullish Cross → signal turning bullish .
• Bearish Cross → signal turning bearish .
Each alert includes the symbol and timeframe , ensuring you never miss a regime shift even when you’re away from the screen.
Limitations
• The oscillator confirms regime changes; it does not predict them.
• In low-volatility environments, transitions may appear more frequent.
• Past performance does not guarantee future results .
Access
This script is available under invite-only access .
To request access, use the link provided in the Signature below the publication.
Note: Technical analysis tool designed to study price momentum and structure. It does not constitute financial advice or guarantee performance.
Indicator published by PipGuard.
M-oscillator
Koosha Dab's True Momentum OscillatorTrue Momentum Oscillator based on code written by SparkyFlary:
tradingview.com/u/SparkyFlary/
Different timeframe calculations added to the code.
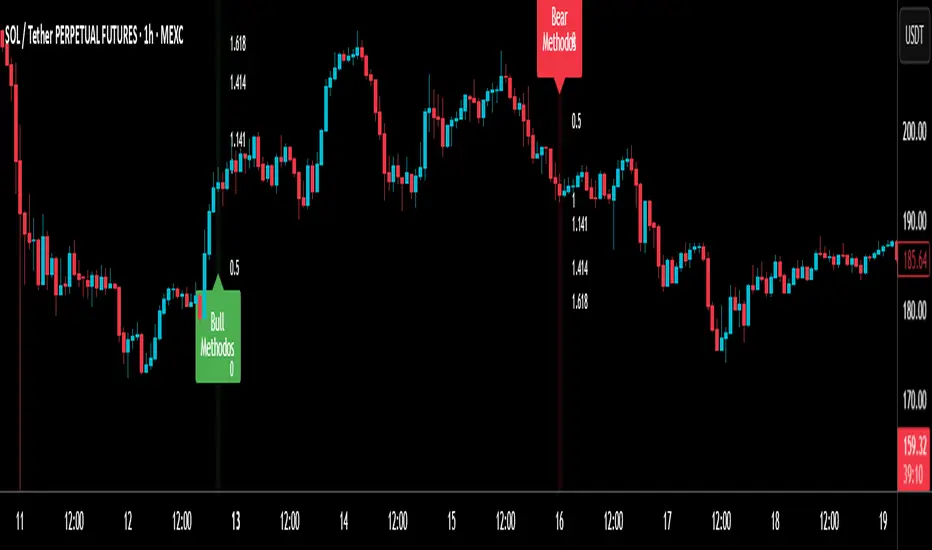
RSI MethodosThe RSI Methodos is a simple RSI-based indicator that generates rare but strong signals: Bull Methodos for bullish opportunities and Bear Methodos for bearish ones. It displays labels, background highlights, and alerts for easy use, plus optional Fibonacci labels for key levels. Ideal for swing trading in trending markets!
Directional Strength and Momentum Index█ OVERVIEW
“Directional Strength and Momentum Index” (DSMI) is a technical analysis indicator inspired by DMI, but due to different source data, it produces distinct results. DSMI combines direction measurement, trend strength, and overheat levels into a single index, enhanced with gradient fills, extreme zones, entry signals, candle coloring, and a summary table.
█ CONCEPT
The classic DMI, despite its relatively simple logic, can seem somewhat chaotic due to separate +DI and -DI lines and the need for manual interpretation of their relationships. The DSMI indicator was created to increase clarity and speed up results, consolidating key information into a single index from 0 to 100 that simultaneously:
- Indicates trend direction (bullish/bearish)
- Measures movement strength
- Identifies overheat levels
- Generates ready entry signals
DMI (ADX + +DI / -DI) measures trend direction and strength, but does so based solely on comparing price movements between candles. ADX shows whether the trend is orderly and growing (e.g., above 20–30), but does not assess how dynamic the movement is.
DSMI, on the other hand, takes into account candle size and actual market aggression, thus showing directional momentum — whether the trend has real “fuel” to sustain or accelerate, not just whether it is orderly.
The main calculation difference involves replacing True Range with candle size (high-low) and using directional EMA instead of Wilder smoothing. This allows DSMI to react faster to momentum changes, eliminating delays typical of classic DMI based on TR.
This gives the trader an immediate picture of the market situation without analyzing multiple lines.
█ FEATURES
DSMI Main Line:
- EMA(Directional Index) based on +DS and -DS
- Scale 0–100, smooth color gradient depending on strength
+DS / -DS:
- Positive and Negative Directional Strength
- Gradient fill between lines — more intense with stronger trend
Extreme Zones:
- Default 20 and 80
- Gradient fill outside zones
Trend Strength Levels:
- Weak (<10) → neutral
- Moderate (up to 35)
- Strong (up to 45)
- Overheated (up to 55)
- Extreme (>55)
All levels editable
Entry Signals:
- Activated on crossing entry level (default 20)
Or on direction change when DSMI already ≥ entry level
- Highlighted background (green/red)
Candle Coloring:
- According to current trend
Trend Strength Table:
- Top-right corner
- Shows current strength (WEAK/STRONG etc.) + DSMI value
Alerts:
- DSMI Bullish Entry
- DSMI Bearish Entry
█ HOW TO USE
Add to Chart: Paste code in Pine Editor or find in indicator library.
Settings:
DSMI Parameters:
- DSMI Period → default 20
- Show DSMI Line → on/off
Extreme Zones:
- Lower Level → default 20
- Upper Level → default 80
Trend Strength Levels:
- Weak, Moderate, Strong, Overheated → adjust to strategy
Trend Colors:
- BULLISH → default green
- BEARISH → default red
- NEUTRAL → gray
Entry Signals:
- Show Highlight → on/off
- DSMI Entry Level → default 20
Signal Interpretation:
- DSMI Line: Main strength indicator.
- Gradient between +DS and -DS: Visualizes side dominance.
- Crossing 18 with direction confirmation → entry signal.
- Extreme Zones: Potential reversal or continuation points after correction.
- Table: Quick overview of current trend condition.
█ APPLICATIONS
The indicator works well in:
- Trend-following: Enter on signal, exit on direction change or overheat. When a new trend appears, consider entering a position, preferably with a rising trend strength indicator.
- Scalping/daytrading: Shorter period (7–10), lower entry level.
- Swing/position: Longer period (20–30), higher entry level, extreme zones as filters.
- Noise filtering: Ignores consolidation below “Weak” – increasing value e.g. to 15 highlights consolidation zones, but no signals appear there.
Style Adjustment:
- Aggressive strategies → shorten period and entry level
- Conservative → extend period, raise entry level (25–30), watch “Overheated”
“Weak” level (<10 default) → neutral; increasing it e.g. to 15 gives fewer but higher-quality signals. The Weak zone value controls the level below which no signals appear, and the gradient turns gray (often aligned with consolidation zones).
Combine with:
- Support/resistance levels
- Fair Value Gaps (FVG)
- Volume (Volume Profile, VWAP)
- Other oscillators (RSI, Stochastic)
█ NOTES
- Works on all markets and timeframes.
- Adjust period and levels to instrument volatility.
- Higher entry level → fewer signals, higher quality.
- Neutral color below “Weak” – avoids trading in consolidation.
- Gradient and table enable quick assessment without line analysis.

ADX Trend Color HistogramOverview:
This script provides a visually enhanced version of the classic Average Directional Index (ADX) indicator. Instead of a simple line, it plots the ADX as a histogram, making it easier to gauge trend strength at a glance. The key feature is its dynamic color-coding, which shifts based on the relationship between the Directional Indicators (DI+ and DI-), offering immediate insight into market momentum.
Features:
Histogram Style: The ADX value is presented as a histogram for clear, easy-to-read visualization of trend strength.
Dynamic Color-Coding: The histogram bars are colored green when DI+ is greater than DI-, indicating bullish momentum. They turn red when DI- is greater than DI+, signaling bearish momentum.
Customizable Transparency: The default color transparency is set to 80% (20% opacity) for a clean look that doesn't overpower the main chart, but this can be adjusted in the script's color settings.
Built-in Alerts: The script includes configurable alerts that trigger whenever the momentum shifts, i.e., when the color of the histogram changes from red to green or vice-versa. This allows you to stay notified of potential changes in trend direction without constantly watching the chart.
Clean and Simple: The code is well-structured and commented for clarity, making it easy for other PineScripters to understand or modify.
How to Use:
Assess Trend Strength: The height of the histogram bars represents the strength of the current trend. Higher bars suggest a stronger trend (either bullish or bearish), while lower bars indicate a weak or non-trending market.
Identify Momentum Direction: The color of the bars provides a quick guide to the direction of market momentum.
Green Bars: Indicate that the upward momentum is dominant.
Red Bars: Indicate that the downward momentum is dominant.
Use Alerts for Signals: Set up alerts in TradingView based on the "ADX Green" and "ADX Red" conditions to receive notifications for potential entry or exit signals when the momentum shifts. A change from red to green can signal a potential bullish reversal or continuation, while a change from green to red can signal a bearish one.


Williams AD + MA“I’ve added an MA to the Williams Accumulation/Distribution (AD) indicator. You can use it to infer potential trend inflection points and to assess the persistence of the trend.”

Nic RSI + MACD (single pane)📊 SPACE-SAVING COMBINED INDICATOR FOR FREE USERS
This indicator combines RSI and MACD into a single pane, perfect for TradingView users with limited indicator slots. Designed to match the default TradingView styling you're familiar with.
🎯 USE AS A PACKAGE:
For optimal trading analysis, use this indicator together with "Nic SMA 9, SMA 200, 9 count" which displays moving averages and the 9 count on your main chart. Together, these two indicators give you a complete technical analysis setup while staying within the 2-3 indicator limit for free TradingView accounts.
📈 WHAT'S INCLUDED:
✅ RSI (Relative Strength Index) - Top Section:
• Default purple line matching TradingView's built-in RSI
• Reference lines at 30, 50, and 70 levels
• Background shading for overbought (>70) and oversold (<30) zones
• Takes up 55% of the pane for better visibility
• Fully customizable period (default: 14)
✅ MACD (Moving Average Convergence Divergence) - Bottom Section:
• Classic histogram with TradingView's default color scheme:
- Teal/cyan for positive momentum
- Red/pink for negative momentum
• Blue MACD line and orange Signal line
• Clear zero line for easy reference
• Takes up 45% of the pane
• Fully customizable periods (default: 12, 26, 9)
⚙️ CUSTOMIZATION OPTIONS:
• Adjust RSI length and source
• Customize RSI line color
• Adjust MACD fast, slow, and signal periods
• Customize MACD source
• Modify gap size between RSI and MACD sections
💡 WHY USE THIS?
• Saves indicator slots - combines 2 indicators into 1
• Professional appearance matching TradingView defaults
• Clean, uncluttered display
• All the functionality of separate RSI and MACD indicators
• Perfect for traders on free or limited plans
📋 RECOMMENDED SETUP:
1. Add "Nic SMA 9, SMA 200, 9 count" to your main chart (published separately)
2. Add this "Nic RSI top + MACD bottom" indicator
3. Optionally add Volume indicator if you have a slot available
This gives you moving averages, the 9 count, RSI, and MACD - everything you need for comprehensive technical analysis!
🔔 WORKS WITH FREE ACCOUNTS:
Both indicators in the Nic package are designed to maximize your analysis capabilities within TradingView's indicator limits.
#RSI #MACD #TechnicalAnalysis #FreeIndicators #SpaceSaving #CombinedIndicator

MCL RSI Conflux v2.5 — Multi-Timeframe Momentum & Z-Score Full Description
Overview
The MCL RSI Conflux v2.5 is a multi-timeframe momentum model that integrates daily, weekly, and monthly RSI values into a unified composite. It extends the classical RSI framework with adaptive overbought/oversold thresholds and statistical normalization (Z-score confluence).
This combination allows traders to visualize cross-timeframe alignment, identify synchronized momentum shifts, and detect exhaustion zones with higher statistical confidence.
Methodology
The script extracts RSI data from three major time horizons:
Daily RSI (short-term momentum)
Weekly RSI (intermediate trend)
Monthly RSI (macro bias)
Each RSI is optionally smoothed, weighted, and aggregated into a Composite RSI.
A Z-score transformation then measures how far each RSI deviates from its historical mean, revealing when momentum strength is statistically extreme or aligned across timeframes.
Key Features
Multi-Timeframe RSI Engine – Computes RSI across D/W/M intervals with individual weighting controls.
Adaptive Overbought/Oversold Bands – Automatically adjusts OB/OS thresholds based on rolling volatility (standard deviation of daily RSI).
Composite RSI Score – Weighted consensus RSI that represents total market momentum.
Z-Score Confluence Analysis – Identifies when all three timeframes are statistically synchronized.
Z-Composite Histogram – Displays aggregated Z-score strength around the midline (50).
Divergence Detection – Flags confirmed pivot-based bull and bear divergences on the daily RSI.
Dynamic Gradient Background – Shifts from red to green based on composite momentum regime.
Customizable Control Panel – Displays RSI values, Z-scores, state, and adaptive bands for each timeframe.
Integrated Alerts – For crossovers, risk-on/off thresholds, alignment, and Z-confluence events.
Interpretation
All RSI values above 50: multi-timeframe bullish alignment.
All RSI values below 50: multi-timeframe bearish alignment.
Composite RSI > 60: risk-on environment; momentum expansion.
Composite RSI < 45: risk-off environment; momentum contraction.
Adaptive OB/OS hits: potential exhaustion or mean reversion setup.
Green Z-ribbon: all Z-scores positive and aligned (statistical confirmation).
Red Z-ribbon: all Z-scores negative and aligned (broad market weakness).
Divergences: short-term warning signals against the prevailing momentum bias.
Practical Application
Use the Composite RSI as a global momentum gauge for position bias.
Trade only in the direction of higher-timeframe alignment (avoid countertrend RSI).
Combine Z-ribbon confirmation with Composite RSI crosses to filter noise.
Use divergence labels and adaptive thresholds for risk reduction or exit timing.
Ideal for swing traders and macro momentum models seeking trend synchronization filters.
Recommended Settings
Market Mode k-Band Lookback Use Case
Stocks / ETFs Adaptive 0.85 200 Medium-term rotation filter
Crypto Adaptive 1.00 150 Volatility-responsive swing filter
Commodities Fixed 70/30 100 Mean reversion model
Alerts Included
Daily RSI crossed above/below Weekly RSI
Composite RSI > Risk-On threshold
Composite RSI < Risk-Off threshold
All RSI aligned above/below 50
Z-Score Conformity (All positive or all negative)
Overbought/Oversold triggers
Author’s Note
This indicator was designed for research and systematic confluence analysis within Mongoose Capital Labs.
It is not financial advice and should be used in combination with independent risk assessment, volume confirmation, and higher-timeframe context.

Ultimate MACD Suite [BigBeluga]🔵 OVERVIEW
The Ultimate MACD Suite is an advanced momentum-based system that enhances the classic MACD with modern features tailored for professional traders.
It transforms MACD into a full market-decision engine — offering multi-timeframe confluence, adaptive histogram behavior, divergence detection, heatmap trend visualization, and actionable reversal signals.
This toolkit goes far beyond standard MACD, helping traders identify trend momentum shifts, exhaustion zones, high-probability reversal areas, and breakout confirmation signals across multiple timeframes simultaneously. It's to be used as part of a major trading system and to simplify usage of the MACD.
⚠️ Note:
This is not a traditional MACD — it uses normalized values , enhanced visual feedback, and a multi-timeframe dashboard engine for superior signal quality and clarity.
🔵 CONCEPTS
Combines MACD momentum, signal-line crossovers, and histogram reversals into one system
Uses normalized scaling to detect extreme momentum levels and exhaustion zones
Multi-timeframe dashboard displays consensus signal alignment across several timeframes
Divergence engine identifies bullish & bearish trend weakening early
Heatmap mode visually distinguishes strong trend phases from neutral or fading momentum
Reversal arrows & crosses highlight actionable turning points on chart
🔵 FEATURES
Normalized MACD Engine — improves signal clarity across all assets/timeframes
MACD Heatmap Mode — color-coded slope intensity for trend strength monitoring
MACD Rising and Falling Mode — color-coded rising and falling MACD regimes
Histogram Reversal Detection — early momentum fade signal before price turns
Signal-Line Momentum Shifts — bullish ▲ & bearish ▼ alerts on cross-confirmation
Overbought/Oversold Bands — enhanced visual thresholds at ±80 levels
Smart Divergence Detection (Non-Lag) — confirms regular bullish & bearish divergences
Multi-Timeframe Dashboard — MACD, signal, histogram & divergence signals across 5+ TFs
Reversal Push-Filter — ensures only clean signals after confirmed momentum inflection
On-Chart Reversal Labels — optional compact signal markers for clean visual execution
Histogram Color Logic — rising/falling or heatmap mode for deeper momentum reading
🔵 HOW TO USE
Look for MACD crossing above signal + green histogram to confirm bullish momentum
Use ▼ and ▲ arrows to catch confirmed momentum reversals
Monitor the dashboard — the more timeframes align, the stronger the setup
Watch divergences for trend exhaustion or reversal setups
Treat histogram trend shifts as early momentum clues before price reacts
Use ±80 levels to identify overheated conditions & fade opportunities
Combine with structure, volume, or BigBeluga liquidity tools for higher accuracy
🔵 ALERTS
The indicator includes a full alert suite for automation and real-time trade readiness:
MACD crossovers (Bullish / Bearish)
Histogram reversals & zero-line shifts
Bullish / Bearish divergence detection
Overbought / Oversold MACD alerts
Bullish ▲ and bearish ▼ reversal triggers
Use these alerts to automate signal monitoring or feed algorithmic systems.
🔵 CONCLUSION
The Ultimate MACD Suite transforms a classic indicator into a powerful trading engine.
With multi-timeframe alignment, heatmapping, divergence logic, normalized scaling and automated signals, it becomes an elite momentum-confirmation and reversal-timing system built for serious traders.
Whether scalping intraday or managing swing positions, this MACD engine helps identify the most profitable phases of trend movement — while warning early when a trend is weakening.
סקריפט בתשלום

Local Hurst Slope [Dynamic Regime]1. HOW THE INDICATOR WORKS (Math → Market Edge)Step
Math
Market Intuition
1. Log-Returns
r_t = log(P_t / P_{t-1})
Removes scale, makes series stationary
2. R/S per τ
R = max(cum_dev) - min(cum_dev)
S = stdev(segment)
Measures memory strength over window τ
3. H(τ) = log(R/S) / log(τ)
Di Matteo (2007)
H > 0.5 → Trend memory
H < 0.5 → Mean-reversion
4. Slope = dH/d(log τ)
Linear regression of H vs log(τ)
Slope > 0.12 → Trend accelerating
Slope < -0.08 → Reversion emerging
LEADING EDGE: The slope changes 3–20 bars BEFORE price confirms
→ You enter before the crowd, exit before the trap
Slope > +0.12 + Strong Trend = Bullish = Long
Slope +0.05 to +0.12 = Weak Trend = Cautious = Hold/Trail
Slope -0.05 to +0.05 = Random = No Edge
Slope-0.08 to -0.05 = Weak Reversion = Bearish setup = Prepare Short
Slope < -0.08 = Strong Reversion = Bearish= Short
PRO TIPS
Only trade in direction of 200-day SMA
Filters false signals
Avoid trading 3 days before/after earnings
Volatility kills edge
Use on ETFs (SPY, QQQ)
Cleaner than single stocks
Combine with RSI(14)
RSI < 30 + Hurst short = nuclear reversal

Crypto Breadth Engine [alex975]
A normalized crypto market breadth indicator with a customizable 40 coin input panel — revealing whether rallies are broad and healthy across major coins and altcoins or led by only a few.
📊 Overview
The Crypto Breadth Engine measures the real participation strength of the crypto market by analyzing the direction of the 40 largest cryptocurrencies by market capitalization.
⚙️ How It Works
Unlike standard breadth tools that only count assets above a moving average, this indicator measures actual price direction:
+1 if a coin closes higher, –1 if lower, 0 if unchanged.
The total forms a Breadth Line, statistically normalized using standard deviation to maintain consistent readings across timeframes and volatility conditions.
🧩 Dynamic Input Mask
All 40 cryptocurrencies are fully editable via the input panel, allowing users to easily replace or customize the basket (Top 40, Layer-1s, DeFi, Meme Coins, AI Tokens, etc.) without touching the code.
This flexibility keeps the indicator aligned with the evolving crypto market.
🧭 Trend Bias
The indicator classifies market structure as Bullish, Neutral, or Bearish, based on how the Breadth Line aligns with its moving averages (10, 20, 50).
💡 Dashboard
A compact on-chart table displays in real time:
• Positive and negative coins
• Participation percentage
• Current trend bias
🔍 Interpretation
• Rising breadth → broad, healthy market expansion
• Falling breadth → narrowing participation and structural weakness
Ideal for TOTAL, TOTAL3, or custom crypto baskets on 1D,1W.
Developed by alex975 – Version 1.0 (2025).
-------------------------------------------------------------------------------------
🇮🇹 Versione Italiana
📊 Panoramica
Il Crypto Breadth Engine misura la partecipazione reale del mercato crypto, analizzando la direzione delle 40 principali criptovalute per capitalizzazione.
Non si limita a contare quante coin sono sopra una media mobile, ma calcola la variazione effettiva del prezzo:
+1 se sale, –1 se scende, 0 se invariato.
La somma genera una Breadth Line normalizzata statisticamente, garantendo letture coerenti su diversi timeframe e fasi di volatilità.
🧩 Mascherina dinamica
L’indicatore include una mascherina d’input interattiva che consente di modificare o sostituire liberamente i 40 ticker analizzati (Top 40, Layer-1, DeFi, Meme Coin, ecc.) senza intervenire nel codice.
Questo lo rende sempre aggiornato e adattabile all’evoluzione del mercato crypto.
⚙️ Funzionamento e Trend Bias
Classifica automaticamente il mercato come Bullish, Neutral o Bearish in base alla relazione tra la breadth e le medie mobili (10, 20, 50 periodi).
💡 Dashboard
Una tabella compatta mostra in tempo reale:
• Numero di coin positive e negative
• Percentuale di partecipazione
• Stato attuale del trend
🔍 Interpretazione
• Breadth in crescita → mercato ampio e trend sano
• Breadth in calo → partecipazione ridotta e concentrazione su pochi asset
Ideale per analizzare TOTAL, TOTAL3 o panieri personalizzati di crypto.
Funziona su timeframe 1D, 4H, 1W.
Sviluppato da alex975 – Versione 1.0 (2025).

VIX OscillatorVIX Oscillator for catching vol signals on the same chart as your index of choice.
- Configurable levels that alert you when certain thresholds are broken
- Shaded background that make it simple to tell when you are in low vol/high vol regimes
- Moving line tracking price so that you can easily see bull/bear divergences against SPX building

TICK OscillatorOscillator that makes it easy to see when TICK is hitting extreme readings or establishing a bullish/bearish divergence vs the indices.
- Green coloration means a reading of >+400
- Red coloration means a reading of <-400
- Orange means a reading in between -400 and +400
This was inspired by John F Carter's book "Mastering The Trade", where I first learned about utilizing TICK in my trading.

Momentum Pro [FluxQuant]Momentum Pro — Adaptive Momentum & Regime Filter
Overview
Momentum Pro is a next-generation oscillator that combines rate-of-change (ROC), relative-strength (RSI), and stochastic-momentum frameworks into a unified adaptive model. It dynamically filters momentum through volatility, directional-movement, and trend-strength conditions to highlight only qualified signals in changing market regimes.
🔹 Key Features
Selectable Core Algorithm: Choose between ROC, RSI, or Stochastic momentum engines
Adaptive Signal System: Cross-based entries gated by volatility and trend filters
Quality Filters: Volatility, momentum intensity, and directional bias validation
Overbought / Oversold Zones: Automatic detection with background visualization
Multi-Timeframe Sync: Confirm intraday signals with higher-timeframe momentum
Divergence Scanner: Pivot-based detection of regular bullish / bearish divergences
Smart Dashboard: Real-time summary of market state, momentum strength, and filter status
Dynamic Visual Themes: Gradient, Premium, and Glassmorphism histogram modes
🧠 How It Works
Momentum Pro calculates normalized momentum using your selected algorithm and applies layered filters to ensure that only statistically significant moves are emphasized.
The volatility filter measures current vs. average ATR to confirm expansion.
The trend filter assesses DI +/ DI – differentials for directional bias.
The momentum gate suppresses signals during consolidation or low-range conditions.
Optional higher-timeframe data aligns local momentum with broader bias for cleaner entries.
When these filters agree, momentum crossovers or divergences are visually highlighted as potential study points — not trade instructions.
📈 Interpreting the Dashboard
Field Meaning
Market State Identifies current regime (Bullish, Bearish, Overbought, Oversold, Ranging)
Momentum Current oscillator value (0–100 normalized scale)
Change Recent acceleration / deceleration in momentum
Filter Whether volatility and trend criteria are satisfied
Signal Active cross or directional alignment
Trend / Vol / Intensity Strength metrics (Elite mode)
HTF Sync Confirms alignment with higher-timeframe momentum bias
Use the dashboard as a contextual overlay — not as a mechanical signal generator.
🧩 Configuration Guide
Algorithm: Select ROC for reactive speed, RSI for balanced smoothness, or Stochastic for cyclical range focus.
Signal Line: Enable to visualize crossovers. “Glow” style enhances contrast for clarity.
Filters: Keep “Enable Filter” active to limit noise. Adjust Volatility & Trend thresholds for sensitivity.
Zones: Use background fills to mark overbought / oversold regions and regime shifts.
Divergence: Turn on for automatic pivot-based divergence marking.
Multi-Timeframe: Enable HTF confirmation to study alignment with larger trend context.
Dashboard: Choose Minimal → Elite modes depending on information density preference.
🧭 Best Practices
Works on all markets — equities, futures, crypto, FX
Ideal for 15 m – 4 h – Daily timeframes
Pairs well with structure or liquidity analysis for confirmation
Use filters to isolate expansion phases; avoid trading during neutral states
⚠️ Disclaimer
Momentum Pro is an educational and analytical tool intended for research and visualization only.
It does not provide financial advice, trade signals, or guaranteed outcomes.
Always conduct independent analysis and risk assessment before making trading decisions.
🛠 Release Notes
v 1.0 — Initial Public Release
Multi-algorithm momentum core (ROC / RSI / Stochastic)
Volatility + trend quality filter system
Multi-timeframe synchronization and ribbon overlay
Divergence scanner and contextual dashboard
Dynamic visualization modes

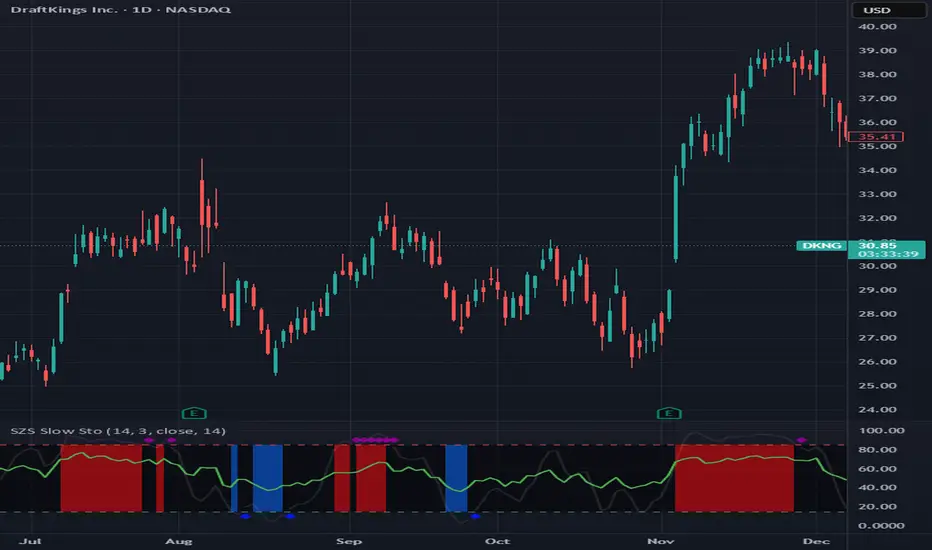
SZS Slow StochasticThe SZS Slow Stochastic is a custom momentum indicator that blends the classic Slow Stochastic Oscillator with a dynamic RSI overlay and enhanced visual cues for overbought and oversold conditions.
This indicator helps identify potential trend reversals, momentum shifts, and exhaustion points in price movements.
Features
Slow Stochastic Calculation
Uses customizable %K and %D periods to measure momentum and potential turning points in price action.
%K Range: default 14
%D Period: default 3
Visual Extremes Highlighting
The plot line dynamically changes color to indicate:
🔴 Overbought Zone (%K ≥ 85)
🔵 Oversold Zone (%K ≤ 15)
⚪ Neutral Zone (between 15 and 85)
Diamond markers appear when %K exits the overbought/oversold regions to visually flag possible reversals.
RSI Momentum Overlay
The RSI (Relative Strength Index) is plotted alongside, colored based on recent momentum extremes:
🟢 RSI has touched above 75 within recent bars → bullish momentum bias
🔴 RSI has touched below 25 within recent bars → bearish momentum bias
Shaded Signal Zones
The area between the 85 and 15 levels is shaded according to current stochastic conditions:
Red shading → overbought pressure
Blue shading → oversold pressure
Alerts Ready
Upper and lower band crossing conditions are included for easy alert configuration.
Usage Tips
Look for color changes and diamond markers as potential early warnings of momentum reversals.
When both Stochastic and RSI show aligned signals (e.g. both indicating overbought or oversold), it strengthens the reversal or continuation signal.
Combine with price structure or volume indicators for higher confidence setups.
Stochastic x11change the multi TF SETTINGS
CHANGE THE COLOR
This indicator is for multiTF anlysis and the indicator by itself in only one setting identifies the reversal point at a time. much so can do with ibndicators that can identify multpile tf settings this can help a lot

[S]Hurst Cycle Channel Clone Oscillator [LazyBear] — v6 CleanHurst Cycle Channel Clone Oscillator — v6 Clean
Overview
This is a modernized and refactored version of LazyBear's popular Hurst Cycle Channel Clone Oscillator, updated to Pine Script v6 with improved readability, proper input grouping, and enhanced code structure. This indicator helps traders identify cyclical price movements and potential reversal points based on J.M. Hurst's cycle analysis principles.
What It Does
The indicator creates two normalized oscillators that measure price position relative to dynamic channel envelopes:
Fast Oscillator (Red): Tracks short-term cycle movements based on current price position
Slow Oscillator (Green): Tracks medium-term cycle momentum based on the short cycle's midpoint
Both oscillators are normalized between 0.0 and 1.0, making overbought/oversold conditions easy to identify:
Above 1.0 = Overbought territory (purple histograms)
0.5 = Neutral midpoint
Below 0.0 = Oversold territory (purple histograms)
Key Features
✓ Dual-Timeframe Cycle Analysis: Combines short and medium cycle lengths for comprehensive market rhythm detection
✓ ATR-Based Dynamic Channels: Automatically adjusts to market volatility
✓ Clear Visual Signals: Histogram bars highlight extreme overbought/oversold conditions
✓ Customizable Parameters: Adjust cycle lengths and multipliers to match your trading style
✓ Built-in Alert Conditions: Get notified on key crossover events
✓ Optional Bar Coloring: Visual price bar colors based on oscillator position
How to Use
Basic Interpretation:
Fast crosses below 0.0 → Potential BUY opportunity (oversold)
Fast crosses above 1.0 → Potential SELL opportunity (overbought)
Fast crosses Slow → Momentum shift indication
Purple histograms → Extreme conditions requiring attention
Best Practices:
Use in conjunction with price action and trend analysis
Look for divergences between price and oscillator
Pay attention when both oscillators reach extremes simultaneously
Adjust cycle lengths to match the asset's dominant cycle period
Settings
Cycle Lengths:
Short Cycle Length (default: 10) — Fast oscillator sensitivity
Medium Cycle Length (default: 30) — Slow oscillator smoothing
Multipliers:
Short Cycle Multiplier (default: 1.0) — Controls short channel width
Medium Cycle Multiplier (default: 1.8) — Controls medium channel width
Alerts:
Pre-configured alert conditions for all major crossover events
Credits
Original indicator by LazyBear
This is a clean refactor maintaining the original logic while improving code quality and Pine Script version compliance.

Multi-Timeframe RSI TableIt can print RSI values of any four chosen periods in a tabular format on the chart itself. The table can be placed in any of the six positions, as required. If the RSI values are more than 40 or less than 40, these values are shown in bright Red, else it is light Red.

Rate Of Change📊 הסבר על האינדיקטור | Indicator Explanation
עברית:
1️⃣ VWAP של שינוי המחיר: מחשב ממוצע משוקלל לפי נפח (VWAP) של ההפרש בין מחיר הסגירה הנוכחי למחיר לפני כחודש – מאפשר להבין אם המחיר נע מעל או מתחת לממוצע האחרון.
2️⃣ קצב שינוי (ROC) ממוצע: מודד את אחוז השינוי במחיר לאורך 8 נרות, ואז מחשב עליו VWAP כדי להחליק תנודות חדות.
🟢 הקו הכתום מייצג את ה-VWAP של קצב השינוי, והקו השני את ערכי ה-ROC עצמם.
ב"ה בעתיד אצור גרסה דינמית שתאפר למשתמש לשלוט יותר בכלי הזה.
English:
1️⃣ VWAP of Price Difference: Calculates a volume-weighted average (VWAP) of the difference between the current close price and the close from Month ago — showing if the price is trending above or below its recent average.
2️⃣ Smoothed Rate of Change (ROC): Measures the 8-bar price change percentage, then smooths it with VWAP to reduce noise and highlight the trend direction.
🟢 The orange line shows the VWAP of the ROC, while the other line shows the raw ROC values.
next Version be with GUI improvements stat tuned :)

VTTOS — Volatility & Trend Transition OscillatorShort Description (one-line summary)
Displays volatility-based trend transitions using EMA relationships and adaptive percentile thresholds.
Full Description
Overview
A framework for studying volatility transitions and market phase shifts through adaptive EMA relationships.
VTTOS (Volatility & Trend Transition Oscillator System) is a technical-analysis framework that displays market behavior through volatility dynamics and EMA-based motion.
It is designed to support technical analysis and enhance market context interpretation.
VTTOS uses percentile thresholds derived from past volatility ranges to help identify transitions between trending and ranging market phases.
The indicator is built for traders who prefer to interpret market structure through volatility expansion and contraction, using clear visual markers to highlight possible sequence changes.
________________________________________
What Makes This Script Distinct
VTTOS applies adaptive percentile thresholds calculated from recent Tug Line and Tanker Line movements.
These thresholds automatically adjust based on recent data, allowing the plotted tags to represent potential market phases dynamically.
The focus is not on the EMA lines themselves, but on how price interacts relative to the percentile thresholds.
This integrated approach provides a structured volatility-based framework for contextual analysis.
________________________________________
Core Components
• Tug Line – Represents relative volatility derived from smoothed EMA relationships.
• Tanker Line – A slower baseline signal reflecting broader directional pressure.
• Threshold Bands – Adaptive percentile levels computed from recent pivot ranges.
• Sequence Markers – Numbered, colored labels that display phase progressions within the current trend.
• Multi-Market Compatibility – Can be applied to any asset or timeframe.
________________________________________
How to Read It
• When the Tug Line crosses above or below the percentile thresholds, the oscillator enters a new phase.
• Colored sequence labels display ongoing trend transitions (e.g., blue → orange → green for uptrends, purple → orange → green for downtrends).
• Opposite-side conditions automatically reset sequences to maintain clarity during volatile periods.
________________________________________
Usage Notes
• VTTOS does not generate trade entries, exit signals, or financial recommendations.
• Red or green labels only display possible late-phase conditions within a trend.
• X labels indicate when the oscillator crosses the zero line, visually marking a potential phase transition.
• All visuals are intended for analytical and educational purposes only.
• Users are encouraged to integrate VTTOS within their own analytical or confirmation framework.
• Numerical labels are iterative and do not carry standalone predictive meaning.
• The distance between the Tanker Line and percentile bands can help display relative trend strength visually, but it should not be interpreted as a forecast or signal.
________________________________________
Access
This is an invite-only script.
Access is restricted to users who have been granted permission by the author.
To request access, please use the standard “Request access” button on the indicator’s TradingView page.
Approved users will find the indicator under Invite-only scripts in the TradingView Indicators panel.
________________________________________
Disclaimer
VTTOS is provided strictly for informational and educational purposes.
It does not constitute financial advice, investment guidance, or performance assurance.
All users should conduct independent analysis and manage their own risk responsibly.

CVD Divergence ISAK EditedCVD Divergence with Price Lines
This indicator automatically detects **divergences between Price and CVD (Cumulative Volume Delta)** directly on the chart.
It supports multiple CVD periods (5, 7, 14, 21, 28) and visually displays divergence lines on price action.
**Features:**
* Detects 🟢 *Bullish* and 🔴 *Bearish* divergences
* Supports *Periodic* and *EMA* calculation modes
* Volume filter for stronger divergence signals
* Price labels and divergence lines for clarity
* Built-in alerts for new divergence detections
Ideal for **scalping and intraday trading** (1m–1h timeframes).
