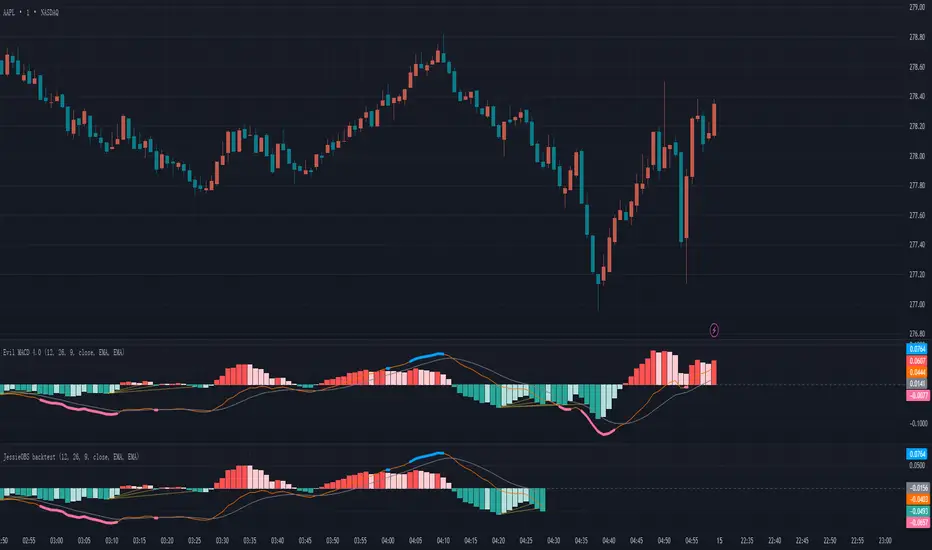
JessieOBS The Evil MACD for back testingJessieOBS – Reversal Early Warning Tool (Backtest Version)
1. Reversal Early Warning
This indicator highlights areas with the highest probability of trend reversal using thick red and blue lines.
Blue lines indicate a potential downward reversal
Red lines indicate a potential upward reversal
Instead of marking a single point, JessieOBS focuses on identifying high-probability reversal zones.
2. Sideways Market Filtering
One major weakness of many traditional indicators is their inability to filter out sideways (range-bound) markets.
JessieOBS is designed to address this issue: during consolidation phases, red and blue warning zones appear far less frequently, helping traders avoid low-quality signals and reduce noise.
3. Left-Side Signal for Advanced Analysis
JessieOBS is a left-side indicator, meaning it provides early warnings before confirmation.
Signals are often shown as a zone rather than a precise entry point. To refine entries, users are encouraged to combine JessieOBS with their own trading systems, such as:
Divergence-based strategies
Smart Money Concepts (SMC) analysis
The Theory of Entanglement structures
Different traders use different methods, and JessieOBS works as a powerful tool to enhance the accuracy and confidence of many analytical approaches.
4. Backtesting-Focused Version
This version is specifically designed for historical analysis and backtesting.
Recent data is intentionally hidden, while historical signals remain visible, making it suitable for building, evaluating, and refining trading systems.
5. Real-Time Signals
For real-time trading signals, please refer to JessieOBS with MACD – The Evil MACD 3.0.
M-oscillator

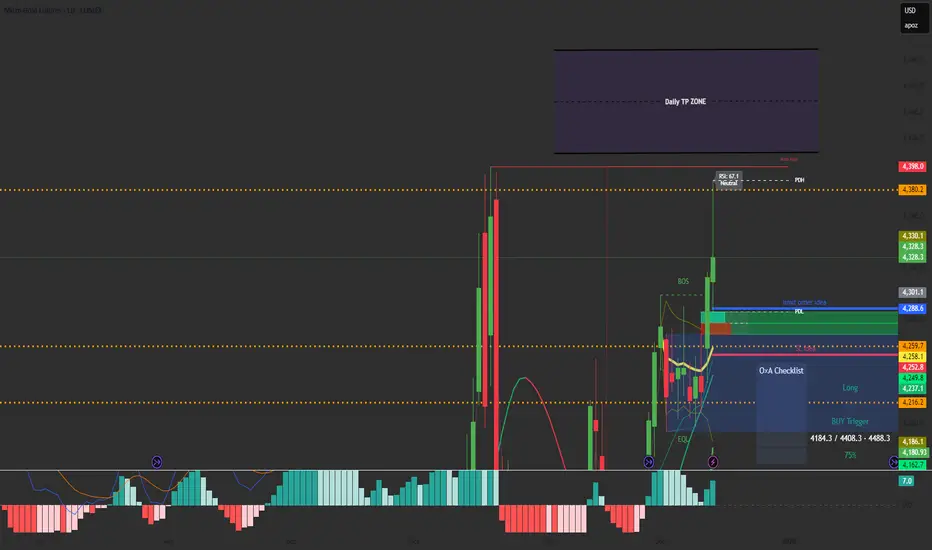
Rainbow MA Width█ OVERVIEW
Rainbow MA Width is a companion indicator for Rainbow MA Cloud. It displays ribbon width as a normalized Z-Score, allowing traders to visualize trend momentum expansion and contraction relative to recent history.
█ CONCEPTS
Z-Score Normalization:
Rather than displaying raw width values (which vary by asset and timeframe),
this indicator normalizes the ribbon width using Z-Score calculation:
Z-Score = (Current Width - Average Width) / Standard Deviation
Z-Score Interpretation:
• 0 = Average width (mean)
• +1 to +2 = Expanding (above average, strong trend)
• -1 to -2 = Contracting (below average, weakening trend)
• Beyond ±2 = Extreme (statistical outlier, potential reversal)
Width Calculation Modes:
• Outer — Distance between fastest and slowest MA: |MA1 - MA8|
• Average Gap — Mean of all adjacent MA gaps
• Total Gap — Sum of all adjacent MA gaps
█ FEATURES
1 — Width Mode Selection
Three methods to calculate ribbon width.
"Outer" recommended for aligned trends.
2 — Z-Score Period
Configurable lookback for mean and standard deviation.
Default 20 bars; increase for smoother, less reactive readings.
3 — Zone Fill Coloring
Cyan fill when expanding (Z > 0).
Orange fill when contracting (Z < 0).
Yellow fill for extreme values (|Z| > 2) as warning.
4 — Alignment Background
Green background during bullish alignment.
Red background during bearish alignment.
Synced with Rainbow MA Cloud for consistency.
5 — Reference Lines
Horizontal lines at 0 (mean), ±1σ, and ±2σ levels.
Provides clear visual boundaries for interpretation.
6 — Raw Width Display
Optional secondary line showing original width percentage.
Useful for comparing normalized vs absolute values.
█ HOW TO USE
Trend Confirmation:
• Z-Score rising above 0 confirms trend acceleration
• Z-Score staying above +1 indicates sustained strong momentum
• Use alongside alignment background for confluence
Reversal Warning:
• Z-Score exceeding +2 suggests overextension (yellow warning zone)
• Z-Score dropping below -2 indicates extreme contraction
• Extreme readings often precede trend reversals or consolidation
Entry Timing:
• Enter trends when Z-Score crosses above 0 (expansion beginning)
• Avoid entries when Z-Score is at extreme highs (potential exhaustion)
• Consider exits when Z-Score peaks and begins declining
█ LIMITATIONS
• Z-Score is relative to lookback period; different periods give different readings
• Extreme zones (±2) are statistical guides, not guarantees
• Best used in conjunction with Rainbow MA Cloud for full context
█ ALERTS
Four built-in alert conditions:
• Z-Score crosses above/below zero
• Z-Score enters extreme high/low zones (±2)

JAM ALGO Signals
"Remove the filters to view signals, then customize the parameters to your preference and enjoy using the indicator!" ✅
JAM ALGO Signals
Description:
🚀 Advanced Trading Signals with Risk Management & Alerts
This indicator is a complete all-in-one tool for traders seeking precise entries and exits with built-in risk management and real-time statistics. It combines RSI and EMA-based analysis, projected Take Profit (TP) and Stop Loss (SL) levels, customizable filters, and premium alerts directly on your TradingView chart.
✨ Key Features:
Entry Signals 🔹
Buy & Sell signals based on price action and RSI conditions.
Trend confirmation via EMA (200 and optional 50-period filters).
Visual signals: Labels, Arrows, Triangles, or Text.
Risk Management (RR) ⚖️
Define Stop Loss (SL) and multiple Take Profit levels (TP1, TP2, TP3) based on risk ratio (R).
Configurable projection bars to visualize target levels.
Colored zones for TP & SL, with optional borders for clarity.
Premium Alerts 🔔
Alerts for BUY / SELL signals, TP1 / TP2 / TP3, and SL hits.
Instant notifications when levels are reached.
Advanced Filters 🛡️
EMA50 Trend Filter: confirms short-term trend.
RSI Direction Filter: ensures momentum alignment.
Volatility Filter (ATR14 > Range): ensures enough market movement.
Candle Size Filter: avoids entries on too small candles.
SL Overlap Filter: prevents trades overlapping existing SL levels.
Real-Time Statistics 📊
Total trades, wins (TP1), and losses (SL).
Winrate (%), cumulative profit, and average RR ratio.
Optimizes strategy tracking directly on the chart.
Customizable Visuals 🎨
TP & SL line colors and styles (solid, dashed, dotted).
Fully adjustable signal labels (color, size, type).
Configurable stats table with background & text colors.
🔥 Advantages:
Complete tool for day trading and swing trading.
Clear visualization of critical risk/reward levels.
Automatic alerts for fast reaction without constant monitoring.
Integrated statistics for performance evaluation and strategy improvement.
Recommended for:
Traders using price action, intraday strategies, scalping, or swing trading, who want advanced risk management with visual signals and performance analytics on TradingView.

RRG 1 stockThis Pine Script combines Relative Rotation Graph (RRG) analysis with Supertrend-based trend confirmation to identify momentum shifts and potential trade entries in a single stock relative to a benchmark (e.g., NIFTY). Here’s a detailed description you can use:
Description – RRG + Supertrend Indicator (1 Stock)
The RRG 1 Stock indicator blends relative strength analysis with trend-following confirmation to help traders pinpoint when a stock is outperforming or underperforming its benchmark and to align entries with trend direction.
Core logic:
Benchmark-relative strength (RS-Ratio and RS-Momentum):
Calculates relative strength (RS) of the selected stock versus a benchmark (default: NIFTY).
Applies double smoothed Weighted Moving Averages (WMA) to derive normalized RS-Ratio and RS-Momentum, similar to Julius de Kempenaer’s RRG framework.
Classifies each bar into one of four RRG quadrants:
Leading – strong and improving relative performance
Weakening – losing momentum after leadership
Lagging – underperforming the benchmark
Improving – rebounding from underperformance
The chart background color dynamically reflects the current quadrant.
Supertrend filters (Trend confirmation):
Uses two Supertrend overlays with different multipliers (Factor1, Factor2) to judge trend strength.
Potential long setups occur when the stock is in the Leading quadrant and price is above both Supertrends.
Potential short setups occur when in the Lagging quadrant and price lies below both Supertrends.
Velocity and momentum signals:
Measures RRG “velocity” — the speed of movement across the RS-Ratio/RS-Momentum plane.
Flags unusually strong rotations (high velocity) with a diamond marker when momentum accelerates.
Statistical bands & entry modes:
Standard-deviation bands on RS-Ratio (±2σ by default) can be used for mean-reversion entries if you select STDDEV mode instead of QUADRANT.
Shows fast RS moving average (9-period) as a smoother for momentum confirmation.
Custom time markers:
You can define a specific date (day, month, year) to analyze RRG values at that time and display the difference in bar count since that point.
Visualization:
Plots RS-Ratio (green) and RS-Momentum (blue) with a 100 baseline.
Benchmark and stock closing prices appear in the status line.
Chart background colors shift to reflect RRG quadrant and trend direction.
Usage:
Ideal for relative strength rotation analysis or as a systematic entry trigger in momentum-based strategies. It helps confirm trend continuation or reversals based on both relative momentum and technical trend strength.

Kinetic RSI [Vel + Accel] + AlertsThe Problem with Standard RSI
Most traders use the Relative Strength Index (RSI) to see if a market is "Overbought" (above 70) or "Oversold" (below 30). The problem? A strong trend can stay overbought for days, burning short sellers, or an asset can stay oversold while price continues to crash. Standard RSI tells you where the price is, but it doesn't tell you how hard it is moving.
The Solution: Kinetic RSI
This script reimagines RSI by applying basic physics concepts: Velocity and Acceleration.
Instead of asking "Is RSI below 30?", this indicator asks: "Is RSI below 35 AND did it just make a violent, high-speed turn upwards?"
It filters out lazy, drifting price action and only signals when momentum is accelerating in a new direction.
How It Works (The Math)
Velocity: We calculate the speed of the RSI change (Current RSI - Previous RSI).
Acceleration: We calculate if that speed is increasing (Current Velocity - Previous Velocity).
The Trigger: A signal is only generated if the RSI is in an extreme zone (<35 or >65) AND it has high Velocity AND positive Acceleration.
How to Trade It
1. The "Kick" Signals (Background Highlights)
🟢 Green Background (Bullish Kick): The RSI was low, but buyers stepped in aggressively. The momentum is not just positive; it is accelerating upward. This is often a "V-Bottom" catch.
🔴 Red Background (Bearish Kick): The RSI was high, but sellers slammed the price down. Momentum is accelerating downward.
2. The Line Color
Lime Line: Velocity is positive (Momentum is rising).
Fuchsia Line: Velocity is negative (Momentum is falling).
Usage: If the background flashes Green (Buy Signal), but the line turns back to Fuchsia (Red) a few bars later, the move has failed—exit the trade.
Settings & Alerts
RSI Length: Standard 14 (Adjustable).
Velocity Threshold: Controls sensitivity.
Lower (e.g., 2-3): More signals, catches smaller reversals.
Higher (e.g., 5+): Fewer signals, catches only massive "shocks" to the price.
Alerts Included: You can set alerts for "Bullish Kick," "Bearish Kick," or "Any Kick" to get notified of volatility spikes.
Best Practices
Wait for the Close: This indicator measures the closing velocity. Always wait for the bar to close to confirm the background color signal.
Trend Filtering: This works best as a "Reversal" indicator. If the market is in a super-strong uptrend, ignore the Bearish (Red) signals and only take the Bullish (Green) dips.

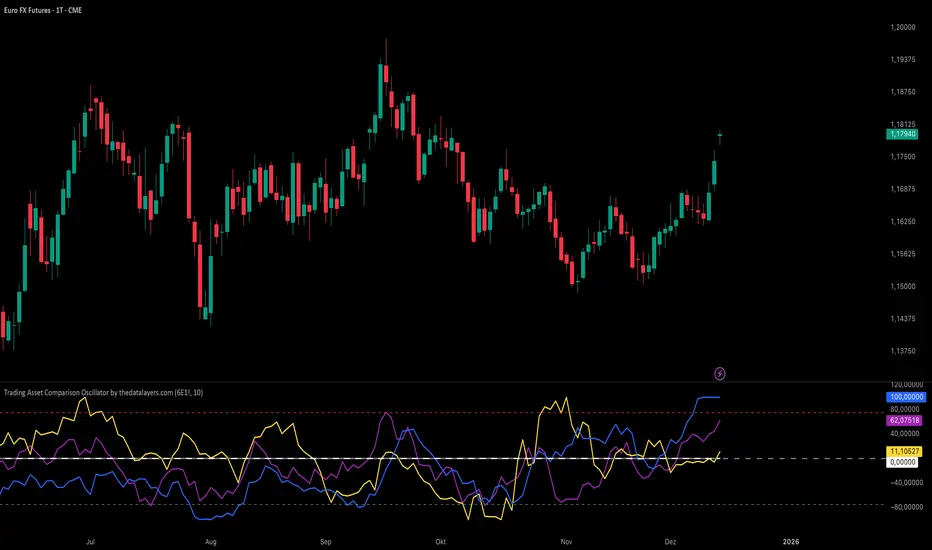
Trading Asset Comparison Oscillator by thedatalayers.comThe Trading Asset Comparison Oscillator compares the currently opened asset with a user-selected reference symbol to identify periods of relative overvaluation and undervaluation.
The concept is based on the idea that markets constantly seek fair value. When an asset becomes mispriced relative to a meaningful benchmark, it often moves back toward equilibrium.
This indicator measures that relationship and transforms it into an easy-to-read oscillator:
• Green Zone (Undervalued) - The selected asset is undervalued compared to the reference symbol.
This reflects potential upward pressure as markets tend to correct undervaluation over time.
• Red Zone (Overvalued) - The asset is overvalued relative to the reference symbol.
This may indicate a higher likelihood of downward movement as price seeks rebalancing.
Users can set any reference instrument they consider relevant-commodities, indices, currency pairs, or other assets. The oscillator quantifies the valuation difference based on a configurable cycle length.
The recommended setting is Cycle = 10, which provides a balanced and responsive signal
structure.
Since this indicator relies on broader valuation dynamics, it is designed to be used exclusively on the daily timeframe. Lower timeframes may not reflect true fundamental value relationships.
The Asset Comparison Oscillator helps traders identify when an asset appears cheap or expensive relative to another, offering an additional layer of fundamental context to support directional trading decisions.
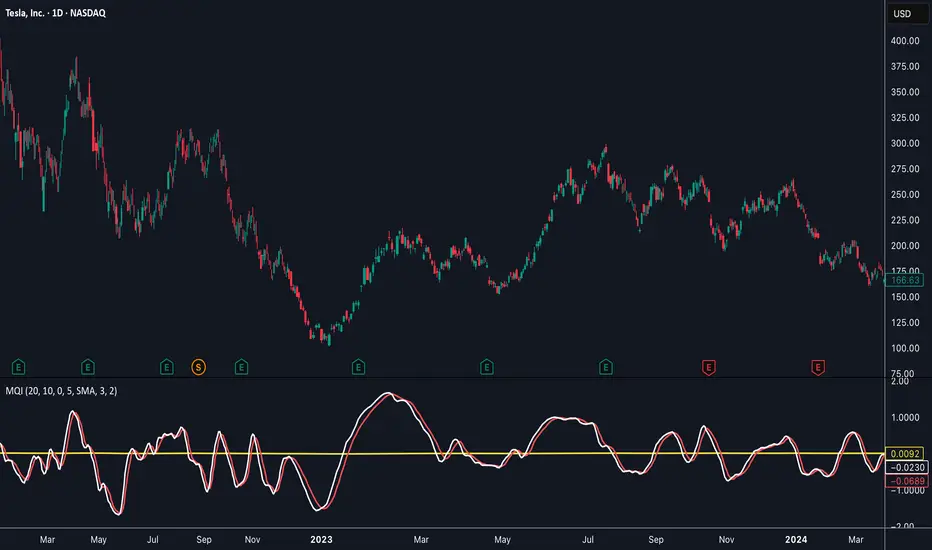
Momentum Quality Index (MQI)
Welcome to the Momentum Quality Index! This indicator aims to provide insight into short term trends by measuring the efficiency of price movement relative to the momentum of the trend. This indicator is designed to work better on short term time frames, capturing the micro-level of trends for practices such as day-trading, options trading, and shorter term swing trading.
How to read:
The main way of reading this indicator is through moving average crossovers. Upwards crossovers indicates uptrends whereas downwards crossovers indicates downtrends.
Customization:
This indicator includes a few adjustable options for fine tuning, such as optimized smoothing options and moving average length for efficiency in spotting reversals.
Breadth-Force Oscillator (BFO)Welcome to the Breadth-Force Oscillator! This is a measure of the cumulative volume index relative to price action, and is used for swing trading.
How to read:
This indicator is read primarily through divergences in price, when the BFO is going down that is indicative of an uptrend and when it is going up that is indicative of a downtrend. Changes in the BFO direction give foresight towards shifts in trends.
Features:
This indicator is highly adjustable, and depending on how you adjust it, it may change the results of how you interpret it. This indicator includes multiple smoothing options to reduce noise on smaller time frames and gain more foresight to macro-trends in a given market, and other adjustable features which can be used to further customize.

Deneme Elmas Formasyonu 2.0Elmas Formation 2.0 is a proprietary, invite-only market analysis indicator designed to identify high-quality momentum and trend alignment across multiple internal layers. Advanced parameter controls (Dia / Mond / EON) are available only in the Pro version.
Trial users see a protected visualization while the core engine remains fully active.

Black Arrow Wave Trend
Summary:
Goal was to add FIB Levels to the "WaveTrend with Crosses ". This tool is trying to identify if FIB levels in the "WaveTrend" oscillator has any relation to price action in candles.
Details:
1) Made FIB levels adjustable in the input sections under settings. Adjust to your needs.
2) Blue ribbon represents bullish waves and red ribbons represents bearish waves.
3) Purple line is at .5 "Fair Value", Two Gold lines represent "Golden Pocket", Red line represents the .786
How to use:
1) Observe either bullish or bearish waves enter FIB levels that are color coded.
2) Observe as momentum slows if following waves mark lower FIB levels.
3) Zero line is at the bottom color = grey.
4) As momentum ribbons momentum slows, this may indicate a reversal in momentum.
Probability levels:
1) Lowest: Purple line is "Fair Value" at 50% pullback. Reversal in momentum chance is weak.
2) Medium: Gold Double lines are the "Golden Pocket". Reversal in momentum chance is medium.
3) Highest: Red Line as a higher Probability for a Reversal in momentum.
Please let me know if there are any changes or items I should add.
This would be best used if combined with a support and resistance indicator.

Stochastic RSI + RSI/ADX Stochastic RSI with RSI/ADX Display
DESCRIPTION:
Advanced momentum oscillator combining Stochastic RSI with Ehlers SuperSmoother filter for reduced noise and cleaner signals. Includes real-time RSI and ADX value displays for complete market analysis.
KEY FEATURES:
- Stochastic RSI applied to logarithmic price for normalized movements
- Ehlers SuperSmoother filter reduces lag while eliminating false signals
- Second derivative (curvature) analysis filters out low-probability setups
- Real-time RSI and ADX boxes with color-coded thresholds
- Buy/Sell signals only trigger with confirmed momentum and curvature alignment
COMPONENTS:
1. K Line (Blue): Smoothed Stochastic RSI
2. D Line (Orange): Signal line (SMA of K)
3. RSI Box: Green above 50, Red below 50
4. ADX Box: Green above 25 (trending), Red below 25 (ranging)
SIGNAL LOGIC:
BUY: K crosses above D + positive curvature + below midpoint (50)
SELL: K crosses below D + negative curvature + above midpoint (50)
PARAMETERS:
- K Smoothing: 10 (Ehlers filter period)
- D Smoothing: 3 (Signal line)
- RSI

ALFA BUY IndikatorThis indicator is an improved version of the Mucip + Yağız indicator. I have been using it smoothly for the past 3 months.
I use it on futures markets for the three major coins such as BNB/USDT, BTC/USDT, and ETH/USDT.
My usage logic is as follows: on average, it generates around 2 signals per coin per day.
For each trade, I enter positions using 4–5% of my total capital.
I use 25x leverage on ETH and BNB, and 50x leverage on BTC.
My take-profit levels are 0.25% for BTC and 0.5% for the others, which results in approximately 10–12% profit per trade.
Overall, the average daily capital growth is around 2–3%.
Note: I use a trading bot for executions, because the indicator is designed for 2-minute charts, and it is almost impossible to catch the signals manually.
So far, everything has been working flawlessly, and it performs best on 2-minute timeframes.

RMO [modded LazyBear] OscillatorBoth Yellow lines mean short or PUT option.. Both BLUE lines mean LONG or Call options. Using this to watch structure, and trend bias. this is only good for entry, and Not stop Loss. Don't be on the wrong side of trend

IED [Harmonic Volatility Edition]IED-H
IED-H (Harmonic Volatility Edition) is a professional mean-reversion and exhaustion detection engine designed to identify institutional stress zones, volatility extremes, and harmonic reversals using a geometry-based statistical framework.
This indicator does not chase trends or breakouts.
Instead, it focuses on detecting when price deviates excessively from its equilibrium and begins to lose efficiency.
⸻
🔬 Core Concept
IED-H measures price deviation from a dynamic trend baseline and projects it into harmonic volatility bands derived from natural square-root ratios:
• √2 → Pulse (normal deviation)
• √3 → Stretch (institutional stress)
• √5 → Extreme (critical exhaustion)
These levels adapt dynamically to market volatility and are not fixed thresholds.
⸻
⚙️ Key Features
• Harmonic Volatility Geometry
Dynamic √2 / √3 / √5 bands scaled by statistical volatility.
• Responsive Wave Engine
Smoothed deviation wave (HMA / RMA modes) for early exhaustion detection.
• Equilibrium Noise Filter
Automatically ignores weak, low-energy oscillations around balance.
• Persistence Logic
Requires prior presence inside overbought/oversold zones to avoid false signals.
• Candle Validation
Signals are confirmed using wick structure and true volatility (ATR-based).
• Harmonic Score (Debug Mode)
Quantifies how deeply price penetrates harmonic stress levels.
• Institutional Visualization
Optional on-chart boxes highlighting validated harmonic reaction zones.
⸻
🎯 What This Indicator Is Designed For
✔ Mean-reversion trades
✔ Exhaustion & volatility climax detection
✔ Trap zones and institutional reaction areas
✔ Advanced traders who value signal quality over signal quantity
⸻
🚫 What This Indicator Is NOT
✘ Not a trend-following system
✘ Not a breakout indicator
✘ Not designed for momentum chasing
✘ Not a multi-purpose “all-in-one” tool
IED-H is a precision instrument, not a Swiss-army knife.
⸻
🧠 Best Practice
For optimal results, use IED-H within a broader trading framework, preferably alongside:
• Higher-timeframe trend context
• Market structure or session logic
• Risk-controlled execution rules
⸻
⚠️ Disclaimer
This indicator is for educational and analytical purposes only.
It does not constitute financial advice.
Always manage risk and test thoroughly before live trading.

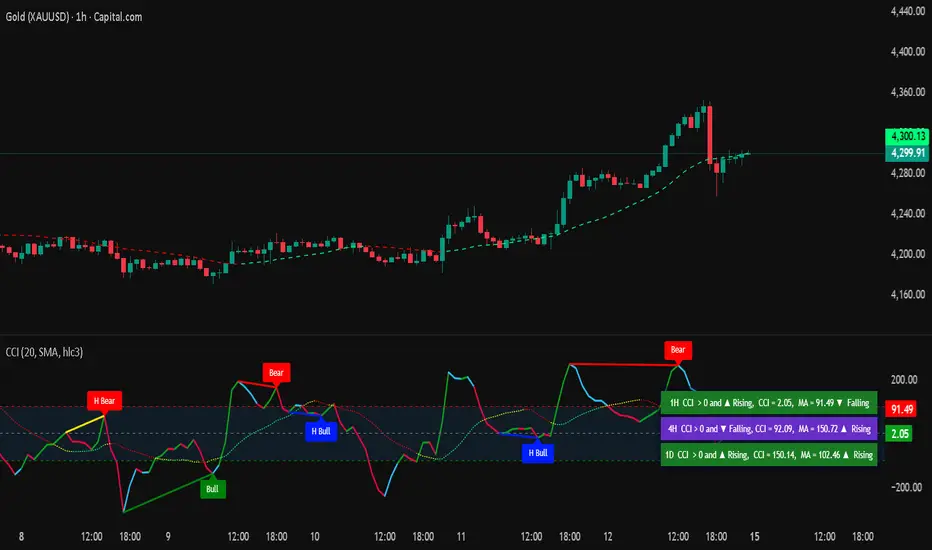
Commodity Channel IndexThe Commodity Channel Index (CCI) is a technical indicator that measures the strength of the momentum in the market, it is calculated using a Moving average (default 20 SMA, users can change the legth and the type of the MA from dashboard) using formula: cci = (src - ma) / (0.015 * ta.dev(src, ccilength)).
When CCI is under -100 that indicates a strong downtrend, and above +100 level a strong uptrend, above 0 level a bullish trend start and bellow 0 level bearish momentum.
Crossing back above -100 and bellow + 100 levels not means it is a reversal of the trend, could be just a pullback or a bounce before trend continuation.
The indicator display on the main chart a color coded moving average with the length and type selected by users for CCI calculation.
The CCI Moving average and the CCI lines in oscillator are both color coded :
1. CCI and MA both red = > Bearish trend
2. CCI and MA both green = > Bullish trend
3. MA color turn yellow or the CCI turn blue that means a possible consolidation will be next or trend change.
4 type of Divergences are detected by the script Bullish, Bearish, Hidden Bullish and Hidden bearish divergences, users can setup alarms for them, by default the divergences ae not displayed, users need to select them to be displayed on the oscillator.
A table displaying the vurrent timeframe and 2 higher timeframes of the stats of CCI and its MA.
There are 13 alerts that users can setup akarms:
Alert for Regular Bullish Divergence
Alert for Hidden Bullish Divergence
Alert for Regular Bearish Divergence
Alert for Hidden Bearish Divergence
Alert for CCI Back Above -100
Alert for CCI Back Bellow 100
Alert for CCI Extreme Overbought
Alert for CCI Extreme Oversold
Alert for trend change by CCI MA => Moving Average Color turned to yellow, that means sideways or possible trend change
Alert for CCI Crossing Above CCI MA
Alert for CCI Crossing Bellow CCI MA
Alert for cci Crossing Above 0
Alert for CCI Crossing Bellow 0
TWS- RSI+Divergence With Stochestic+Div. v21.0 By AshishThis indicator is for RSI & RSI Divergence. Also you can activate Stochastic (modified level) with divergence.
This is totally new concept. you can try it.

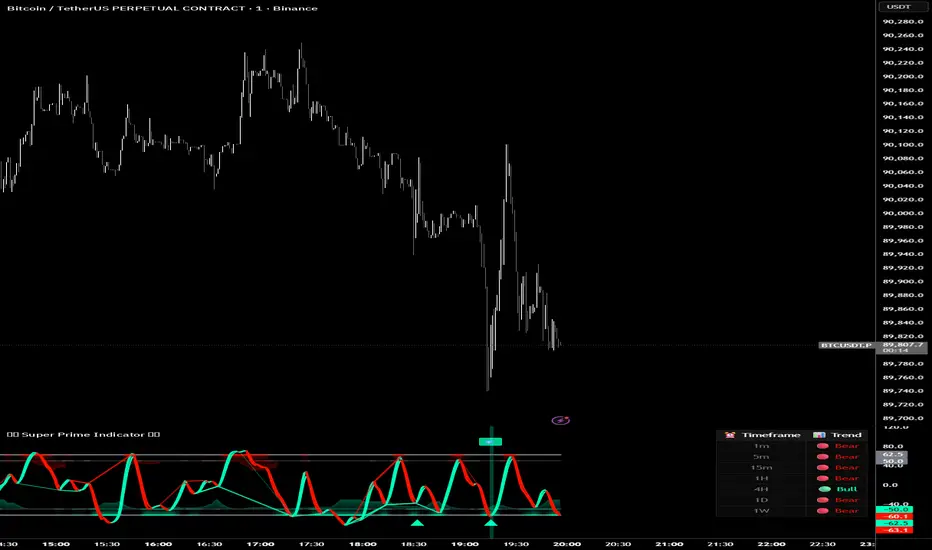
Super Prime Indicator [TraderCloud]⭐🧠 Super Prime Indicator 🧠⭐
ML-Enhanced SMI + Whale Hunter Pro
Super Prime Indicator is an advanced, all-in-one market intelligence tool that combines machine-learning-enhanced SMI, Whale Hunter Pro logic, multi-timeframe trend analysis, and probabilistic market modeling into a single, highly visual oscillator.
Designed for professional crypto traders, this indicator focuses on identifying institutional activity, high-probability reversals, and trend continuation zones with precision.
🔹 Core Components
🧠 Machine Learning SMI (KNN-Enhanced)
Traditional SMI upgraded with K-Nearest Neighbors (KNN) learning
Adaptive overbought / oversold levels based on historical behavior
Feature-based distance analysis (momentum, volatility, slope, etc.)
Optional Kalman, Double EMA, or ALMA filtering
🐋 Whale Hunter Pro System
RSI divergence detection across multiple pivot scales
KDE (Kernel Density Estimation) probability modeling
Institutional bias detection using Open Interest (OI) and CVD filters
Strict / Moderate / Aggressive signal modes
Whale buy/sell zones with visual background highlights
📊 Multi-Timeframe Trend Dashboard
Real-time trend alignment across
1m / 5m / 15m / 1H / 4H / 1D / 1W
Clear bullish / bearish status table for top-down analysis
📈 Advanced Divergence Engine
Regular & hidden divergence detection
Short, medium, and long-term pivot sets
Dynamic divergence line plotting with strength-based visuals
📐 Bayesian Probability Model
Probabilistic market direction estimation
Uses Bollinger Bands & SMA state sequences
Normalized directional probability output for risk assessment
🎯 Trading Use Cases
Identify smart money accumulation & distribution
Spot high-probability reversals before price confirmation
Confirm trend continuation with multi-TF alignment
Filter false signals using OI & CVD confirmation
Combine momentum, structure, and probability in one view
🎨 Visual & UX Features
Neon / color-blind friendly palettes
Gradient-based momentum zones
Clean oscillator design with minimal chart clutter
Whale emoji signals for instant recognition
Programmers Toolbox of ta LibraryA programmer's "Swiss army knife" for selecting functions from the " ta Library by Trading View " during coding. Illustrates the results of the individual library functions. Adds a few extra features. Extensively and uniquely documented.

VEGA (Velocity of Efficient Gain Adaptation)VEGA (Velocity of Efficient Gain Adaptation)
VEGA is a momentum oscillator that measures the velocity of an efficiency-weighted adaptive moving average. Unlike traditional momentum indicators that react uniformly to all price movements, VEGA intelligently adapts its sensitivity based on market conditions—responding quickly during trending periods and filtering noise during consolidation.
--------------------------------
What Makes VEGA Different
Efficiency-Driven Adaptation
At its core, VEGA uses the Efficiency Ratio (ER) to distinguish between trending and choppy markets. When price moves efficiently in one direction, VEGA's underlying adaptive MA speeds up to capture the move. When price chops sideways, it slows down to avoid whipsaws. This creates a momentum reading that's inherently cleaner than fixed-period alternatives.
Linear Regression Smoothed Source
VEGA offers an optional LinReg-smoothed price source that blends regular candles with linear regression values. This pre-smoothing reduces noise before it ever enters the calculation, resulting in a histogram that's easier to read without sacrificing responsiveness. The mix ratio lets you dial in exactly how much smoothing you want.
Z-Score Normalization with Dead Zone
Rather than arbitrary oscillator bounds, VEGA normalizes output as standard deviations from the mean. This gives statistically meaningful levels: readings above +2σ or below -2σ represent genuinely extreme momentum. The configurable dead zone (with Snap, Soft Fade, or None modes) filters out insignificant movements near zero, keeping you focused on signals that matter.
--------------------------------
How It Works
1. Source Preparation — Price is smoothed via a LinReg/regular candle blend
2. Efficiency Ratio — Measures directional movement vs total movement over the lookback period
3. Adaptive MA — Applies variable smoothing based on efficiency (fast during trends, slow during chop)
4. Velocity — Calculates the rate of change of the adaptive MA
5. Normalization — Converts to Z-Score (standard deviations) or ATR-normalized percentage
6. Dead Zone — Optionally filters near-zero values to reduce noise
--------------------------------
How To Read VEGA
Signal and Interpretation
Histogram above zero | Bullish momentum
Histogram below zero | Bearish momentum
Bright color | Momentum accelerating
Faded color | Momentum decelerating
Beyond ±1σ bands | Above-average momentum
Beyond ±2σ bands | Extreme momentum (potential reversal zone)
Zero line cross*| Momentum shift
--------------------------------
Key Settings
ER Length — Lookback for efficiency ratio calculation. Higher = smoother, slower adaptation.
Fast/Slow Smoothing — Controls the adaptive MA's responsiveness range. The MA blends between these based on efficiency.
LinReg Settings — Enable smoothed candles and adjust the blend ratio (0 = regular candles, 1 = full LinReg, 0.5 = 50/50 mix).
Z-Score Lookback — Period for calculating mean and standard deviation. Shorter = more reactive normalization.
Dead Zone Type — How to handle near-zero values:
Snap — Hard cutoff to zero
Soft Fade — Gradual reduction toward zero
None — No filtering
Dead Zone Threshold — Values within this Z-Score range are affected by the dead zone setting.
VEGA works on any timeframe and any market. For best results, adjust the ER Length and LinReg settings to match your trading style and the volatility characteristics of your instrument.

RSI Info WindowRSI Info Window is a minimalist overlay utility that displays the current RSI value and a simple market state label (Overbought, Oversold, or Neutral) directly on the chart. The goal is to provide quick RSI context without using a separate oscillator pane, helping keep the chart clean for price-action, SMC, and structure-based trading.
How it works
Calculates RSI using the selected RSI Length (default 14).
Compares RSI to the Overbought and Oversold thresholds (default 70/30).
Displays a small label on the most recent candle showing:
RSI value
Current state: Overbought / Oversold / Neutral
The label updates in real time as the latest candle forms.
Inputs
RSI Length – Controls RSI sensitivity (default 14)
Overbought Level – RSI threshold for overbought (default 70)
Oversold Level – RSI threshold for oversold (default 30)
How to use
Overbought: RSI above the overbought level — may indicate momentum is extended; watch for continuation vs exhaustion based on your system.
Oversold: RSI below the oversold level — may indicate downside extension; watch for reversal conditions and structure confirmation.
Neutral: RSI between thresholds — often indicates balanced conditions or consolidation.
This indicator is designed as a compact reference tool, not a complete trading system.
Notes
The overlay label is anchored to the most recent candle and refreshes on the last bar.
Intended to save screen space vs. a full RSI subpanel.
Disclaimer
This script is for educational and informational purposes only and does not constitute financial advice. Always use risk management and confirm signals with your broader trading plan.
Beast Mode PRO v4.0# Beast Mode PRO v4.0 - Advanced Multi-Regime Trading System
## Overview
Beast Mode PRO v4.0 is a sophisticated technical analysis indicator designed for active traders seeking high-probability setups across multiple timeframes. This system combines machine learning-inspired clustering algorithms with traditional technical analysis to identify market regimes and generate precision entry signals. The indicator adapts to different trading styles through intelligent preset configurations and multiple trading modes.
---
## Core Methodology
### Signal Generation Framework
The indicator employs a **multi-component voting system** that analyzes market conditions through several independent technical perspectives:
**Technical Components:**
- **RSI (Relative Strength Index)**: Momentum oscillator measuring overbought/oversold conditions
- **Fisher Transform**: Price transformation technique that normalizes price distributions for clearer turning points
- **DMI (Directional Movement Index)**: Trend strength indicator measuring directional pressure
- **Z-Score Analysis**: Statistical measure identifying price deviations from historical norms
- **Moving Average Ratio**: Price relationship to its moving average baseline
- **MFI (Money Flow Index)**: Volume-weighted momentum indicator
- **Stochastic Oscillator**: Momentum indicator comparing closing price to price range
- **CCI (Commodity Channel Index)**: Measures current price level relative to average price level
### Clustering Engine
The system utilizes a **k-means inspired clustering algorithm** that categorizes each technical indicator's normalized values into distinct market regimes (bullish, bearish, neutral). This approach:
1. **Normalizes** all indicators using z-score transformation over a historical lookback window
2. **Clusters** normalized values using percentile-based thresholds
3. **Aggregates** individual votes into a composite score ranging from -100 to +100
4. **Smooths** the composite score using selectable methods (SMA, EMA, WMA, HMA, TEMA, DEMA)
The clustering percentiles adapt dynamically based on current market volatility (ATR-normalized), ensuring the system remains responsive across different market conditions.
---
## Trading Modes
### 1. Normal Mode
Standard crossover-based signals using fixed thresholds (+10/-10). Suitable for balanced trading with moderate signal frequency.
### 2. Scalper Mode
Dynamic threshold adjustment based on recent score volatility. Generates more frequent signals by adapting to short-term price movements.
### 3. Aggressive Mode
Reversal-focused approach that triggers signals when the composite score crosses extreme levels (+80/-80), targeting major trend reversals.
### 4. Hybrid Mode
Combines Normal and Aggressive signals, capturing both standard crossovers and extreme reversals for comprehensive market coverage.
### 5. Super Scalper Mode
Ultra-responsive mode using signal line crossovers (14-period HMA of composite score) for maximum trade frequency.
### 6. Sniper Mode (Premium Feature)
Multi-confirmation system requiring alignment of:
- Composite score threshold breach
- Positive fast momentum (10-period SMI)
- Positive trend momentum (200-period SMI)
- Price above/below smart trend filter MA
This mode prioritizes precision over frequency, filtering out low-probability setups.
---
## Timeframe Presets
Pre-optimized configurations for common trading timeframes:
### 1 Minute Preset
- Fast smoothing (10-period WMA)
- Tight chop filter (61.8 threshold)
- Optimized for rapid scalping with minimal lag
### 2 Minute Preset
- Balanced smoothing (12-period EMA)
- Enhanced volume filtering
- Moderate cooling period (5 bars)
### 3 Minute Preset
- HMA smoothing for reduced lag
- Stochastic and CCI enabled
- Balanced approach for intraday trading
### 5 Minute Preset
- TEMA smoothing for trend following
- Stronger filters to reduce noise
- Extended lookback (1000 bars)
### 15 Minute Preset
- DEMA smoothing for swing positions
- Maximum filtering configuration
- All technical indicators enabled
- Suitable for swing trading and position building
Users can also select "Custom" to manually configure all parameters.
---
## Advanced Filtering System
### 1. Choppy Market Filter
Uses Choppiness Index calculation to identify consolidating markets. When CI exceeds the threshold, signals are suppressed to avoid whipsaw trades.
### 2. Smart Trend Filter
Configurable moving average (SMA/EMA/WMA/HMA/TEMA/DEMA/VWMA/RMA) that prevents counter-trend signals. Long signals require price above the MA, shorts require price below.
### 3. Volume Filter
Compares current volume to its moving average. Signals are suppressed when volume falls below the specified multiplier of average volume.
### 4. ATR Volatility Filter
Prevents trading during low volatility periods when ATR falls below its moving average multiplied by the specified factor.
### 5. Session Filter
Time-based filtering for Asia, London, New York, or combined sessions. Ensures trading only during preferred market hours.
### 6. Multi-Timeframe Confirmation
Optionally requires higher timeframe alignment before generating signals, adding confluence for higher probability trades.
### 7. Cooling Off Period
Prevents signal clustering by enforcing a minimum number of bars between consecutive signals.
---
## Smart Money Concepts Integration
### Order Block Detection
Identifies institutional supply/demand zones using multi-timeframe analysis:
- Detects strong directional candles followed by breakout moves
- Volume confirmation ensures significance
- Customizable timeframe selection (current TF or higher TF: 5m, 15m, 30m, 1H, Daily)
- Visual boxes mark active order blocks with automatic expiration after lookback period
- Price interaction alerts when touching active zones
### Liquidity Zones
Marks equal highs (EQH) and equal lows (EQL) where stop losses typically cluster, indicating potential reversal or breakout points.
---
## Momentum Analysis
### Fast Momentum (Default: 10-period)
Short-term momentum oscillator using Stochastic Momentum Index (SMI) calculation. Provides early warning of momentum shifts.
### Trend Momentum (Default: 200-period)
Long-term momentum gauge confirming overall trend direction. Used in Sniper Mode for multi-confirmation.
### Momentum Divergence Detection
Automatically identifies:
- **Regular Divergence**: Price makes new high/low but momentum doesn't (reversal signal)
- **Hidden Divergence**: Price makes higher low/lower high but momentum doesn't (continuation signal)
---
## Visual Components
### Price Chart Overlay
- **Smart Trend MA**: Dynamically colored moving average based on price position
- **EMA Cloud**: 50/200 EMA cloud showing long-term trend (background shading)
- **Trend Background**: Subtle background coloring based on composite score
- **Order Block Boxes**: Institutional supply/demand zones
- **Entry/Exit Markers**: Clear visual signals with emoji labels
- **Liquidity Markers**: EQH/EQL identification
### Bar Coloring
Bars change color based on active mode and market regime:
- **Sniper Mode**: Purple (bull) / Pink (bear)
- **Aggressive Mode**: Bright Green / Bright Red
- **Super Scalper**: Neon Green / Neon Red
- **Timeframe Presets**: Unique color schemes per preset
- **Choppy/Neutral**: Always gray regardless of mode
### Oscillator Pane
- **Composite Score Line**: Gradient-colored stepline showing current regime strength
- **Fast/Trend Momentum**: Optional overlays (gold/cyan colors)
- **Divergence Markers**: Visual alerts for regular, hidden, and momentum divergences
- **Power Zones**: Overbought/oversold regions (80/-80 levels)
- **Dynamic/Fixed Thresholds**: Visual reference lines based on active mode
### Interactive Dashboards
**Main Dashboard** displays:
- Active preset/mode configuration
- Real-time indicator values and votes
- Current market status (active/choppy/counter-trend/low volume/low ATR/MTF misalignment)
- Regime classification (Strong Long/Long/Neutral/Short/Strong Short)
- Smart Trend MA status
**Performance Dashboard** shows:
- Exit strategy (Fixed TP/SL, Trailing Stop, Opposite Signal)
- Total trades and win rate
- Total points and average per NY session
- Profit factor and recovery factor
- Best/worst trades and max drawdown
- Maximum winning/losing streaks
- Sharpe ratio and average risk:reward
**TP Optimizer** (33 variations tested):
- Tests take profit levels from 40 to 200 ticks (5-tick increments)
- Sortable by: Profit Factor, Win Rate, Total Points, Sharpe Ratio
- Displays top 5 configurations with full metrics
- Real-time optimization during backtesting
---
## Backtest Engine
### Exit Strategies
**1. Fixed TP/SL**
- Configurable in Ticks, ATR multiples, or Percentage
- Precise risk management with predefined targets
**2. Exit on Opposite Signal**
- Closes position when counter-signal appears
- Adapts to changing market conditions
- Useful for trend-following approaches
**3. Trailing Stop**
- Dynamic stop loss that follows profitable moves
- Configurable trailing offset percentage
- Locks in profits while allowing trends to develop
### Risk Management
- Optional minimum risk:reward filter
- Prevents trades below specified R:R threshold
- Date range filtering for historical analysis
- Session-based performance tracking
### Performance Metrics
- Win rate, profit factor, Sharpe ratio
- Maximum drawdown and recovery factor
- Consecutive win/loss streaks
- Average win/loss analysis
- Gross profit vs gross loss breakdown
---
## Alert System
Comprehensive alert conditions for:
- Entry signals (Long/Short)
- Exit events (TP/SL/Opposite/Trailing)
- Trend signals (Strong bullish/bearish)
- Divergences (Regular/Hidden/Momentum)
- Order block detection and touches
- Multi-condition strong signals (all confirmations aligned)
---
## How to Use
### Quick Start
1. Select your preferred timeframe preset (1m, 2m, 3m, 5m, 15m, or Custom)
2. Choose a trading mode (Normal, Scalper, Aggressive, Hybrid, Super Scalper, or Sniper)
3. Configure session filter to match your trading hours
4. Enable desired filters (choppy, trend, volume, ATR, MTF)
5. Set your exit strategy and TP/SL levels
6. Monitor signals on price chart and oscillator pane
### Optimization Workflow
1. Enable "Run TP Optimizer" in backtest settings
2. Run backtest on historical data
3. Review Optimizer Dashboard for best TP levels
4. Sort by preferred metric (Profit Factor, Win Rate, Total Points, Sharpe)
5. Apply winning configuration to live trading
### Advanced Configuration
- Customize individual indicator lengths and enable/disable specific components
- Adjust clustering parameters (lookback window, percentiles, cluster count)
- Fine-tune smoothing methods and lengths
- Configure order block detection timeframe and sensitivity
- Set cooling off period to control signal frequency
---
## Unique Features
1. **Adaptive Clustering**: Volatility-adjusted percentiles ensure consistent performance across market conditions
2. **Multi-Mode Architecture**: Six distinct trading modes from conservative to ultra-aggressive
3. **Timeframe Intelligence**: Pre-optimized presets eliminate guesswork for common timeframes
4. **Smart Money Integration**: Order block detection and liquidity zone marking
5. **Comprehensive Backtesting**: Three exit strategies with 33-variation TP optimization
6. **Visual Clarity**: Mode-specific bar coloring and clean chart presentation
7. **Filter Stack**: Seven-layer filtering system prevents low-quality signals
8. **Real-Time Metrics**: Live performance tracking with advanced statistics
---
## Benefits
- **Reduced False Signals**: Multi-confirmation clustering approach filters noise
- **Adaptability**: Works across timeframes and market conditions through preset system
- **Transparency**: Open visualization of all component votes and filtering status
- **Risk Management**: Built-in TP/SL optimization and R:R filtering
- **Time Efficiency**: Preset configurations save hours of manual optimization
- **Educational Value**: Dashboard shows exactly why signals trigger or get filtered
- **Professional Tools**: Institutional concepts (order blocks, liquidity zones) accessible to retail traders
---
## Best Practices
- Use Sniper Mode for high-probability setups during volatile markets
- Enable choppy filter during consolidation periods
- Combine Smart Trend Filter with MTF confirmation for swing trades
- Run TP Optimizer monthly to adapt to changing market dynamics
- Monitor Sharpe Ratio in addition to win rate for risk-adjusted performance
- Use session filters to avoid low-liquidity hours
- Start with preset configurations before custom optimization
---
## Technical Requirements
- TradingView Premium/Pro/Pro+ for full feature access
- Minimum chart history: 500 bars (adjustable in clustering settings)
- Works on all instruments (stocks, forex, crypto, futures)
- Compatible with standard candles (Heikin Ashi optional but not recommended for backtesting)
---
## Disclaimer
This indicator is a technical analysis tool designed to assist trading decisions. It does not guarantee profits and should be used in conjunction with proper risk management, fundamental analysis, and personal trading experience. Past performance does not indicate future results. Users should thoroughly test the indicator on demo accounts before live trading.
---
**Version**: 4.0
**Language**: Pine Script v6
**Type**: Overlay Indicator with Oscillator Pane
**Calculation**: On bar close (default) or real-time (configurable)
