M-oscillator
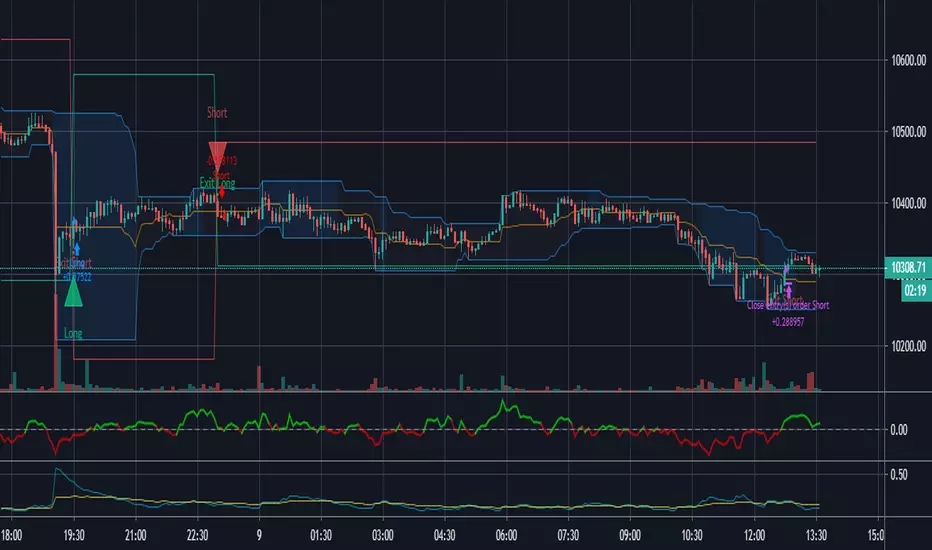

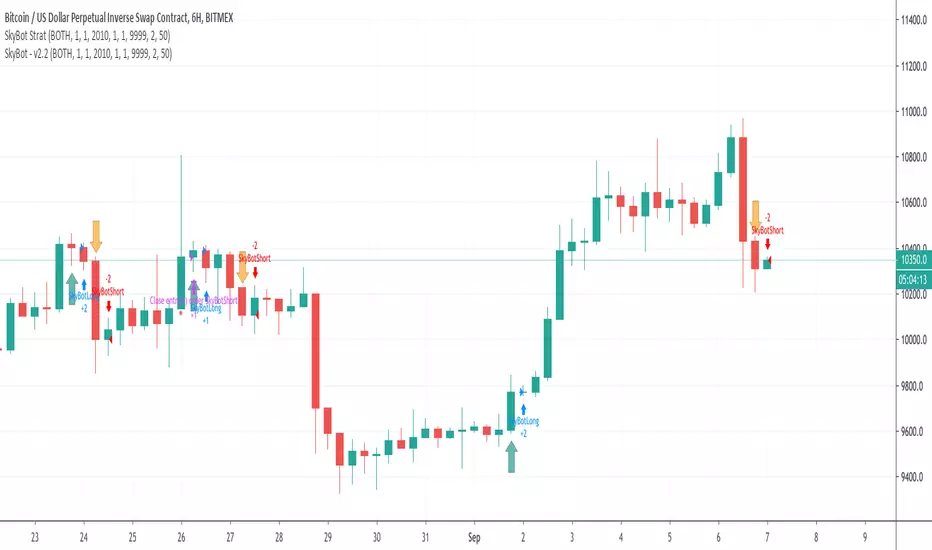
SkyBot Strategy - BTC and XBTUSD Trading Bot for CryptoThe SkyBot is written to provide a good balance between long-term trading and short-term for more action. It has been running for over a year before it was decided to share with the public.
SkyBot uses moving price action data from multiple time frames to determine when to go long or short. It also provides the user with the ability to use stop loss and take profit values to match whatever risk management rules you use in your trading.
SkyBot has simple to use alerts making it simple to use with many auto-trading offers.
SkyBot has been coded in the latest version of Pine (v4) and will be updated as new features, functionality, and support is released with Pine.
To get access to SkyBot, please signup here: cryptoscriptking.com
This is the indicator script that is intended to be used to get alerts for the purposes of automation. The strategy script is also included allowing you to do your own backtesting.
QuantCat Mom Finder Strategy (1H)QuantCat Momentum Finder Strategy
This strategy is designed to be used on the 1 hour time frame, on all x/btc pairs.
The beautiful thing is it plots the take profit, and stoploss for you for each entry- where I would say use the stoploss for sure and feel with water with how the price action is looking when in profit.
In this strategy, I actually implemented my own trading style into building the strategy. Having to replicate my own trading strategy into an algorithm, I can't make it exactly perfect to how I would trade, but what I can do is try and program the parameters that give it the absolute best chance of making a big move with a small drawdown- which replicates part of my momentum trading style. Here I am using RSI, MACD, EMA and trend filtering values to find moments where there has been a momentum change to play the rest of the move. It only picks the best entries.
There is always a 3-4 R/R move on average with with these trades, meaning 1 in 4 only need to hit to be a break even trader- where most of these strategies have about 35% hit rate.
The stoploss is so crucial to minimise any damage from huge unexpected candles, the strategies can just be used for entries as well, you don't have to stick to the exact formula- of the long and short system, but this by itself is profitable.
The system nets positive results on
-ETH/BTC
-LTC/BTC
-XRP/BTC
-ADA/BTC
-NEO/BTC etc.
We also have a free 15M strategy available too.
You can join our discord server to get live alerts for the strategy as well as speak to our devs! Link in signature below!!!


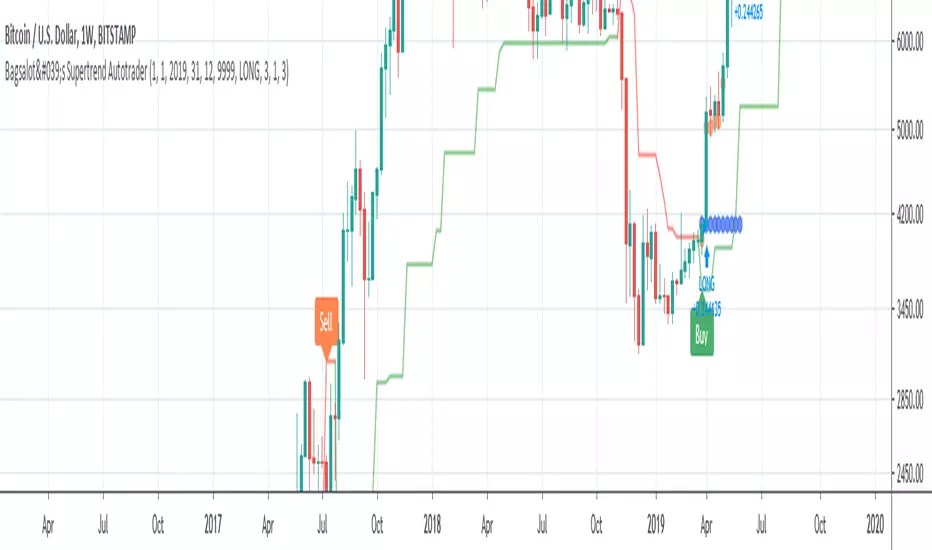
Bagsalot's Supertrend AutotraderTrend reversal indicator with a customizable trailing stop loss. Current model with default values is profitable on most assets (mostly bitcoin) but works on all assets as well. Set total cash invested, % of capital traded and get on to making money :D
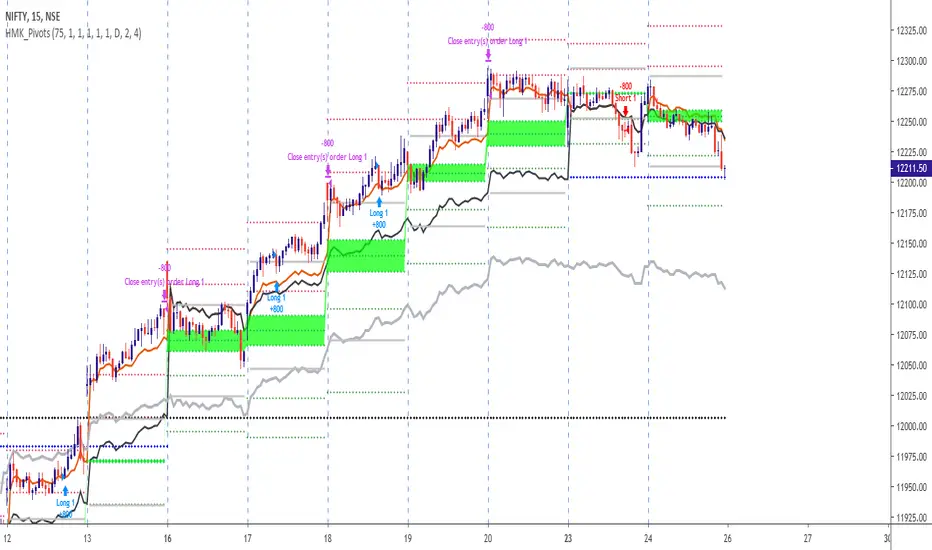
PivotIntradayStrategy@scorpiomanojFRMThis is an intraday trading strategy using Floor Pivots for BankNifty.
This strategy overlays on the charts with wide variety of drawing floor pivots and previous day levels.
VERY IMPORTANT :
1) LONGS AND SHORTS TO BE TAKEN IN 5 MIN CHART. 15 MIN CHART IS DISPLAYED BECAUSE TV DOESNT ALLOW TO PUBLISH WITH TF LESS THAN 15 MIN.
2) BACKTEST RESULTS ASSUME EXITS AT DAY CLOSE ONLY AND NOT BASED ON ANY OTHER CONDITIONS. HENCE ONCE LONG OR SHORT INITIATED IT IS SUGGESTED TO EXIT USING TRAILING STOP OR YOUR OWN RISK APPETITE. EVEN DAY CLOSE INTRADAY EXITS OFFERS A FAIRLY GOOD RESULT WITH ABOVE AVERAGE SUCCESS RATE AND PROFIT FACTOR IN EXCESS OF 1.75.
3) STRATEGY IS BASED ON COMBINATION OF PATTERNS INVOLVING DAILY PIVOTS AND PREV DAY LEVELS THAT IS FOUND TO REPEAT IN BANKNIFTY.
THE DETAILS OF THE STRATEGY IS CONFIDENTIAL.
4) THIS WILL BE AVAILABLE PUBLICLY ONLY FOR A LIMITED PERIOD. THIS LIMITED PERIOD AVAILABILITY IS TO TEST THE RESULTS AMONG VARIOUS PARTICIPANTS INORDER TO SEE THE CONSISTENCY.
YOU CAN REACH ME AT MY TWITTER ID scorpiomanojfrm or my email scorpiomanojfrm AT gmail DOT com
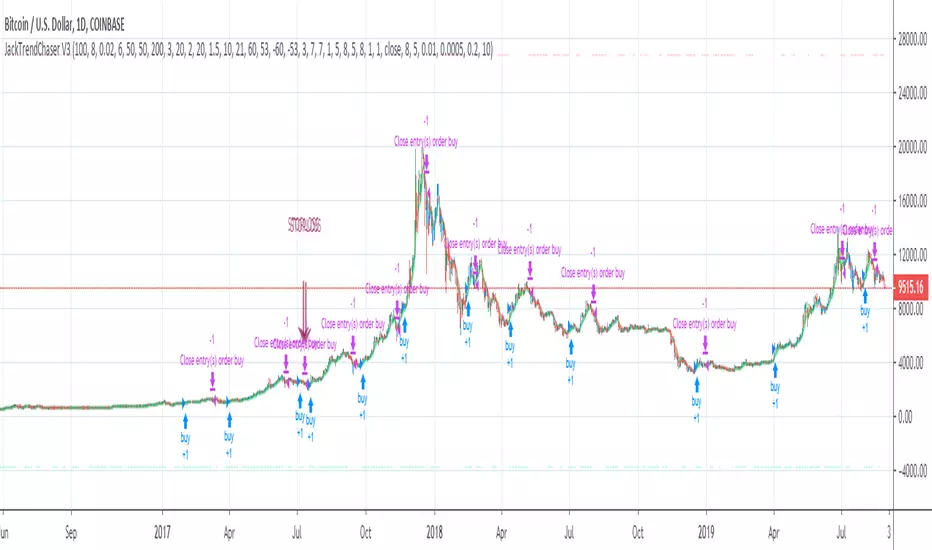
JackTrendChaser V4This is like V3 but with minor improvements - and this script is only protected which means that you are free to try it out!
I would love to know your thoughts on this so please try it out and get back to me :)
Link to V3:
BullRider [JackTz] (strategy)Taking a new approach - I have noticed how all scripts have the same pattern (or issue) when it comes to a bear trend. The majority of scripts works just fine when in a bull trend but once the bears starts to overtake the shit hits the fan and the trades will mostly become negative.
To prevent this I tried to create a script that only trades during a bull run. This strategy is initially created for coins with a big marketcap and for daily timeframe. It works well on 4H timeframes for some coins as well though.
I have tested this through Bar Replay on daily and 4H BTC and it holds out! No repaint!
I will be adding a version for alerts soon.
Please try it out and let me know your thoughts and findings!
//Jack

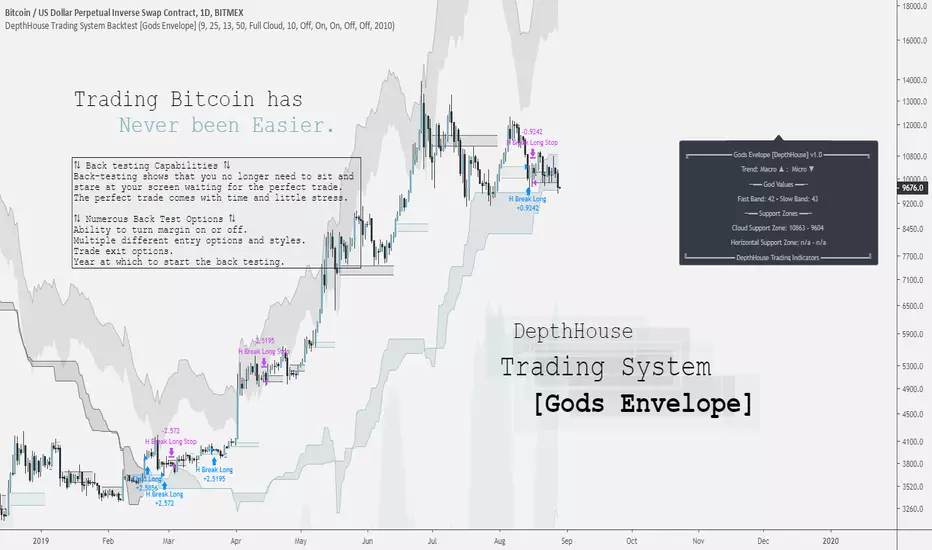
DepthHouse Trading System [Gods Envelope] Backtest StrategyCreated for Bitcoin!
*All testing has been done on the 1 Day time frame of BTC USD pairs.
Use at your own risk.
DepthHouse Trading System Basics
The Cloud:
The cloud is used in a very similar manner as the ichimoku cloud. A complete cross above or below the represents a macro trend change. The cloud then could be used as dynamic support and resistance zones.
By default there is no smoothing to the full cloud. If you wish to add smoothing, you can change the ‘Trend Base On’ option to ‘Modded Cloud Average’ to add price action and smoothing into the cloud’s calculations. The Modded Cloud can then be used in the same manner as the Full Cloud. Generally, the Full Cloud is more forgiving and has less Macro Trend changes. By default, this option is turned off. The support or resistance zone created will be shown on the info panel on the right.
Horizontal Levels:
A Horizonal zone is generated each time there is a micro level trend change. For example, as soon as a positive micro trend change occurs a green horizontal level will be plotted.
These levels then can be used as temporary support and resistance zones. The Horizontal Break Trading Strategy is entirely based on these levels. These levels are also shown on the info panel on the right.
The Envelope Itself: (by default this is off)
By selecting the Overbought and Oversold Ranges option, a cloud envelope will appear around the price action. This envelope represents the overbought and oversold ranges. If the price action should go into these zones, the info panel on the right will show ‘CAUTION’ beside the God Values as this signals that the pair is either overbought or oversold.
The God Values:
The God values are listed on the info panel on the right. These are the values created by the Godmode indicator. Generally, below 20 or above 80 it signals for caution as the price action has overextended itself.
The Back-Test Strategy Options:
⇅ - Child Fomo Positioning:
Child Fomo Positioning strategy is entirely based on the macro trend change with the center cloud. As soon as there is a complete candle close above or below the cloud and a trend change takes place. The back-test places a market order as soon as the next candle opens. By default, it then will not close this position until the price action fully crosses the cloud once again.
⇅ - Horizontal Break Trading:
Horizontal Break Trading Strategy is entirely based on the horizontal levels generated and the macro trend direction. For example, say the Macro Trend is up, and a green, positive horizontal level is formed. As soon as a complete candle closes above the upper level of the positive zone, a limit order is placed in hope that the price action comes back down and retests, filling the order. This long will not close then until a negative level is formed. As soon as a negative level is formed a stop/loss order is placed on the lower level of the horizontal support zone. It will then do the opposite in a bearish trend, and margin trading is turned on.
⇅ - Parent Positions :
Parent Positioning Strategy is based on the overall trend and the center cloud levels. This strategy has limit orders waiting on the level of the cloud that is closest to the price action. Therefore, using this strategy alone, the back-test system waits for the trend to be confirmed, and then follows the price action with limit orders waiting on the cloud to be retested. By default this order does not close until a Marco trend change occurs.
⇅ - Take 50% Partial Profits:
This options allows the back-test to take 50% profit or loss when one of the two options occur.
Horizontal Break: This would close 50% of the position in the same manner it would close a trade using the horizontal break trading system.
God Values: Once the price action enters the oversold or overbought clouds, it would then place a close order as soon as the price action exits the cloud.
⟲ - Backtest Year Start Date :
Start year of the back-testing. If set to ex. 2017, the back-test will not calculate any trades that took place before Jan. 1 of 2017.
⚖ - Margin Trading :
By default, margin trading is turned off. Simply switch this option to on the enable ‘Short Trading’ into the strategy back-test.
Notes: If you are back testing multiple strategies at the same time, you must increase the pyramiding to correspond to the number or strategies.
My Favorite Settings:
Margin = Off
Pyramiding = 2 [Settings → Properties → Pyramiding → 2 orders
Child Fomo Positioning = On
Horizontal Break Trading = On
Everything else off 😊
DISCLAIMER: Past performance does not guarantee future results.
Use at your own risk.
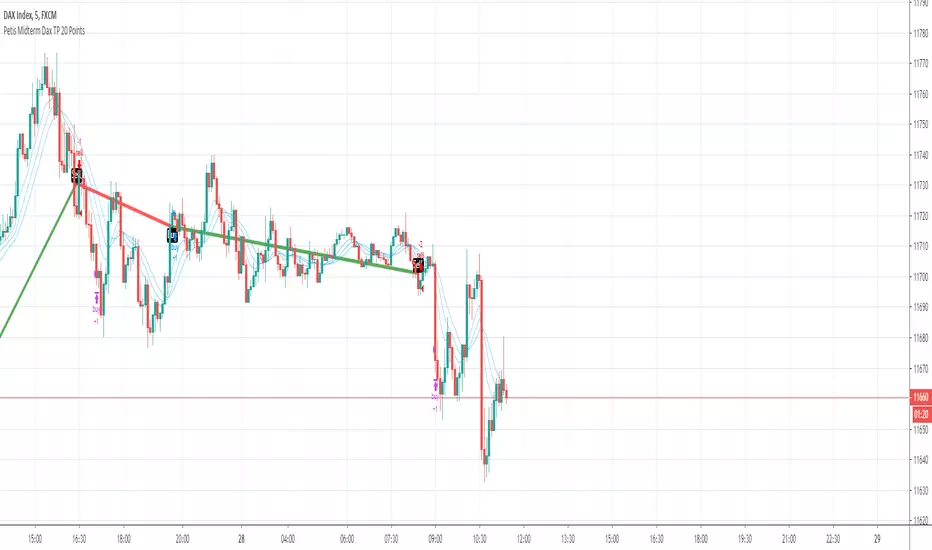
Petis Midterm Dax TP 20 PointsHy Leutz,
hier mein Script für meine Urlaubskasse meiner Frau.
Läuft ausschließlich im Ger30! Und auch da nur im 5 Min! Parameter sind darauf optimiert und getestet.
Meine Standarteinstellung ist 20 Pkt TP, kein SL! (BTW: Einen Not-Stopp-Loss kann man auf 250 Pkt setzen, falls mal alles schief geht oder Trump was twittert!)
Der Trade beginnt, wenn die Vorkerze dauerhaft Buy oder Sell anzeigt, nicht dann, während eine Kerze noch nicht fertig ist. Ansonsten kann es zu Repaints kommen!
Vorsicht: Im blödestens Fall kann es auch mal 100 Pkt gegen einen laufen, deshalb Moneymanagement beachten!
Ich trade es mit 0.2 CFD pro Punkt. Ganzidealerweise wartet man nach einm Signal, dass es erst ein paar Punkte in die falsche Richtung läuft und steigt dann ein. Oder man splittet die Posis und geht mit 50% gleich, mit der 2. Hälfte dann bei -10 Pkt rein. Einfach mal anschauen. Und man setzt die Ziele bitte auch per Take Profit, sonst geht die Gier mit einem durch.
Die beigefügte Historie zeigt die Performance in gut 2.5 Monaten, 1.7 K € . Passt schon. Da geht auch der Mietwagen und die Pizza mit rein. :)
Üblicherweise kommen so 5 bis 25 Signale in einer Woche. Je volatiler der Markt, desto höher die Signaldichte.
Geschrieben für meine Frau, die nebenbei ihre Urlaubskasse füllen möchte. Cheers my Love. Lets got to Hollywood!


Strategy for The Bitcoin Buy/Sell IndicatorThis is the strategy for
Starting with a capital of $3,000 XBT , one might have $15,975 dollar worth of XBT plus whatever the bitcoin has appreciated over the years.
The Sharpe Ratio: 0.586, Net Profit is 532%, 57 closed trades from 2017 till today, Profit factor of 3.745 (aka for every dollar loss, there is 3.745 dollar profit) with 14% drawdown .
Let that sink in.


BTC strategy for margin tradingAlmost identical to the one I published before, but this one includes short orders as well.
I didn't spend much time backtesting, so there may be a different set of parameters that gives better results. Please let me know if you find something!

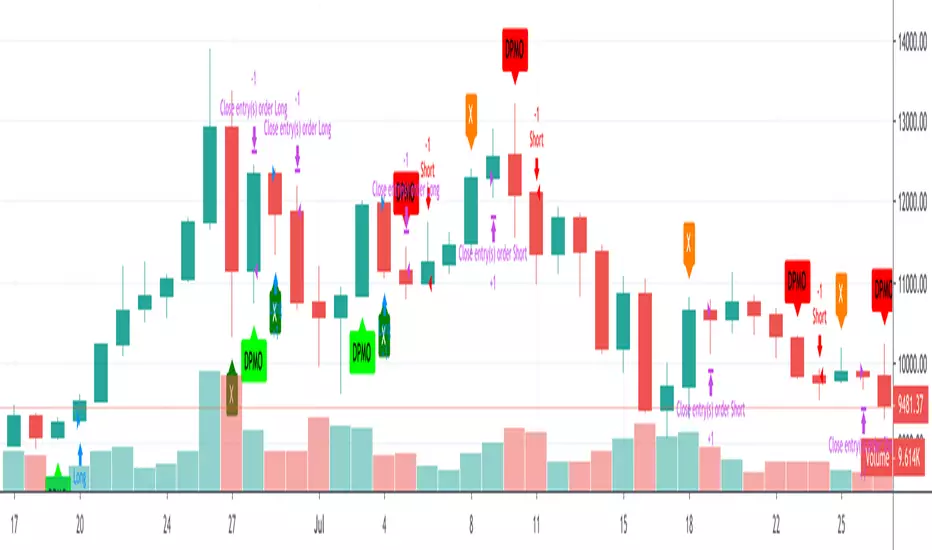
Express - Strategy TesterWelcome to the Express - Strategy Tester.
This indicator is used for back-testing. Once you have found settings that you like, you can use my other published indicator "Express" to set alerts.
How to use: Apply to any chart, on any time frame. You will see LONG and SHORT signals on the chart. A LONG signal represents an entry/buy in, and a SHORT signal represents an exit/sell.
You can use the Express - Strategy Tester to scalp on low time frames such as the 5m, 15m, 30m etc. Or use it on higher time frames such as the 1hr, 2hr, 4hr.
You can use regular candles but Heikin Ashi are recommended for better accuracy.
When using Heikin Ashi, I have included a real price line which shows the actual price of the asset/chart at the close of each candle.
You cannot set alerts with this indicator!


