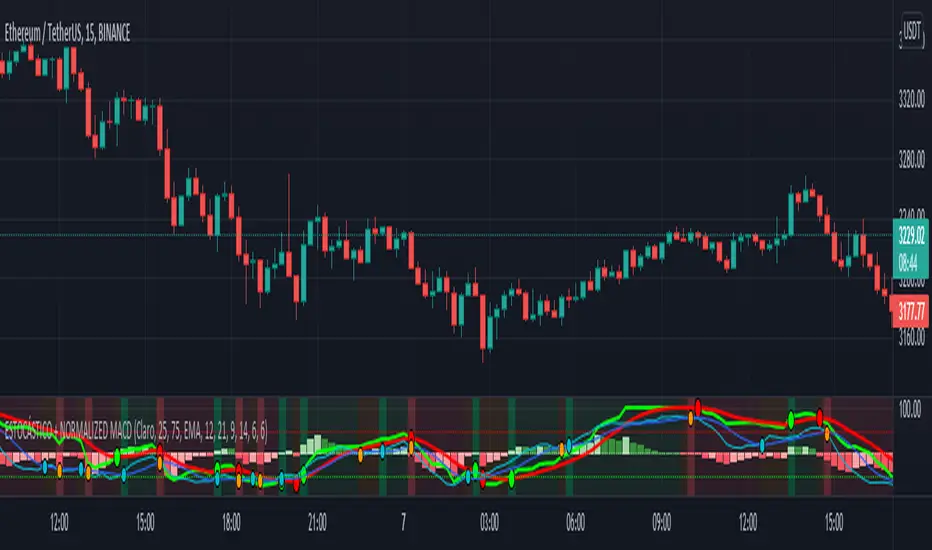
ESTOCÁSTICO + NORMALIZED MACD=== INTRO ===
This is a 2 in 1 indicator, STOCHASTIC + NORMALIZED MACD.
I release this script as public because both stochastic and normalized macd are public, so I cannot find any reason to post it as private :)
=== USAGE ===
You can use any of the indicators by itself as usual, stochastic as a oversold/overbought indicator as a momentum/trend indicator.
Usually, crossovers are used for LONG/SHORT entries.
I added dots for crossovers as well as background colors to show movement direction when both indicators agree: green = bullish, red = bearish and orange = range/consolidation.
=== SETTINGS ===
Default settings for both indicators have been changed (but they're of course configurable), to make them work better together.
You can also change NMACD moving average time to SMA or WMA instead of SMA, SMA is really slow for me but give it a try, WMA is more aggressive.
=== RECOMMENDATIONS ===
Always look for higher timeframes, for example, if you're trading 1h, don't try to catch a 1H "ALL GREEN" LONG while 4H is "ALL RED" because otherwise you're just "trying" to catch a bounce in the 1H chart that could never happen, always trade with the main trend.
Try to catch both crossovers in the opposite area, ex: try to LONG when both indicators are below 50 and SHORT above.
I did not test divergences on this indicator, as the MACD is normalized i prefer to use a standard MACD for that, but you can use the stochastic for sure.
Macdcrossover
Honey CypherHoney Cypher Aims to do 4 things
Momentum
Trend Strength
Overbought and oversold zones
Being the most beautiful indicator you ever see
Momentum
The big yellow honey waves primary use is to see the momentum of the market, they can be used in a similar way you would use a MACD or Chaikin Money Flow
On this image you see the honey waves being plotted to the 30 minute timeframe while on the 5 minute chart to have an understanding of longer time momentum in the chart.
Trend Strength
Most tools of the indicator can be used for that but the yellow and purple slope strength lines are made specificaly for this. When you see them curl down you know trend is strengthening towards the downside.
The candle color is based on the amount of Honey waves sloping in one direction. This might be the best tool in the indicator to find Trend Strength. Bright yellow candles mean strong bears while the bright blue candles mean strong bulls.
Overbought and oversold zones
By analysing the waves on a chart you start to learn how big waves can get before a reversal or consolidation period arrives.
You can become profitable with the indicator. But to be honest, my primary focus in making this indicator was find ways to visualise alot of data in a clear and beautiful way.
You should use the indicator with some out of the box ideas instead of just trusting the signals.
examples:
Find a head and shoulders pattern on the top of a huge honey wave.
Find a bottom small wave while the others honey waves are in the opposite direction for entering a pullback.
Use the honey for direction but the yellow and purple slope line crosses for entrys.
Comment your own strategys, I made this open source to be able to get community feedback.
The Honey Cypher waves are calculated in a similar way as the MACD histogram. I've combined MACD formula with some of the lazybear formula. It looks for the distance between 2 moving averages to find trend strength. After that the end results get's smoothed out. It is very satisfying to change that as you can see the honey waves create a melting like motion on each change of smoothing.
Below a preview of the honey cypher moving average lines, all lines have a length that is based on the fibonacci number sequence. Honey cypher measures the distance between for example length 5-8 averages.
I hope this inspires coders to create very beautiful scripts.

MACD With Crossings and Above Below ZeroMACD with MACD Derivative, Crossings Above and Below Zero, Shading for ADX Smoothing and Overlayed RSI
Primarily a moving average convergence divergence (MACD) momentum indicator. Also includes a MACD Derivative overlay to show when momentum has peaked. Displays triangle symbols when the MACD line crosses the signal line (larger triangle when MACD crosses above/below zero to indicator stronger momentum trend). Includes shading for average directional index (ADX) to futher determine when the price is trending strongly (red when the ADX value is greater than 25, and idicating a strong trend; otherwise blue). Lastly, has a relative strength index (RSI) momentum indicator overlayed to help evaluate periods of overbought or oversold conditions.

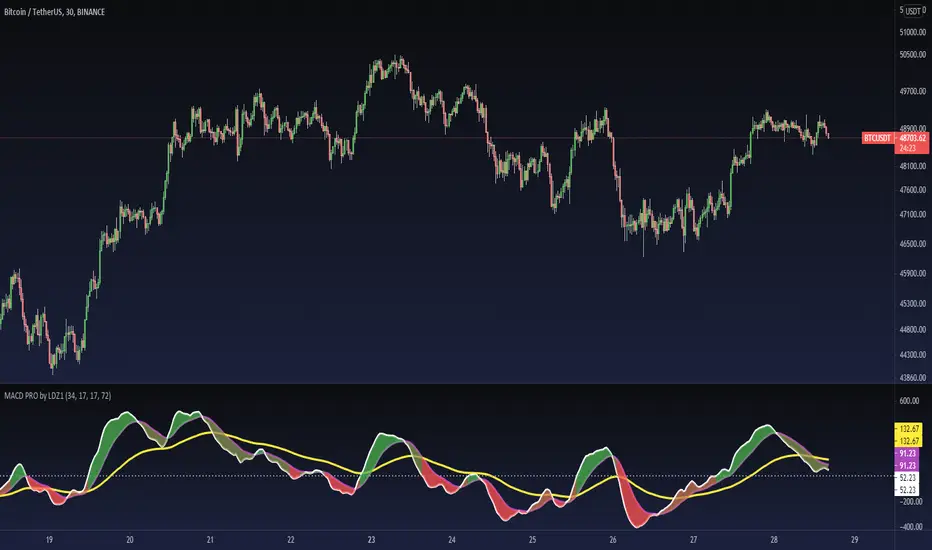
MACD PRO by LDZ1LANDZZ1 MACD Pro was developed to show the first signs of reversal, direction, and also trend strength.
Unlike normal MACD, this indicator has 3 lines as information. A white line (short EMA), a purple line (sign), and a yellow line (long EMA).
The Purple Line "Signal" is a 17-period Exponential Moving Average.
The White Line "Short EMA" is a 34-period Exponential Moving Average.
The Yellow Line "Long EMA" is a 72-Period Exponential Moving Average.
When the background color turns green it indicates that we are above 0 (positive trend) and above the Signal line (positive trend)
When the background color turns Yellow it indicates that we are above 0 (positive trend) but below the Signal line (Indicating Attention to a possible trend reversal or price correction)
When the background color turns Red it indicates that we are below 0 (negative trend) and below the Signal line (negative trend)
When the background color turns Orange it indicates that we are below 0 (negative trend) and above the signal line (Indicating attention to a possible trend reversal or price correction)
The Yellow line is like a watershed, when the White Line "Short EMA" crosses above or below it, it indicates that a stronger price movement may occur.
Tip:
Only enter Long Positions when the background color turns green and the Short EMA (White line) is above the yellow line and/or the white dotted horizontal line.
Only enter Short Positions when the background color turns red and the Long EMA (Yellow line) is below the white dotted horizontal line.
Note the difference of MACD Pro by LANDZZ1 as the traditional MACD.
----------------------------------------------------------
Description in Portuguese-BR
MACD Pro by LANDZZ1 foi desenvolvido para mostrar os primeiros sinais de reversão, direção e também força da tendência.
Diferente do MACD normal, este indicador tem como informação 3 linhas. Uma linha branca (short EMA), uma linha roxa(signal) e uma linha amarela (long EMA).
A Linha Roxa "Signal" é uma Média Móvel Exponencial de 17 períodos.
A Linha branca "Short EMA" é uma Média Móvel Exponencial de 34 períodos.
A Linha Amarela "Long EMA" é uma Média Móvel Exponencial de 72 Períodos.
Quando a cor de fundo ficar verde indica que estamos acima de 0 (tendência positiva) e acima da linha de Sinal (tendência positiva)
Quando a cor de fundo ficar Amarelo indica que estamos acima de 0 (tendência positiva) porém abaixo da linha de Sinal (Indicando Atenção a uma possível reversão de tendência ou correção de preço)
Quando a cor de fundo ficar vermelho indica que estamos abaixo de 0 (tendência negativa) e abaixo da linha de Sinal (tendência negativa)
Quando a cor de fundo ficar laranja indica que estamos abaixo de 0 (tendência negativa) e acima da linha de sinal (Indicando atenção a uma possível reversão de tendência ou correção do preço)
A linha amarela é como um divisor de águas, quando a linha branca (Short EMA) cruza para cima ou para baixo dela, indica que um movimento mais forte forte de preço poderá ocorrer.
Dica:
Apenas entre em Long Positions quando a cor de fundo ficar verde e se a Short EMA (linha Branca) estiver acima da linha amarela e/ou da linha horizontal pontilhada branca.
Apenas entre em Short Positions quando a cor de fundo ficar Vermelha e se a Long EMA (linha Amarela) estiver abaixo da linha horizontal pontilhada branca.
Repare a diferença do MACD Pro by LANDZZ1 como o MACD tradicional.
MACD Crossover with signalsMACD Crossover with signals - a simple trading indicator based on classic MACD.
It shows crossovers and plots them on chart as "Long" or "Short".
The MACD itself is not plotted in order to keep your charts cleaner.
By default, all the crossovers are displayed on the chart.
However, you can use only trend-based ones. They are filtered according to the trend (which is plotted and colored using 200 period EMA) and the "zero-line rule" of the MACD.
So if you consider using only trend-based signals, the indicator will only show Long signals on an uptrend and Short signals on a downtrend.
All signals/lines can be turned on/off and styled in the settings menu.
It can be used with all major timeframes and assets (crypto, fx, cfd, stocks, commodities etc).
Consider using it with respect to your trading style, money- and risk-management as well as other strategies and indicators.
If it was useful for you – hit the Like button and share it with your friends - it's free 😉

MACD with 3 strategiesMACD WITH 3 STRATEGIES
- Macd line change colour when cross the signal line
- Background Color change colour based on a moving average, on settings the value of the moving average can be changed 50,100,150,200
- Strategy one based on Macd lines with bar changing colours
- Strategy two based on Macd lines but with a different method
- Strategy three based on two other trending indicators
This indicator can be used to spot trends and changing of direction of the market and with the bar coloured its easier to identify them.
The strategy one can be used as confirmation of a trend or as changing direction integrated with other indicators like Rsi , Stochastic, Supertrend , Bollinger band, with ema option mode works better.
The strategy two can be use together with the back ground colour: When is red and the candles are red can be identified as strong drown trend.
When is green and the candles are green can be identified as strong up trend.
The strategy three can be used after checked the strategy two for more confirmation for a trend.
VERY IMPORTANT WHEN YOU TRY A NEW STRATEGY TEST IT IN A DEMO ACCOUNT FOR AT LEAST 3 MONTHS
Every donations will be devolved to cancer research and you ll have one month free trial.
If you want to purchase this indicator 30% will be devolved to cancer research.
Please leave a comment or message me if you want you have two weeks trial.
Enjoy!
MACD Crossover Trend IndicatorThis is a very simple " the trend is your friend " indicator - if you are consistent!
How this indicator works:
This indicator detects MACD Crossovers based on the current trend. It checks wether the current close price is above or below the 200 EMA and therefore decides whether we are in an up- or down trend.
UP-TREND: If the price is above the EMA200, the MACD is below 0 and crosses up the signal line, then this is a BUY signal!
DOWN-TREND: If the price is below the EMA200, MACD is above 0 and crosses down the signal line, then this is a SELL signal!
You can also add an alert, that keeps you informed, once one of these scenario happens for a certain pair!
With this indicator you will never enter against the trend.
Have fun! :)

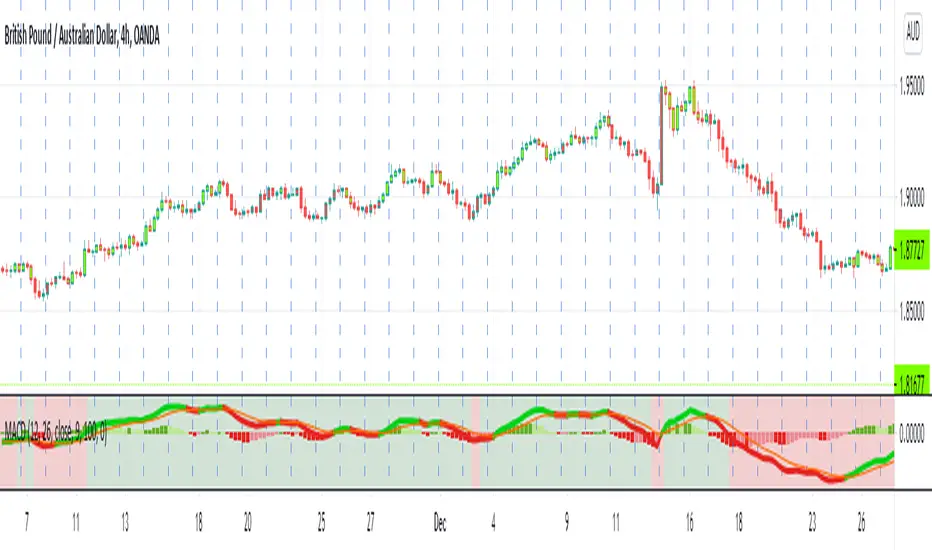
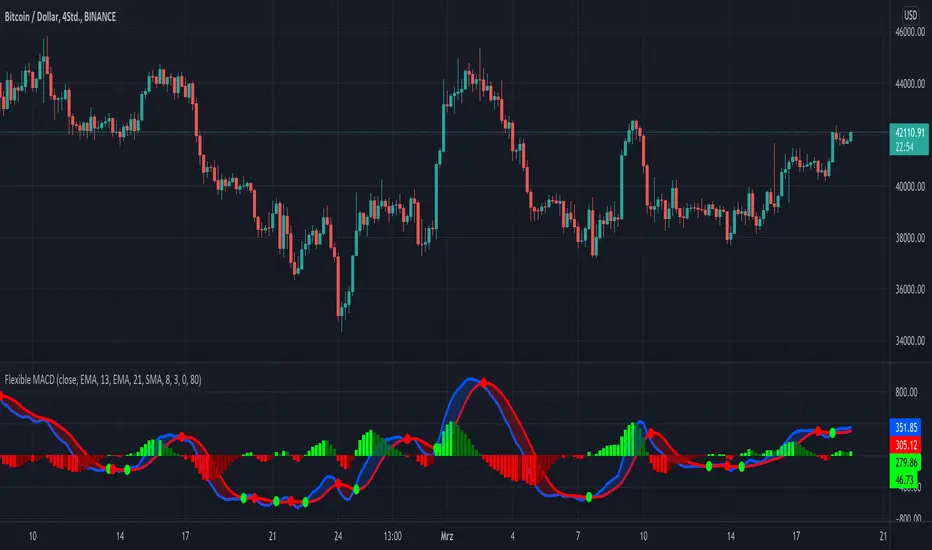
KINSKI Flexible MACDFlexible MACD (Moving Average Convergence/Divergence) Indicator
The Moving Average Convergence Divergence consists of three elements: two moving averages (the MACD line and the signal line) and a histogram. The blue MACD line is the difference between a longer and a shorter EMA (here 13 and 21 periods preset), the red signal line is an SMA (here 8 preset) on the MACD line. The histogram (green: ascending, red: descending) shows the difference between both lines.
As soon as the blue MACD line crosses the red signal line, circles are generated that indicate an up/down trend. If the red signal line is greater than or equal to the blue MACD line, this indicates a downward trend (red circle). If the blue MACD line is greater than or equal to the red signal line, this indicates an upward trend (green circle).
The special thing about this MACD indicator is the many setting options, especially the definition of the MA variants for MACD (Fast, Slow) and signal. You can define the following MA types: "COVWMA", "DEMA", "EMA", "EHMA", "FRAMA", "HMA", "KAMA", "RMA", "SMA", "SMMA", "VIDYA", "VWMA", "WMA".
You also have the following display options:
- "Up/Down Movements: On/Off" - Shows ascending and descending MACD, signal lines
- "Up/Down Movements: Rising Length" - Defines the length from which ascending or descending lines are detected
- "Bands: On/Off" - Fills the space between MACD and signal lines with colors to indicate up or down trends
- "Bands: Transparency" - sets the transparency of the fill color
Disclaimer: I am not a financial advisor. For purpose educate only. Use at your own risk.
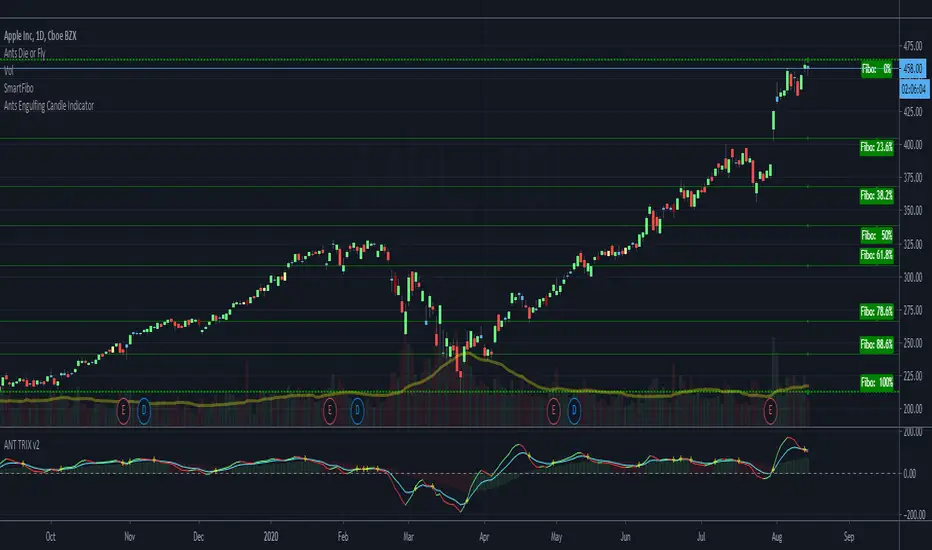
McClellan Oscillator [CC]The McClellan Oscillator was created by Sherman and Marian McClellan and it is essentially a MACD of the advancing and declining symbols of the day and is best used as a comparison with the biggest stocks such as my example Apple but that is just my opinion. I pulled the symbol names from a Trading View blog so I'm not 100% sure if they are accurate so please let me know if I'm wrong. Buy when the indicator is over 0 and sell when it falls below 0 but keep in mind that these values are for the market itself and not the individual symbol.
This was a special request so let me know if you would like me to publish more scripts or if you want something custom done!
Note: I'm republishing this because the original script couldn't be found in searches so this will fix that.

MACD crossover while RSI Oversold/OverboughtThis indicator draws signals on the chart when a Bullish MACD Crossover occurs at the same time RSI is "oversold", and also when Bearish MACD Crossover occurs at the same time RSI is "overbought"
Indicators are drawn on the chart in the following scenarios:
1. Bullish signal
a. MACD bullish crossover occurs on a single bar
b. RSI was below the Oversold threshold (29 by default) within the prior 5 bars
2. Bearish signal
a. MACD bearish crossover occurs on a singnle bar
b. RSI was above the Overbought threshold (71 by default) within the prior 5 bars

ANTS BEAST MODE TRIX+MACD TRIX CROSSThis indicator is both the TRIX + MACD all in one inidicator -- a + sign is displayed whenever the trix crosses
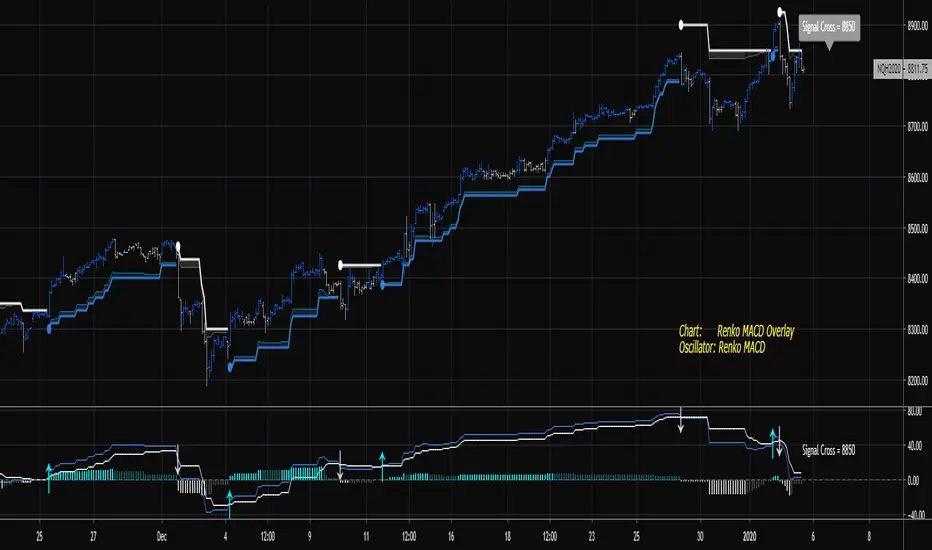
Renko MACDThe goal of this indicator is to plot the MACD, Signal, and Histogram values "as if" the chart is a true price action based Renko chart. It can be used on a time series chart or Renko series chart. The MACD is derived from the raw price action of a time-based chart, where the historic and live price is clustered into Renko bricks. The Renko brick production algorithm is entirely backed by Renko Overlay Ribbon and thoroughly tested.
The algorithm takes into account rapid brick production within a single time candle and adjusts accordingly. The output may vary slightly between different chart time frames for the same indicator settings, but this is due to the lack of price fluctuation visibility that can occur in higher chart time frames. If the brick tick size is low, an appropriate chart interval should be selected that maximizes the amount of price volatility visible to the indicator. A bad setting would be something like a 1 tick EURUSD Renko setting on an H4 or Day chart, there simply is no way to derive the exact and ordered price fluctuations in a single candle, 1 pip at a time. A more appropriate chart time frame would be 1-5 minutes for this selected Renko brick size.
Please find the following video introduction helpful for this indicator and the Renko MACD Trend indicator:
If you are interested in the RSI-RENKO DIVINE Strategy please have a look here:
Contact me in Trading View or telegram for more information and access instructions.
Telegram: t.me
Daily Edge: www.daily-edge.com
Ultimate MACD Super PackFor all MACD appreciators out there, I present my "Ultimate MACD Super Pack" multicator employing PSv4.0. This is one of my first combo oscillators I initially built a very long time ago with my new introduction to Pine Script. With recent improvements to Pine, I felt it was finally time to publish this. The basic list of indicators summarized is, a "quadruple MACD", a rescaled mutation of "Reverse EMA", and also what I would describe as "Moving AVERAGES Convergence/Divergence"(MAsCD) with an 's'. MAsCD doesn't use the standard MACD formula, but another mathemagical method that is inherently MACD like. All of the quadruple MACDs have short/long(fast/slow) periods that accept floating point numbers for ultimate MACD tunability. However, the signal period for MACD #1 will only accept an integer using sma (). The three faster MACDs(#2, #3, and #4) have distinct crossover/under pointers for overbought/oversold conditional states. Just so everybody knows, using 4 MACD histograms simultaneously is not what I had in mind, so there are none included in this multicator. Lastly, an enhanced version Dr . John Ehlers "Reverse EMA" is included, because it has MACD histogram like characteristics, if you haven't noticed. Instead of "Reverse EMA" using an 'alpha' decimal number as originally designed, I simply converted it to a standard period most will comprehend with ease. I also "superized" everything recently using my novel concepts I have recently discovered. All of these complimentary indicators combined, are nicely packaged into one information packed multicator. Now you may understand the title much better and why it is entitled as such. I included the maximum amount of adjustabilty I could summon within my current mind to give the user ultimate control for each indicator as an attempt to create a heavenly MACD experience. My intention is for this to become the "pinnacle" of MACD innovation.
Features List Includes:
Adjustable Transparency
Enable/disable dark background for enhanced visibility
"Source" selection with multiple time frame adjustments for indicators
All indicators shown are enable/disable capable independently
Individual enable/disable capable MACD crossover/under pointers
MACD short/long periods accept floating point numbers, yes it's true!
AND much, much more...
This is not a freely available indicator, FYI. To witness my Pine poetry in action, properly negotiated requests for unlimited access, per indicator, may ONLY be obtained by direct contact with me using TV's "Private Chats" or by "Message" hidden in my member name above. The comments section below is solely just for commenting and other remarks, ideas, compliments, etc... regarding only this indicator, not others. If you do have any questions or comments regarding this indicator, I will consider your inquiries, thoughts, and ideas presented below in the comments section, when time provides it. When my indicators achieve more prevalent use by TV members, I will implement more ideas when they present themselves as worthy additions. As always, "Like" it if you simply just like it with a proper thumbs up, and also return to my scripts list occasionally for additional postings. Have a profitable future everyone!
