ATR Stop Loss and Take Profit FinderThe purpose of this tool is to help the trader determine a safe stop loss price and take profit which dynamically changes due to ATR (Average True Range)
This tool uses the concept of
ATR (Average True Range)
Risk Reward Ratio (Money Management method)
How is ATR Stop Loss and Take Profit Finder working
Step 1 ) Tool will calculate TR(True Range
Step 2) Then the TR will be used to find the Average value of X time frame, using 5 math models: RMA SMA EMA WMA and LSMA
Step 3) The value from Step 2 will be multiplied by the factor, and the result is ATR
After we got ATR Value, the Tool will find 2 lines: Upper Band and Lower Band which will function as a Stoploss value for both Short and Long trade
ATR Stop Loss and Take Profit Finder will be using Upper Band and Lower Band to calculate Take profit price. A trader can set their Target Risk Reward Ratio by setting
How to use ATR Stop Loss and Take Profit Finder
ATR Stop Loss and Take Profit Finder is not an indicator, it is only a tool to help the trader quickly find their stop loss/take profit price. t
For open long position, We comment trade to switch mode of 'Type of open Position to be long. Same as short which is need to be changed to short
Moneymanagement

NNFX Exposure UtilityOVERVIEW
This tool allows the user to manually keep track of how much of their account is currently exposed to each currency, and keep that information handy and organized on the chart as a table.
It is specialized for NNFX traders who are trading all the pairs among the 9 major currency crosses: AUD, CAD, CHF, EUR, GBP, JPY, NZD, SGD, USD.
HOW DO I USE THIS INDICATOR?
Before you take a trade, you should open the indicator settings for this indicator and check off which currencies you are about to go long and short on. Here are 3 trades taken as examples:
If you go long on EUR/USD with 2% risk, your exposure is 2% long on EUR and 2% short on USD.
Then if you go short on GBP/SGD with 2% risk, your exposure is 2% short on GBP and 2% long on SGD.
But if you go long on SGD/JPY with 2% risk, your exposure would now be 4% long on SGD and 2% short on JPY. This is against your rules if you are trading the NNFX way. So this tool allows you to see when you are about to accidentally overexpose yourself to any currency pair.

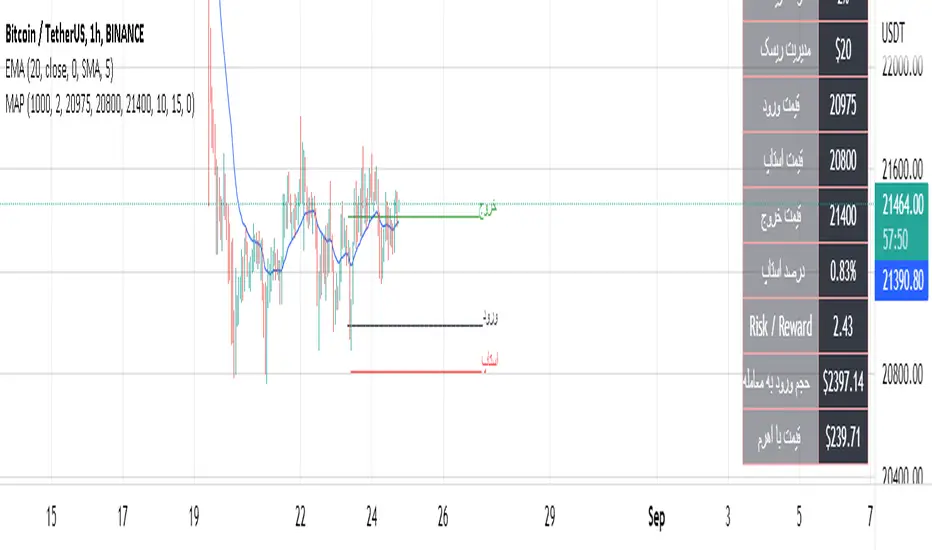
MAP Money ManagementThis indicator lets you manage your risk as your assets in each position SO you can see the right way in money management and risk management as well
when you know how much you need to put in your positions you should see the volume of your trade and control your risk to be a winner in all ways and have the best win rate.
You can use it so easy and it is going to so helpful
good luck
Future Risk CalculatorCreated out of revenge against the difficulty of controlling psychology, greed, and risk management. Designed for cryptocurrency futures trading by following the risk management principles from Kevin Sailly. Very welcome if there are suggestions and input to improve the quality of this "indicator". Please use wisely.
How to use:
1. Open indicator settings.
2. Fill out all the forms. (Note: I make Max Loss Risk only has 5 options. Because, you know, to control the greed. You can choose by considering your risk profiles and market condition)
3. All of the information and calculation will appear on the label (right side of the bar chart) and top-right box.
4. You can adjust the three prices (target, entry, and stop) by clicking any part of the indicator. There will be three dots in the middle of the chart window (align with three prices). Click that dots and drag them up/down to customize according to your wishes. The price order must be correct, for LONG direction the price order from the top is target-entry-stop. Vice versa for SHORT direction. There will be "SETUP ERROR" text in the top-right box if the price order is not correct.
"Never, ever argue with your trading system." (by Michael Covel)
Regards,
Ircham

Trade & Risk Management Tool (Expo)█ Trade & Risk Management Tool (Expo) is a sophisticated and complete trading tool that helps traders manage their position and risk. This tool makes risk and trade management simple and convenient; literally, anyone can use it. The key feature is its ability to set the stop-loss automatically.
█ The key feature of this tool is that it sets the stop loss automatically depending on the current market characteristics; in other words, it's a stop-loss that adapts dynamically and optimizes to suggest the best possible stop-loss at that time. In addition, the user can set the preferred risk-reward, and the tool will automatically calculate the RR and Take Profit Levels for you. There is also a possibility to add up to 4 take profit levels, all based on your set RR.
The Auto Stop-loss feature comes with even more customization, and the trader can enable a trailing stop and set a custom stop-loss instead of using the default one.
█ The Trade & Risk Management Tool also calculates the current position P&L in points/pips or %. Positions size is automatically calculated based on the account size and % of the capital you want to risk. In addition, we have added Expected Return in % for the active position. This is a feature that experienced traders commonly use. Set the Probability of Gain and the Probability of Loss, and the tool will calculate the expected return based on the SL and TP. The probability of gain/loss can be calculated using historical data or for experienced traders by making an educated guess.
█ Why is this tool needed?
Trade & Risk management is a key concept to grasp and use in your trading, and it's one of the most critical aspects that will determine your long-term success in this industry. The market is uncertain, and it's impossible to know what the future holds. The only way to take control of the unknown is to have a sound risk management system that ensures you don't blow your account in one trade. Therefore all traders need to understand the importance of using a risk- and money management tool that calculates and provides stop-loss and take-profit levels in real-time. This way, you will always know where to take your stop-loss and secure profit.
The position size calculator prevents you from taking too much risk and the predefined stop-loss and take-profit levels help you manage your position. The tool makes sure you maximize the profit potential while minimizing the losses. It also prevents you from taking too much risk.
It all comes down to managing the risk and managing profit. Make sure that you always know how much you can risk at each trade, where to put your stop-loss, and take profit. A general rule is to find a good balance between reward and risk (RR), preferably a risk-reward ratio of 2:1 or 3:1, where your targeted profits are always double that of your maximum losses.
█ This trading tool makes something so important so easy for you, and it's a must-have to succeed in trading for the long term.
█ HOW TO USE
Use the tool to manage your active position.
-----------------
Disclaimer
Copyright by Zeiierman.
The information contained in my Scripts/Indicators/Ideas/Algos/Systems does not constitute financial advice or a solicitation to buy or sell any securities of any type. I will not accept liability for any loss or damage, including without limitation any loss of profit, which may arise directly or indirectly from the use of or reliance on such information.
All investments involve risk, and the past performance of a security, industry, sector, market, financial product, trading strategy, backtest, or individual's trading does not guarantee future results or returns. Investors are fully responsible for any investment decisions they make. Such decisions should be based solely on an evaluation of their financial circumstances, investment objectives, risk tolerance, and liquidity needs.
My Scripts/Indicators/Ideas/Algos/Systems are only for educational purposes!

SMART4TRADER -ATR viewIndicator in the form of an information panel in the upper right corner
the indicator shows ATR (Daily, Weekly, Monthly) in percentage and points.
Calculates position size considering volatility and given risk
The indicator also takes into account the multipliers in the contract
_--------------------------
Индикатор в виде информационной панели в правом верхнем углу
индикатор показывает ATR (Daily, Weekly, Monthly) в процентах и пунктах.
Рассчитывает размер позиции с учетом волатильности и заданного риска
Так же индикатор учитывает множители в составе контракта

Strategy - Cryptosystem NNFX wayFirst script done!
This is my version of the No-Nonsense Forex (NNFX) Strategy
This strategy shows you the entry and exit signal with a standard 1.5 x ATR for Stop Loss and 1 x ATR for Taking Profit. You can adjust the settings to your needs.
This strategy uses 5 indicators:
1. Average True Range for SL and TP placement, there is a nuance where you can add the 1XATR Rule;
2. SMA used to filter longs and shorts;
3. SSL Channel for 1st Confirmation;
4. DPO for 2nd Confirmation;
5. Waddah Attar Explosion as a volume indicator.
There is no exit indicator because I coded 2 trades (2x0.5). TP1 will be at 1xATR and TP2 will automatically trail behind with 1.5XATR. You can see the red trailing line on the charts.
Other exits can be: When SSL gives opposite signal or when price crosses and closes your baseline.
I used this system for 1D timeframe.
Hopefully this can be usefull for your tradingstyle.
Would be great if you guys leave a like.
Thanks!

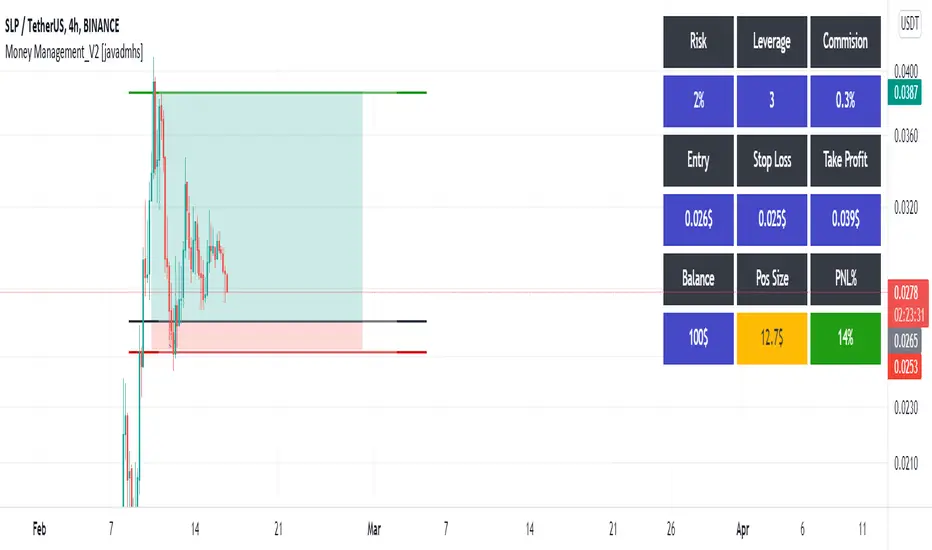
Money Management_V2 [javadmhs]Hi every one
you can use this indicator in your trades for money and risk management.
Very easy to use. Just enter the requested information of your trade and see the amount of money you need to enter into a transaction. Also you can see your pnl%.
Risk = The amount of money that if you lose, does not matter to you. This will be a percentage of your total capital.
Balance = your total capital.
Leverage = If you trade in future, you can use this. set it 1 in spot.
Commision = The amount of exchange fee.
Usable Cap = The amount of money you should enter into a transaction, depending on your risk.
PNL% = Amount of profit and loss.
You Can use this for Short and Long.
Let me know if you see a problem.
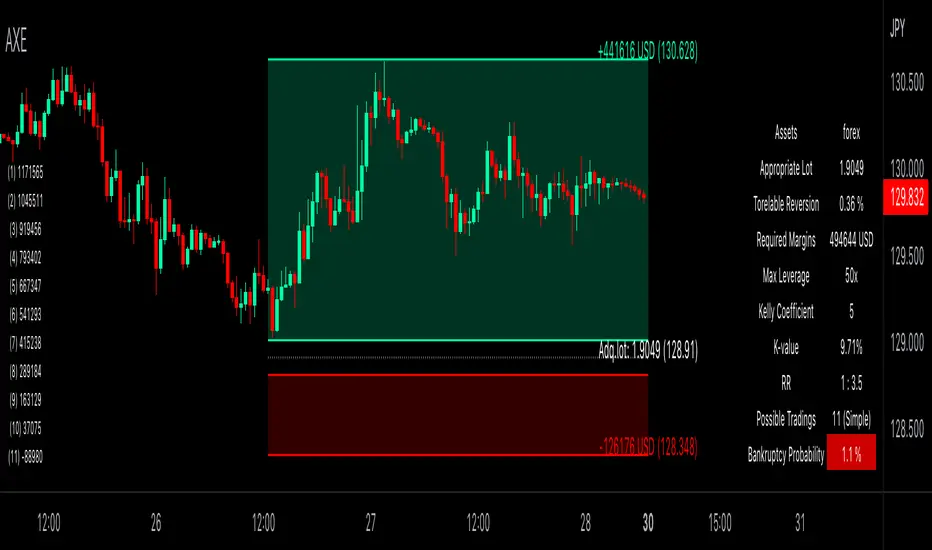
Auxiliary Equity Configurator (AXE)Auxiliary Equity Configurator (AXE) is a whole new level money management auxiliary that calculates statistically preferable lot based on the Account balance, Winning rate, Risk reward ratio, and Kelly multiplier configured a priori in the input panel.
On the chart, RR visualization bands, Expected balance history matrix in the worst successive trading loss (for displaying how many times you can trade with a given lot at simple/compound interest), and Info-table for the calculation details are shown.
Regarding RR visualization bands, whenever the Tolerable drawback input changes, the proper lot is calculated based on the given data. You can easily access how many lots you should possess and the take-profit/stop-loss price to set. A tolerable drawback can be placed in the quoted currency rate of the displayed chart, except the forex and part of CFD symbols (Gold, Silver, Platinum, WTI oil, Brent oil, Natural gas, and more in the future!) that is valued in Pips. Parameters are configurable in suit with the broker you are using. Also, RR visualization bands are brilliantly interactive, thanks to pine v5 interactive scripts.
The currency for Account balance and Tolerable drawback is automatically converted to USD for internal calculation; therefore, no mess-ups around thinking currency value conversion whatsoever! The design for each tool is highly customizable, too.
Unleash yourself from consuming the colossal amount of time thinking of money management with AXE!
SignalsThis script allows you to calculate position size, and future profit, loses.
- You can add 3 target values and 1 stop loss
- Optionally you can display table, position it as you like, and see risk ratio
Plans:
- add profit loss to the labels

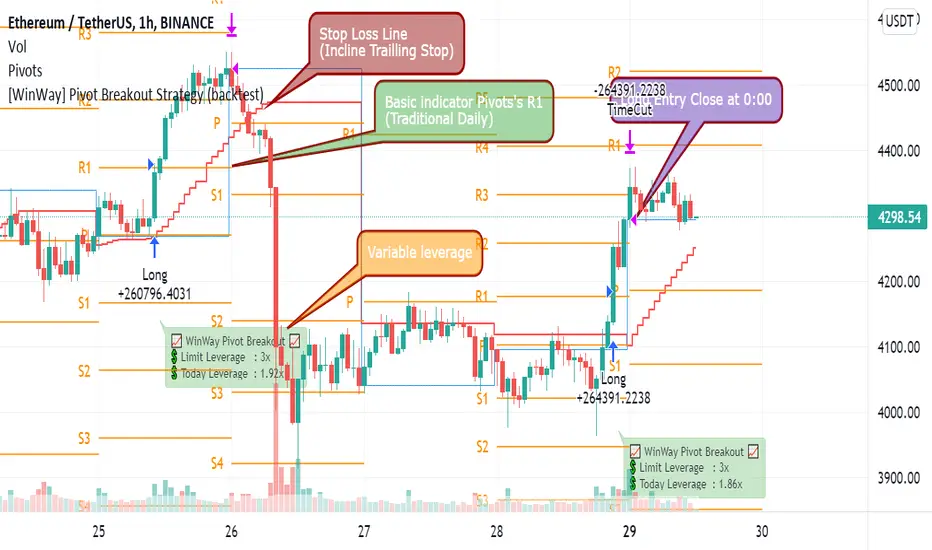
[WinWay] Pivot Breakout Strategy (backtest)This is the Winway's Pivot breaktout,
Using the Pivot point , we made a new volatility breakout strategy.
It's the strategy for ETH / BTC.
Please choose 1H time frame.
No repaint.
"As a long-only day trend strategy, we pursue profits in the downward / transverse / rising market."
- It will be exited based on the closing price of the day as a strategy to take only the day trend.
- It's a long-only strategy without short trade.
- It has high market adaptability in response to market volatility .
"The efficiency has been increased by delicate control of entry volume ."
- Control losses by managing funds in line with market changes.
- Calculate the leverage on the real time automatically.
- It goes in more when it's advantageous and less when it's disadvantageous
- It's a welfare strategy that works against assets
"We further lowered the risk by cutting off in installments."
- If you judge that the trend has declined on the day, you will break off and respond to a sharp drop by using the real time trailing stop.
========================================================================================
윈웨이의 피봇돌파입니다.
피봇 포인트를 이용한 새로운 변동성 돌파 전략입니다.
이더리움과 비트코인을 위한 전략이며
1H 타임프레임으로 선택해주세요
리페인트는 발생하지 않습니다.
롱 온리 당일 추세 전략으로 하락/횡보/상승 장에서 수익을 추구합니다.
- 당일 추세만 취하는 전략으로 일봉 종가 기준 청산됩니다.
- 숏은 없는 롱 온리 전략입니다.
- 시장 변동성에 따라 대응하여 시장 적응력이 높습니다.섬세한 진입 물량 제어로 효율을 높였습니다.
- 시장 변화에 맞춰 자금관리를 하여 손실을 제어합니다.
- 당일 레버리지를 실시간으로 자동 계산합니다.
- 유리할때 더 들어가고, 불리할때 적게 들어갑니다.
- 자산대비로 작동하는 복리 전략입니다.
손절로 리스크를 더욱 낮췄습니다.
- 당일 추세가 꺾였다고 판단하면 손절하여, 실시간 트레일링 스탑을 이용하여 급락에 대응합니다.
Leonardo Fibonacci DCA StrategyThis strategy consists of the following elements and can all be set by the user.
1. Enter as the price drops.
1) Selection of multi-time frame.
- 30 minutes
- 60 minutes
- 90 minutes
- More than 120 minutes
2) Selection of Order Count
- Order Count == Long entry's qty
3) Selection of First / End indent price gap
It is DCA (Dollar Cost Averaging)
- A DCA strategy is the practice of investing into a currency at preset intervals to reduce the entry price of a position over time and mitigate volatility risk.
For example,
1) Entry Time Frame = 60 minutes
2) Order Count = 10
3) First indent price = 2 %
End indent price = 10 %
=> Starting from a 1% drop in the 60 minutes candle,
10time Long Entry(1%, 2%, 3%, 4%, 5%, 6%, 7%, 8%, 9%, 10%)
thereby getting a better average price for your position and greatly reducing risks from the consequences of volatility .
2. Target Price and Stop Loss
1) Target price : uses the Fibonacci ratio. You can also set the target ratio.
2) Stop Loss : Long entry close when the moving average line cross under the End indent price.
3) Close Deal time : Long entry close after a set period of time has passed since long entry.
You can easily find out what's related by changing the setting value after setting the strategy.
I hope it will help you. Thank you.

money managementthis indicator has been designed to make your calculations easier and faster.
you can use this indicator to set tp and sl prices based on your entry price, balance,risk and leverage.
it has been designed only for cryptocurrency market and it is not recommended to use it in other markets!
1- enter your balance in the setting of the indicator.
2- enter risk percentage of your balance.
3- enter your sl percentage.
4- enter your tp percentage.
5- set your leverage if you are trading in futures market.
6- and at last set your entry price.
your position size both in spot market and futures market and the exact price of tp and sl , will be shown top right of the screen.
caution: before using this indicator in real market, please make sure that you understand this indicator's behavior and test it.
--------------------------------------------------------------------
این اندیکاتور برای تسریع محاسبات مدیریت سرمایه و سهولت رعایت آن طراحی شده است.
شما میتوانید با وارد کردن پارامترهاقیمت ورودی، سرمایه کل، ریسک و اهرم، قیمت حد سود و ضرر خود را محاسبه کنید.
همچنین اندازه حجم معاملات شما توسط این اندیکاتور محاسبه خواهد شد.
این اندیکاتور برای بازار کریپتوکارنسی طراحی شده است و استفاده از آن در سایر بازارها پیشنهاد نمیشود.
از بخش تنظیمات اندیکاتورمراحل زیر را انجام دهید:
1- میزان سرمایه خود را در قسمت بالانس وارد کنید
2- میزان ریسک سرمایه در هر معامله را مشخص کنید (به درصد)
3- میزان حد ضرر خود را مشخص کنید (به درصد)
4- میزان حد سود خود را مشخص کنید (به درصد)
5- عدد اهرم خود را وارد کنید
6- قیمت ورود به معامله را وارد کنید
توجه: قبل از استفاده این اندیکاتور در بازار لایو لطفا آن را تست کنید و از کارکرد صحیح آن با مدیریت سرمایه خود اطمینان حاصل فرمایید.

MM ATR Risk CalculatorBased on the NNFX Lot size position calculations MoneyMovesInvestments would like to provide to you the Free MM Atr Risk calculator
Directions are simple
Tells you the Atr value
Stop loss in pips
You can enter your account size
Based on your account size, enter the percent you want to risk
then the calculator will tell you your stop loss in pips based on current market and your lot size based on the account size and percent you want to risk
Check us out for your other trading needs
Link below or PM us for access to our other indicators
Happy Trading

Position calcCurrent script was created to help faster calculate possible gain or loss from a furure trade. Making money management a bit simpler, by changing values you can adjust proper trade leverage and see possible target values

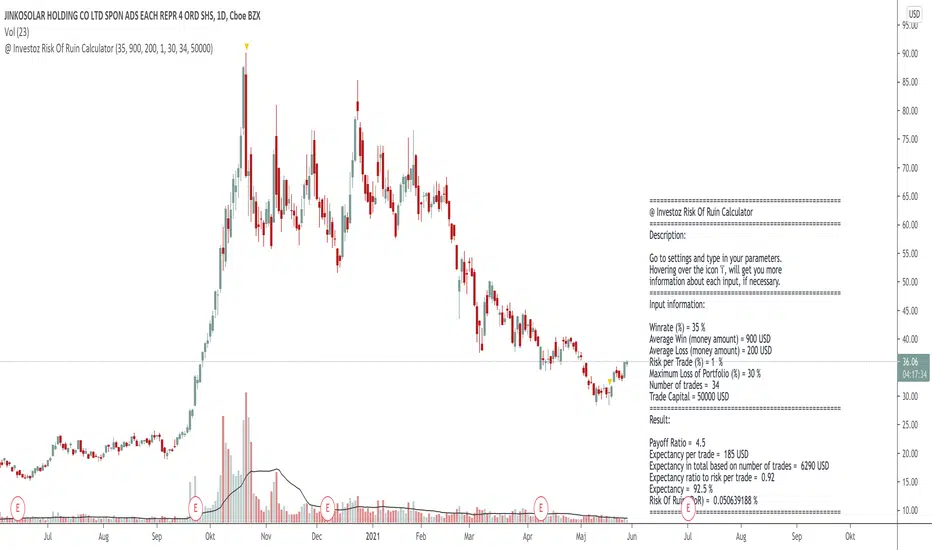
@ Investoz Risk Of Ruin CalculatorWhat is risk of ruin?
The risk of ruin is a statistical concept that matches the probability that you reach the point where it is no longer possible to recover the losses or continue. Please note that this is not the total capital in your account, as you should NEVER risk 100% of your capital.
Ideally, you should be prepared to risk 25-30% of your account as a MAXIMUM breakpoint before you need to stop trading. If that maximum is reached, review your trading plan for new goals and risk settings to determine if you can continue trading and then develop a new plan. You should never have a drawdown of 50% or more, because then you have to get 100% return, just for breaking even!
Considering that new traders are highly risk averse and have no idea of how much risk they can afford to take for each trade, they most likely end up blowing up their account. They probably did not wanted to see it as a possibility, just saw the opportunity to earn money.
Therefore, risk management is one of the key points a trader need to know well, to avoid reaching our point of destruction. This is what allows you to survive and stay in the game in order to have a greater chance of making money in the markets. Every trader must therefore calculate their chances of reaching this drawdown level. Simply put, the more you risk per trade, the more you increase the risk of destruction. So the easiest way to avoid the risk of ruin is to risk only a small portion of your account on each trade. Risk should never exceed 1-2% of the account per trade (preferably less) otherwise that path to point of destruction is where you are heading.
It is obviously not possible for a trader to make money without taking some risk, but it is imperative that he / she knows what his / her risk is and that he / she is prepared to take it. If a trader is not willing to take risks on his / her trading account, trading is not for him / her, it's that simple.
How the Risk Of Ruin Calculator works
You need to know a few things before you can use this calculator. You need to manually go to the indicator settings and make a few inputs over following:
(If you use a pine script strategy, you have all the info you need. Go to "Strategy Tester" and then "Performance Summary").
Inputs
Win rate = How profitable your strategy is in % terms.
Average win = Average winning trade, in money terms.
Average loss = Average losing trade, in money terms.
Risk per trade = How much risk of your portfolio you take at each trade.
Maximum Loss Of Portfolio = What is the total percentage loss of your portfolio that you can afford to risk before you stop trading.
Trade Capital = The total sum of your current trade capital.
Outputs
Payoff ratio = The payoff ratio is simply the system's average profit per trade divided by the average loss per trade.
Expectancy = Is the win rate of the strategy divided by payoff ratio.
Risk of ruin ( RoR ) = Risk of ruin is the probability of a strategy losing money, to the point where it is no longer possible to recover the losses or continue.
=============================================================================================================================================================
DISCLAIMER
Any data and information is provided 'as is' solely for informational purposes, and is not intended for trading purposes or advice. Past performance is not indicative of future results.
Educate yourself on the risks associated with trading, and seek advice from an independent financial or tax advisor if you have any questions.
=============================================================================================================================================================
Fixed price Stop Loss [Takazudo]This strategy is a demo for fixed price stop loss.
This strategy enables you to specify fixed price stop loss. Let's say your deposit is USD. When you trade EURCAD, you need to specify the quantity for trade. Here comes three chances for trade.
A: SL pips: 500
B: SL pips: 200
C: SL pips: 100
In these trade, the risk is different for each. ABC risk ratio is 5:2:1. And, you cannot know how much to lose if the price hits the stop loss. This is a huge problem.
With this strategy, You can specify the fixed risk price for each trade. If you specify 100 USD for the risk, this strategy calculates how much quantity to buy or sell for each entry. In the case above, this strategy guides you how much quantity to buy or sell like below.
A: 2,000 qty (SL: 500pips)
B: 5,000 qty (SL: 200pips)
C: 10,000 qty (SL: 100pips)
If you make entries with those quantity and the price hits the stop loss, You will lose the money like below.
A: 100 USD
B: 100 USD
C: 100 USD
This is what this script does. Fixed price SL.
I tested this caliculation for OANDA's main 28 currency pairs forex listed below.
AUDUSD, EURUSD, GBPUSD, NZDUSD, USDCAD, USDCHF, USDJPY, AUDCAD, AUDCHF, AUDJPY, AUDNZD, CADCHF, CADJPY, CHFJPY, EURAUD, EURCAD, EURCHF, EURGBP, EURJPY, EURNZD, GBPAUD, GBPCAD, GBPCHF, GBPJPY, GBPNZD, NZDCAD, NZDCHF, NZDJPY
I may add more pairs later.
Note: The entry strategy in this script is not intented to win. Check the result. Be careful.

Volume calculationHello friends
First let me say that my English is poor and I am using Google Translator 😬🙃🙃🙃
Secondly, this indicator is open source and its use is allowed in its indicator, but in order to play it, my name must be mentioned.
Well, let's go to the description of the indicator :
This indicator gives you the amount of purchasing volume in relation to the capital, the risk you trade and the stop loss.
And shows you the LRP
I hope you use the indicator well
Your pocket is full of money
Let me say that I am Iranian

MoneyMoves ALGOThe strategy works with the crossing of two moving averages, slope and basis line of the volatility bands.
when slope crosses up the basis line the signal is buy, when slope crosses down the base line it is sell
the volatility bands represent standard deviations, when the market is flattened it is consolidated
Show Break Out Support or Resistance Alarm
The supports and resistances are based on superior times, daily, weekly, and monthly.
suited has two alarms: one, when the high price breaks resistance or a low price, breaks support. and another when the close with volume breaks resistance or support, select the Volume Break Out S&R Back Period mode, and indicate periods behind the volume.
Back test section.
you can select a specific date for testing the strategy.
You also have the option of a money management, where you can put profits or losses both in buy or sell.
You can also select in the go long or go sell option if you want the system to only operate buy or sell

Trading RobinFull trading strategy for Stocks, Equity ETF’s, and Crypto. Not for FOREX or commodities.
Buy/Sell signals, and money management.
Low drawdown, consistent gains. Equity protection during crashes!
Long strategy for long term bullish assets. Best for Leveraged Long Equity ETF’s.
Trading Robin has also performed well on Crypto Assets such as BTCUSD, ETHUSD, and XRPUSD.
Made for daily charts, some markets perform better with 4 hour and 1 hour charts.
Always test all 3 time frames.
The main features of Trading Robin are:
Adjustable risk % per trade
Adjustable minimum % profit target per series of trades
Proprietary buy signals
Proprietary exit signals
The exact number of shares to buy per signal
The default inputs show great results on the assets listed below but they are also adjustable and may show better results if modified on certain assets so feel free to play around with them.
Some of the markets Trading Robin has been tested and performed well on are:
TQQQ
SPXL
SPX
SPY
TNA
UDOW
UPRO
UMDD
URTY
TSLA
AMZN
NFLX
ROKU
MSFT
FB
Even Crypto’s like:
BTCUSD
ETHUSD
XRPUSD
There are many more.
For access, send me a PM on TradingView.
Enjoy.

Musashi MTF Trend HeatMapThis indicator compliments the Musashi TrendBars and allows convenient multi time frame analysis.
This HeatMap, shows 5 different time zones, each with color codes to indicate the trend expression of a corresponding timeframe.
- Dark Green = Good Uptrend (ok to enter short)
- Light Green = Uptrend but it can be exhausted (put in protective stops)
- Cyan = In Bull Trend but pulling back (be careful, maybe put in protective stops)
- Dark Red = Good Downtrend (ok to enter short)
- Orange = Downtrend but it can be exhausted (put in protective stops)
- Magenta = In Bear Trend but pulling back (be careful, maybe put in protective stops)
The dark grey markers on the Heat Map show when markets are not having strong trends.
*If you wish to license this indicator, please contact me via private message for details regarding access. Thank you.
LEGAL STUFF:
Risk Disclosure
Futures , forex, stock, crypto and derivative trading contains substantial risk and is not for every investor. An investor could potentially lose all or more than the initial investment. Risk capital is money that can be lost without jeopardizing ones’ financial security or life style. Only risk capital should be used for trading and only those with sufficient risk capital should consider trading. Past performance is not necessarily indicative of future results
Hypothetical Performance Disclosure
Hypothetical performance results have many inherent limitations, some of which are described below. no representation is being made that any account will or is likely to achieve profits or losses similar to those shown; in fact, there are frequently sharp differences between hypothetical performance results and the actual results subsequently achieved by any particular trading program. One of the limitations of hypothetical performance results is that they are generally prepared with the benefit of hindsight. In addition, hypothetical trading does not involve financial risk, and no hypothetical trading record can completely account for the impact of financial risk of actual trading. for example, the ability to withstand losses or to adhere to a particular trading program in spite of trading losses are material points which can also adversely affect actual trading results. There are numerous other factors related to the markets in general or to the implementation of any specific trading program which cannot be fully accounted for in the preparation of hypothetical performance results and all which can adversely affect trading results

Two Take Profits and Two Stop LossThis script is for research purposes only. I am not a financial advisor.
Entry Condition
This strategy is based on two take profit targets, two stop loss, and scaling out strategy. The entry rule is very simple. Whenever the EMA crossover WMA, the long trade is taken and vice versa.
Take Profit and Stop Loss
The first take profit is set at 20 pips above the long entry and the second take profit is set at 40 pips above the long entry. Meanwhile, the first stop loss is set at 20 pips below the long entry and the second stop loss is set at the long entry.
Money Management
When the first take profit is achieved, half of the position is closed and the first stop loss is moved to the entry-level. The rest of the position is open to achieve either second take profit or second stop loss.
There are three outcomes when using this strategy. Let's say you enter the trade with 200 lot size and you are risking 2% of your equity.
1. The first outcome is when the price hits stop loss, you lose the entire 2%.
2. The second outcome is when the price hits the first take profit and you close half of your position. Meaning that you have gained 1%. Then you let the trade running and eventually it hits the second stop loss. Remember your first stop loss has changed to the second stop loss when the first take profit is achieved. The total loss is 0% because the price is at your entry-level. You have gained the earlier 1% and then lost 0%. At this point, you are at 1% gained.
3. The third outcome is similar to the second out but instead of hitting the second stop loss, the trade is running to your favor and hits the second take profit.
Therefore, you gained 1% from the first take profit and you gained another 2% for the second take profit. Your total gained is 3%
Summary
The reason behind this strategy is to minimize risk. with normal strategy, you only have two outcomes which are either win or loss. With this strategy, you have three outcomes which win 3%, win 1%, or loss 2%.
This is my similar strategy but with single stop loss

Two Take Profit StrategyThis script is for research purposes only. I am not a financial advisor.
Entry Condition
This strategy is based on two take profit targets and scaling out strategy. The entry rule is very simple. Whenever the EMA crossover WMA, the long trade is taken and vice versa.
Take Profit and Stop Loss
The first take profit is set at 20 pips above the long entry and the second take profit is set at 40 pips above the long entry. Meanwhile, the stop loss is set at 20 pips below the long entry.
Money Management
When the first take profit is achieved, half of the position is closed. The rest of the position is open to achieve either second take profit or stop loss.
There are three outcomes when using this strategy. Let's say you enter the trade with 200 lot size and you are risking 2% of your equity.
1. The first outcome is when the price hits stop loss, you lose the entire 2%.
2. The second outcome is when the price hits the first take profit and you close half of your position. Meaning that you have gained 1%. Then you let the trade running and eventually it hits stop loss. The total loss is 0% because the remaining lot size which is 200/2=100 times by 20pips is 1%. You have gained the earlier 1% and then loss 1%. At this point, you are at break even.
3. The third outcome is similar to the second out but instead of hiring stop loss, the trade is running to your favor and hits the second take profit.
Therefore, you gained 1% from the first take profit and you gained another 2% for the second take profit. Your total gained is 3%
Summary
The reason behind this strategy is to minimize risk. with normal strategy, you only have two outcomes which are either win or loss. With this strategy, you have three outcomes which are win, loss or break even.
