KD-NewAutoTrade for Future Trading - Heikin Ashi candles The KD-NewAutoTrade strategy is a dynamic trend-following indicator designed for scalping and swing trading across crypto, forex, and index futures. It combines the precision of EMA crossovers, RSI momentum, and ADX trend strength to deliver clear Buy/Sell signals with high reliability.
🔹 Core Logic
EMA Fast & Slow Crossover – Identifies short-term and long-term trend shifts.
RSI Confirmation – Filters out false signals by requiring RSI to cross custom Buy/Sell thresholds.
ADX Filter – Ensures trades only trigger when market trend strength exceeds your chosen ADX minimum.
🔹 Key Features
Visual Buy/Sell triangles directly on the chart.
Customizable inputs for EMA, RSI, and ADX lengths.
Works efficiently on all timeframes and all markets (Crypto, Indices, Stocks, Commodities).
Optional background highlights for active trade zones.
Alert conditions for both BUY and SELL setups – ready to use in automated strategies or alert bots.
🔹 Recommended Usage
Use Heikin Ashi candles
Works best on 1M - 5M timeframes.
Combine with volume or higher-timeframe trend confirmation for stronger signals.
ממוצעים נעים


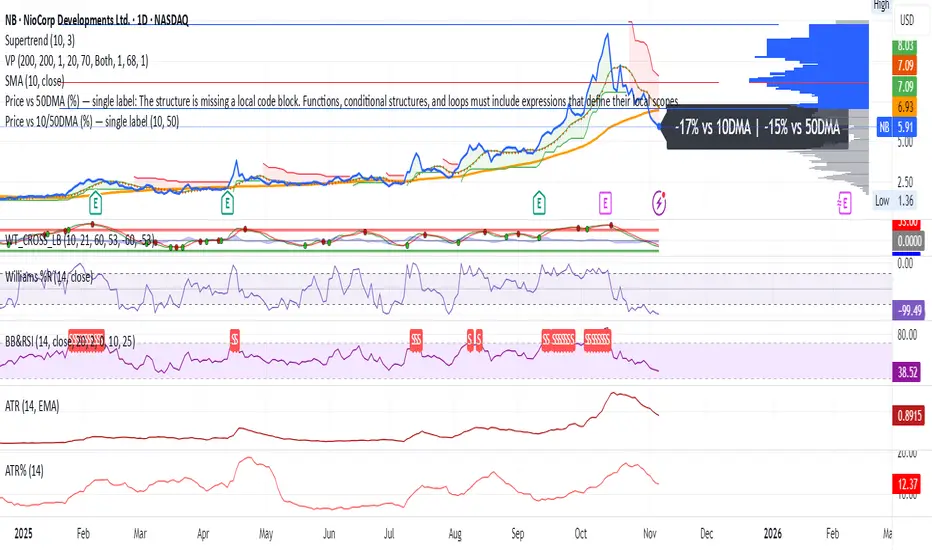
Price vs 10/50DMA (%) — single labelThis TradingView script shows how far the current price is from its 10-day and 50-day moving averages (DMAs), expressed as percentages, and displays both values as a single label near the latest candle — for example, “+3% vs 10DMA | +8% vs 50DMA.” You can switch between simple and exponential moving averages using the “Use EMA” checkbox, and adjust the period lengths in the input panel. To use it, simply copy the code into TradingView’s Pine Editor, click Add to chart, and you’ll see one live label updating each bar along with the plotted 10- and 50-day average lines.
Henry's MA & RSProviding 10 21 50 200 MA and RS rating based on S&P 500, basically for US stocks. Enjoy!

CDC BACKTEST (MACD) FIX AMOUNT $200k per trade This strategy implements an Exponential Moving Average (EMA) Crossover System designed for backtesting and performance evaluation. EMA 12,26 (MACD)
The trading logic is based on the crossover between two EMAs — a short-term EMA (12) and a long-term EMA (26) — which serves as a momentum-based signal for trend identification.
Buy Condition:
A long (buy) position is entered when the 12-period EMA crosses above the 26-period EMA, indicating a potential upward trend or bullish momentum.
Sell Condition:
A position is closed, or a short (sell) position is opened, when the 12-period EMA crosses below the 26-period EMA, signaling a potential downward trend or bearish momentum.
Position Sizing:
Each trade with a fixed position size of 200,000 USD (default), while the starting account balance is set at 400,000 (USD).
Both the fixed trade amount and the initial balance are user-adjustable parameters, allowing flexibility for different risk preferences and portfolio sizes.

TFX AVERAGESThis indicator created by TFX features the EMA's of 5, 10, 20, 50, 200. These indicators will show the averages of candles.

dO / wO / mO + MA 50/200 + PrevDay H/L Description
This indicator plots key reference levels used by professional traders:
Daily Open (dO)
Weekly Open (wO)
Monthly Open (mO)
Previous Day High (pdH) and Previous Day Low (pdL)
Moving Averages: 50 & 200 SMA
Each level is drawn as a clean dotted white line with a fixed label directly on the price chart.
All levels can be individually toggled on or off via checkboxes in the settings panel.
The pdH/pdL lines start exactly from the candles that created them, providing clear structure for breakout, retracement, and liquidity analysis.
The 50/200 SMA are included for long-term trend context.
This tool is designed for traders who rely on multi-timeframe structure and precision levels for both intraday and swing strategies.
Features
Toggle visibility for dO, wO, mO, pdH, and pdL
Accurate placement of previous day levels
Lightweight and responsive
Clean minimal visual design
Supports any symbol and timeframe
Usage Notes
Perfect for confluence-based trading:
Combine pdH/pdL with session opens to identify key liquidity zones
Use SMA 50/200 for directional bias
Works on crypto, forex, indices, and equities

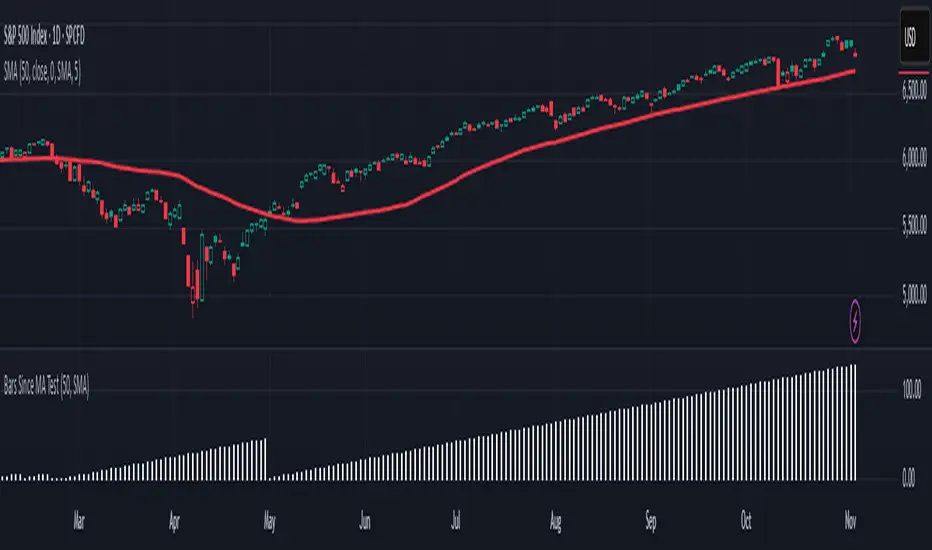
Is it Time for a Pullback? Check Bars Since MA TestAn old market adage declares that “prices never move in a straight line.” Dips occur even in bullish markets. But how can traders know when prices may be due for a pullback?
Today’s script tries to answer that question by asking how many bars have passed since a stock, index or other symbol has tested a given moving average. Long periods of time without touching a line such as the 50-day simple moving average, for example, could prompt traders to be more patient.
Bars Since MA Test counts how many bars have passed since prices touched or crossed the MA in question. The resulting value is plotted in a simple histogram. Users can set the MA length and type. By default, it uses the 50-day simple moving average (SMA).
The chart above applies Bars Since MA Test to the S&P 500. It shows that the index has gone 129 bars without testing its 50-day SMA. That’s the longest since a 146-bar stretch between July 2006 and February 2007.
Other longer runs include January-August 1995 (156 bars), November 1960-June 1961 (144 bars) and April-November 1958 (158 bars).
Given the small number of comparable readings, could traders suspect the current advance is getting long in the tooth?
TradeStation has, for decades, advanced the trading industry, providing access to stocks, options and futures. If you're born to trade, we could be for you. See our Overview for more.
Past performance, whether actual or indicated by historical tests of strategies, is no guarantee of future performance or success. There is a possibility that you may sustain a loss equal to or greater than your entire investment regardless of which asset class you trade (equities, options or futures); therefore, you should not invest or risk money that you cannot afford to lose. Online trading is not suitable for all investors. View the document titled Characteristics and Risks of Standardized Options at www.TradeStation.com . Before trading any asset class, customers must read the relevant risk disclosure statements on www.TradeStation.com . System access and trade placement and execution may be delayed or fail due to market volatility and volume, quote delays, system and software errors, Internet traffic, outages and other factors.
Securities and futures trading is offered to self-directed customers by TradeStation Securities, Inc., a broker-dealer registered with the Securities and Exchange Commission and a futures commission merchant licensed with the Commodity Futures Trading Commission). TradeStation Securities is a member of the Financial Industry Regulatory Authority, the National Futures Association, and a number of exchanges.
TradeStation Securities, Inc. and TradeStation Technologies, Inc. are each wholly owned subsidiaries of TradeStation Group, Inc., both operating, and providing products and services, under the TradeStation brand and trademark. When applying for, or purchasing, accounts, subscriptions, products and services, it is important that you know which company you will be dealing with. Visit www.TradeStation.com for further important information explaining what this means.
Ultimate Scalping IndicatorOverview
The Confluence Signal Indicator is a precision-built scalping tool designed to identify high-probability reversal points in the market.
It combines three core technical elements:
Trend
Mean reversion
Momentum
into a single, efficient system.
By filtering out weak RSI signals and focusing only on setups that align with trend direction and recent momentum shifts, this indicator delivers cleaner and more accurate short-term trade signals.
Core Components
200-Period Moving Average (MA200, 5-Minute Timeframe)
The MA200 is always calculated from the 5-minute chart, regardless of your current timeframe. It defines the macro trend direction and ensures that all trades align with the prevailing momentum.
Session VWAP (Volume-Weighted Average Price)
The VWAP tracks the real-time average price weighted by volume for the current trading session. It acts as a dynamic mean-reversion level and helps identify key areas of institutional activity and short-term balance.
RSI (Relative Strength Index)
The indicator uses a standard 14-period RSI to detect overbought and oversold market conditions.
A “recency filter” is added to ensure signals only appear when RSI has recently transitioned from strength to weakness or vice versa, reducing false signals in trending markets.
Signal Logic
Bullish Signal (Green Arrow)
A bullish reversal signal is plotted below a candle when:
Price is above both the 5-minute MA200 and the Session VWAP.
RSI is oversold (below 30).
The last time RSI was above 50 occurred within the last 10 candles before going oversold.
This ensures that the dip is a fresh pullback within an uptrend, not a prolonged oversold condition.
Bearish Signal (Red Arrow)
A bearish reversal signal is plotted above a candle when:
Price is below both the 5-minute MA200 and the Session VWAP.
RSI is overbought (above 70).
The last time RSI was below 50 occurred within the last 10 candles before going overbought.
This ensures that the overbought reading follows a recent move from weakness, identifying potential short entries in a downtrend.
Recommended Usage
This is a scalping-focused indicator, intended for use on timeframes of 5 minutes or lower. Therefore I would highly recommend to use it on Equity futures trading, such as NQ!, ES!, GC! and so on.
It performs best when combined with additional tools such as support and resistance zones, order blocks, or liquidity levels for context.
Avoid counter-trend signals unless confirmed by price structure or volume behavior.

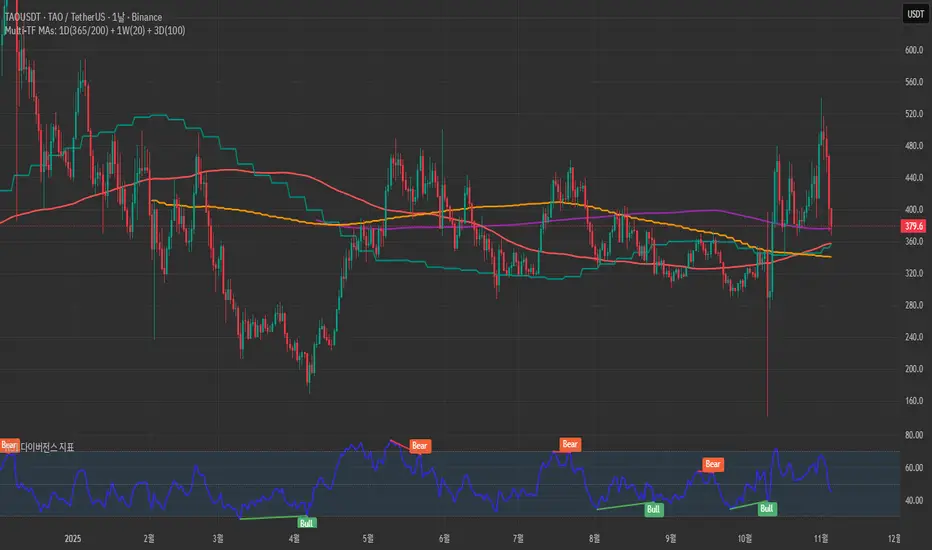
Golden Flow MapGolden Flow Map is a multi–timeframe moving–average system
designed to reveal the underlying direction of long–term market flow,
beyond daily volatility or short–term signals.
This script overlays four major trend lines — each representing a different layer of market rhythm:
Timeframe Length Meaning
🟣 1D – 365 MA Annual average — the true life line of the trend
🔴 1D – 200 MA Institutional benchmark — the long-term threshold
🟢 1W – 20 MA Mid-cycle momentum guide
🟠 3D – 100 MA Wave transition detector — captures trend shifts early
By combining these four perspectives on a single chart,
you can instantly distinguish between a short-term bounce and a major trend reversal.
🧭 How to Use
When all four lines align in one direction → that’s the main current of the market.
If price loses the 200D or 365D, ignore small rebounds — the structure has shifted.
The cross between Weekly 20 and 3D 100 often marks a wave transition.
Focus on alignment order rather than crossovers —
markets ultimately return to the direction of the higher timeframe.
⚙️ Features
SMA / EMA toggle
Individual MA on/off controls
Built-in alerts for 200D and 1W20 cross events
🧠 Concept
“Indicators are not signals — they are maps.”
This tool is not meant to predict, but to reveal the pulse of the market
and guide you through its long-term structure.
✍️ Creator’s Note
Developed from DDU’s personal long-term trend framework,
this indicator serves as a visual compass to expand a trader’s vision
from short-term reactions to macro-level flow.
MACD Overlay v1 [JopAlgo]Meet the MACD you can trade directly from the chart.
MACD Overlay v1 doesn’t just plot an oscillator somewhere below—
it puts value, momentum, and participation on your candles, and it refuses to fire inside chop.
When a triangle prints, it’s because energy released (expansion), not because the chart looked cute.
What it is:
An execution-ready MACD overlay with phase gating (Expansion-Only), participation gating (Weakness-Lite), and one-click Classic vs VW-MACD Compare—all adaptive, with minimal inputs.
What’s in v1 (feature set)
Overlay ribbon on price: Fast/Slow MACD value rendered as a price-level ribbon with contextual fill and optional candle tint.
Dual value model: Classic MA-MACD (EMA/SMA) and VW-MACD (Rolling VWAP fast/slow).
Compare mode: A/B Classic vs VW-MACD with a VW ghost ribbon.
Weakness-Lite (1-bar, adaptive): Gates/fades low-participation crosses using
RVOL deficit, Effort-vs-Result failure, and over-extension vs value/ATR (Strict adds wick pressure).
Expansion-Only (Impulse/Squeeze): Triangles print only when a cross coincides with a true-range burst and a histogram-slope ignition out of compression.
Signal hygiene: ±1-bar proximity around crosses, slope awareness, 2-bar debounce.
Explainable filtering: Tiny gray dots show crosses that were intentionally filtered (weak and/or no expansion).
How to use:
Use defaults: Mode Classic, Gate by Weakness ON, Expansion-Only ON, Sensitivity Auto.
Read signals fast:
Solid triangle = cross + expansion confirmed (+ not weak if gate is ON).
Faded triangle = cross + expansion but weak participation (visible only when gate is OFF).
Gray dot = there was a cross, but it was filtered (no genuine expansion or weak & gated).
Validate quickly: Flip Compare to check VW-MACD agreement. Classic + VW alignment usually improves confidence.
Why overlay > sub-pane oscillator
You see where the cross occurs: relative to value, local structure, and S/R, right on price.
The ribbon exposes regime shifts; tint hints expansion vs contraction at a glance.
Execution becomes more context-aware and less “signal-in-a-vacuum.”
Signals & visuals
Triangles (solid): MACD crossed Signal and market showed expansion out of compression; if Gate by Weakness is ON, triangle prints only with acceptable participation.
Triangles (faded): Same as above but weak (shown only when you turn the gate OFF).
Gray dots: Crosses that were filtered (no expansion and/or Weakness gate).
Ribbon: Fast vs Slow value (Classic or VW, according to Mode). Fill and candle tint reflect expansion/contraction.
Inputs
Calculation Mode: Classic | VW | Compare
VW uses Rolling VWAP fast/slow.
Compare: Classic is primary; VW shows as a ghost ribbon for A/B checks.
Gate triangles by Weakness: ON/OFF
Uses RVOL, Effort-vs-Result, extension vs value/ATR (Strict adds wick-pressure).
Sensitivity: Off / Auto / Strict (default Auto).
Expansion-Only (Impulse/Squeeze): ON/OFF
Requires compression → release: tight ribbon + flat momentum, then TR/ATR burst with hist slope flip / cross proximity.
Display: Ribbon / Candle Tint / Weakness Markers.
Advanced (optional): Evaluate Weakness only near signals, Channel (k × |MACD|), Style Preset.
No numeric thresholds to tune—all filters self-calibrate from rolling stats.
Best practices
4H crypto: Defaults are strong—Auto, Gate ON, Expansion-Only ON.
Clean trends: If you feel you miss some tidy resumptions, briefly toggle Expansion-Only OFF.
Choppy regimes: Set Sensitivity → Strict to cut more noise without adding lag.
Confirmation: Use Compare; Classic + VW alignment typically yields better follow-through.
Alerts
MACD Signal Cross Up/Down — execution-grade (use Once per bar close).
Weakness-Lite Flag — optional context alert to help audit filtered crosses.
Attribution & License
Attribution: Based on the algorithmic concept of TradingView’s built-in MACD (fast MA – slow MA, signal, histogram).
No original TradingView source code is redistributed; overlay rendering, VW-MACD, Weakness-Lite, Expansion-Only, gating visuals, and UX are new work.
License: MPL-2.0. Educational purposes only—not financial advice.

Mustang Algo - Engulfing Detector🐎 MUSTANG ALGO - ENGULFING DETECTOR
An advanced engulfing candlestick pattern detector with customizable filters for more precise trading signals.
═══════════════════════════════════════
📊 WHAT IS THIS INDICATOR?
The Mustang Algo Engulfing Detector identifies bullish and bearish engulfing patterns with advanced filtering options to reduce false signals and improve trade quality. This indicator helps traders spot high-probability reversal opportunities based on candlestick patterns and trend confirmation.
═══════════════════════════════════════
✨ KEY FEATURES
🔹 Engulfing Pattern Detection
• Bullish Engulfing: Identifies potential bullish reversals
• Bearish Engulfing: Identifies potential bearish reversals
• Real-time signal labels (BUY/SELL)
🔹 Size Filter
• Filter out small, insignificant candles
• Adjustable minimum body size percentage
• Optional filter for the engulfed candle size
• Ensures only strong patterns are detected
🔹 EMA Trend Filter
• Customizable EMA period (default: 200)
• BUY signals only above EMA (uptrend)
• SELL signals only below EMA (downtrend)
• Visual EMA line on chart
• Reduces counter-trend false signals
═══════════════════════════════════════
🎯 HOW TO USE
1. Add the indicator to your chart
2. Adjust the filters according to your trading style
3. Wait for BUY (green) or SELL (red) labels
4. Confirm with your own analysis and risk management
5. Trade in the direction of the signal
⚠️ IMPORTANT: This indicator should be used in conjunction with proper risk management and additional analysis. No indicator is 100% accurate.
═══════════════════════════════════════
⚙️ CUSTOMIZABLE SETTINGS
📏 Size Filter Group:
• Enable/Disable size filtering
• Min Body Size (%): Minimum candle body size to generate signals (0.01% - 10%)
• Check Engulfed Candle Size: Also verify the size of the engulfed candle
• Min Engulfed Body Size (%): Minimum size for the engulfed candle
📈 EMA Filter Group:
• Enable/Disable EMA filtering
• EMA Length: Period for the EMA calculation (default: 200)
• Show EMA on Chart: Display the EMA line
═══════════════════════════════════════
💡 BEST PRACTICES
✅ Use on higher timeframes (4H, Daily) for better reliability
✅ Combine with support/resistance levels
✅ Wait for candle close confirmation before entering
✅ Use proper stop-loss and take-profit levels
✅ Consider market context and overall trend
❌ Don't trade every signal blindly
❌ Don't ignore risk management
❌ Don't use on very low timeframes without additional filters
═══════════════════════════════════════
📈 RECOMMENDED SETTINGS
Conservative Trading:
• Min Body Size: 0.8% - 1.0%
• EMA Filter: Enabled (200 period)
• Check Engulfed Size: Enabled
Aggressive Trading:
• Min Body Size: 0.3% - 0.5%
• EMA Filter: Disabled or lower period (50-100)
• Check Engulfed Size: Disabled
═══════════════════════════════════════
🔒 DISCLAIMER
This indicator is provided for educational and informational purposes only. Past performance is not indicative of future results. Always conduct your own research and use proper risk management. Trading involves substantial risk of loss.
═══════════════════════════════════════
Created by Mustang Algo
Version 1.0
If you find this indicator helpful, please leave a like and comment! 🚀

(Mustang Algo) Trend 5/15/30/1H + EMA Lines + Aligned Signal═══════════════════════════════════════════════════════════
MUSTANG ALGO - MULTI-TIMEFRAME TREND ALIGNMENT
═══════════════════════════════════════════════════════════
📊 OVERVIEW:
This indicator analyzes trend alignment across four key timeframes (5m, 15m, 30m, 1H) using customizable moving averages. It helps traders identify high-probability setups when multiple timeframes confirm the same trend direction.
🎯 KEY FEATURES:
✓ Multi-Timeframe Analysis (5m/15m/30m/1H)
- Monitors trend direction on 4 different timeframes simultaneously
- Visual table showing real-time trend status for each period
- Optional price display for each timeframe
✓ Flexible Moving Average System
- Choose from 5 MA types: EMA, SMA, SMMA (RMA), WMA, VWMA
- Customizable Fast MA (default: 20) and Slow MA (default: 50)
- Visual cloud between moving averages (green=bullish, red=bearish)
✓ Alignment Signals
- "4x UP" triangle: All 4 timeframes bullish (strong uptrend)
- "4x DOWN" triangle: All 4 timeframes bearish (strong downtrend)
- Signals appear only when ALL timeframes agree
✓ Visual Enhancements
- MA cloud with transparency for better chart readability
- Optional candle coloring based on local trend
- Clean, customizable dashboard display
✓ Alert System
- Built-in alerts for bullish alignment (4 TF aligned up)
- Built-in alerts for bearish alignment (4 TF aligned down)
- Perfect for automated trading setups
📈 HOW TO USE:
1. **Trend Confirmation**: Wait for alignment signals (triangles) before entering trades
2. **Dashboard Monitoring**: Check the top-right table to see individual TF trends
3. **MA Cloud**: Use the cloud as dynamic support/resistance
4. **Entry Timing**: Enter on local timeframe when higher TFs are aligned
⚙️ CUSTOMIZABLE PARAMETERS:
- Fast MA Length (default: 20)
- Slow MA Length (default: 50)
- MA Type (EMA/SMA/SMMA/WMA/VWMA)
- Toggle dashboard display
- Toggle price display in dashboard
- Toggle MA cloud
- Toggle candle coloring
⚠️ BEST PRACTICES:
- Use on 5m or 15m charts for optimal multi-TF analysis
- Combine with price action and volume for best results
- Alignment signals are rare but highly significant
- Not a standalone system - use as confluence tool
💡 STRATEGY IDEAS:
- Scalping: Enter on local TF when all TFs aligned
- Swing Trading: Hold positions while alignment maintained
- Risk Management: Exit if alignment breaks
- Confluence: Combine with support/resistance levels
📌 NOTES:
- Works on all markets (Crypto, Forex, Stocks, Indices)
- Repaints minimally (only on MA calculations)
- Low resource usage, efficient code
═══════════════════════════════════════════════════════════
Created by Mustang Spirit Trading Academy
For educational purposes - Always manage your risk!
═══════════════════════════════════════════════════════════

Machine Learning Moving Average [BackQuant]Machine Learning Moving Average
A powerful tool combining clustering, pseudo-machine learning, and adaptive prediction, enabling traders to understand and react to price behavior across multiple market regimes (Bullish, Neutral, Bearish). This script uses a dynamic clustering approach based on percentile thresholds and calculates an adaptive moving average, ideal for forecasting price movements with enhanced confidence levels.
What is Percentile Clustering?
Percentile clustering is a method that sorts and categorizes data into distinct groups based on its statistical distribution. In this script, the clustering process relies on the percentile values of a composite feature (based on technical indicators like RSI, CCI, ATR, etc.). By identifying key thresholds (lower and upper percentiles), the script assigns each data point (price movement) to a cluster (Bullish, Neutral, or Bearish), based on its proximity to these thresholds.
This approach mimics aspects of machine learning, where we “train” the model on past price behavior to predict future movements. The key difference is that this is not true machine learning; rather, it uses data-driven statistical techniques to "cluster" the market into patterns.
Why Percentile Clustering is Useful
Clustering price data into meaningful patterns (Bullish, Neutral, Bearish) helps traders visualize how price behavior can be grouped over time.
By leveraging past price behavior and technical indicators, percentile clustering adapts dynamically to evolving market conditions.
It helps you understand whether price behavior today aligns with past bullish or bearish trends, improving market context.
Clusters can be used to predict upcoming market conditions by identifying regimes with high confidence, improving entry/exit timing.
What This Script Does
Clustering Based on Percentiles : The script uses historical price data and various technical features to compute a "composite feature" for each bar. This feature is then sorted and clustered based on predefined percentile thresholds (e.g., 10th percentile for lower, 90th percentile for upper).
Cluster-Based Prediction : Once clustered, the script uses a weighted average, cluster momentum, or regime transition model to predict future price behavior over a specified number of bars.
Dynamic Moving Average : The script calculates a machine-learning-inspired moving average (MLMA) based on the current cluster, adjusting its behavior according to the cluster regime (Bullish, Neutral, Bearish).
Adaptive Confidence Levels : Confidence in the predicted return is calculated based on the distance between the current value and the other clusters. The further it is from the next closest cluster, the higher the confidence.
Visual Cluster Mapping : The script visually highlights different clusters on the chart with distinct colors for Bullish, Neutral, and Bearish regimes, and plots the MLMA line.
Prediction Output : It projects the predicted price based on the selected method and shows both predicted price and confidence percentage for each prediction horizon.
Trend Identification : Using the clustering output, the script colors the bars based on the current cluster to reflect whether the market is trending Bullish (green), Bearish (red), or is Neutral (gray).
How Traders Use It
Predicting Price Movements : The script provides traders with an idea of where prices might go based on past market behavior. Traders can use this forecast for short-term and long-term predictions, guiding their trades.
Clustering for Regime Analysis : Traders can identify whether the market is in a Bullish, Neutral, or Bearish regime, using that information to adjust trading strategies.
Adaptive Moving Average for Trend Following : The adaptive moving average can be used as a trend-following indicator, helping traders stay in the market when it’s aligned with the current trend (Bullish or Bearish).
Entry/Exit Strategy : By understanding the current cluster and its associated trend, traders can time entries and exits with higher precision, taking advantage of favorable conditions when the confidence in the predicted price is high.
Confidence for Risk Management : The confidence level associated with the predicted returns allows traders to manage risk better. Higher confidence levels indicate stronger market conditions, which can lead to higher position sizes.
Pseudo Machine Learning Aspect
While the script does not use conventional machine learning models (e.g., neural networks or decision trees), it mimics certain aspects of machine learning in its approach. By using clustering and the dynamic adjustment of a moving average, the model learns from historical data to adjust predictions for future price behavior. The "learning" comes from how the script uses past price data (and technical indicators) to create patterns (clusters) and predict future market movements based on those patterns.
Why This Is Important for Traders
Understanding market regimes helps to adjust trading strategies in a way that adapts to current market conditions.
Forecasting price behavior provides an additional edge, enabling traders to time entries and exits based on predicted price movements.
By leveraging the clustering technique, traders can separate noise from signal, improving the reliability of trading signals.
The combination of clustering and predictive modeling in one tool reduces the complexity for traders, allowing them to focus on actionable insights rather than manual analysis.
How to Interpret the Output
Bullish (Green) Zone : When the price behavior clusters into the Bullish zone, expect upward price movement. The MLMA line will help confirm if the trend remains upward.
Bearish (Red) Zone : When the price behavior clusters into the Bearish zone, expect downward price movement. The MLMA line will assist in tracking any downward trends.
Neutral (Gray) Zone : A neutral market condition signals indecision or range-bound behavior. The MLMA line can help track any potential breakouts or trend reversals.
Predicted Price : The projected price is shown on the chart, based on the cluster's predicted behavior. This provides a useful reference for where the price might move in the near future.
Prediction Confidence : The confidence percentage helps you gauge the reliability of the predicted price. A higher percentage indicates stronger market confidence in the forecasted move.
Tips for Use
Combining with Other Indicators : Use the output of this indicator in combination with your existing strategy (e.g., RSI, MACD, or moving averages) to enhance signal accuracy.
Position Sizing with Confidence : Increase position size when the prediction confidence is high, and decrease size when it’s low, based on the confidence interval.
Regime-Based Strategy : Consider developing a multi-strategy approach where you use this tool for Bullish or Bearish regimes and a separate strategy for Neutral markets.
Optimization : Adjust the lookback period and percentile settings to optimize the clustering algorithm based on your asset’s characteristics.
Conclusion
The Machine Learning Moving Average offers a novel approach to price prediction by leveraging percentile clustering and a dynamically adapting moving average. While not a traditional machine learning model, this tool mimics the adaptive behavior of machine learning by adjusting to evolving market conditions, helping traders predict price movements and identify trends with improved confidence and accuracy.

Yit's SMA'sThis is the first update to my original SMA indicators I've added the following:
10 Week SMA
40 Week SMA
3 Month SMA
18 Month SMA
I wanted to add more based on these being common indicators various types of trading uses.
There will probably be more in the future.

Simple EMA Cloud 20/50Shades the area between the 20 and 50 EMAs.
That's all it does, but combined with other indicators like the MACD, it gives you clear indications of entries and exits.
AND, it has no calories. What more could you ask for?
