Cross-Market Regime Scanner [BOSWaves]Cross-Market Regime Scanner - Multi-Asset ADX Positioning with Correlation Network Visualization
Overview
Cross-Market Regime Scanner is a multi-asset regime monitoring system that maps directional strength and trend intensity across correlated instruments through ADX-based coordinate positioning, where asset locations dynamically reflect their current trending versus ranging state and bullish versus bearish bias.
Instead of relying on isolated single-asset trend analysis or static correlation matrices, regime classification, spatial positioning, and intermarket relationship strength are determined through ADX directional movement calculation, percentile-normalized coordinate mapping, and rolling correlation network construction.
This creates dynamic regime boundaries that reflect actual cross-market momentum patterns rather than arbitrary single-instrument levels - visualizing trending assets in right quadrants when ADX strength exceeds thresholds, positioning ranging assets in left quadrants during consolidation, and incorporating correlation web topology to reveal which instruments move together or diverge during regime transitions.
Assets are therefore evaluated relative to ADX-derived regime coordinates and correlation network position rather than conventional isolated technical indicators.
Conceptual Framework
Cross-Market Regime Scanner is founded on the principle that meaningful market insights emerge from simultaneous multi-asset regime awareness rather than sequential single-instrument analysis.
Traditional trend analysis examines assets individually using separate chart windows, which often obscures the broader cross-market regime structure and correlation patterns that drive coordinated moves. This framework replaces isolated-instrument logic with unified spatial positioning informed by actual ADX directional measurements and correlation relationships.
Three core principles guide the design:
Asset positioning should be determined by ADX-based regime coordinates that reflect trending versus ranging state and directional bias simultaneously.
Spatial mapping must normalize ADX values to place assets within consistent quadrant boundaries regardless of instrument volatility characteristics.
Correlation network visualization reveals which assets exhibit coordinated behavior versus divergent regime patterns during market transitions.
This shifts regime analysis from isolated single-chart monitoring into unified multi-asset spatial awareness with correlation context.
Theoretical Foundation
The indicator combines ADX directional movement calculation, coordinate normalization methodology, quadrant-based regime classification, and rolling correlation network construction.
A Wilder's smoothing implementation calculates ADX, +DI, and -DI for each monitored asset using True Range and directional movement components. The ADX value relative to a configurable threshold determines X-axis positioning (ranging versus trending), while the difference between +DI and -DI determines Y-axis positioning (bearish versus bullish). Coordinate normalization caps values within fixed boundaries for consistent quadrant placement. Pairwise correlation calculations over rolling windows populate a network graph where line thickness and opacity reflect correlation strength.
Five internal systems operate in tandem:
Multi-Asset ADX Engine : Computes smoothed ADX, +DI, and -DI values for up to 8 configurable instruments using Wilder's directional movement methodology.
Coordinate Transformation System : Converts ADX strength and directional movement into normalized X/Y coordinates with threshold-relative scaling and boundary capping.
Quadrant Classification Logic : Maps coordinate positions to four distinct regime states—Trending Bullish, Trending Bearish, Ranging Bullish, Ranging Bearish—with color-coded zones.
Historical Trail Rendering : Maintains rolling position history for each asset, drawing gradient-faded trails that visualize recent regime trajectory and velocity.
Correlation Network Calculator : Computes pairwise return correlations across all enabled assets, rendering weighted connection lines in circular web topology with strength-based styling.
This design allows simultaneous cross-market regime awareness rather than reacting sequentially to individual instrument signals.
How It Works
Cross-Market Regime Scanner evaluates markets through a sequence of multi-asset spatial processes:
Data Request Processing : Security function retrieves high, low, and close values for up to 8 configurable symbols with lookahead offset to ensure confirmed bar data.
ADX Calculation Per Asset : True Range computed from high-low-close relationships, directional movement derived from up-moves versus down-moves, smoothed via Wilder's method over configurable period.
Directional Index Derivation : +DI and -DI calculated as smoothed directional movement divided by smoothed True Range, scaled to percentage values.
Coordinate Transformation : X-axis position equals (ADX - threshold) * 2, capped between -50 and +50; Y-axis position equals (+DI - -DI), capped between -50 and +50.
Quadrant Assignment : Positive X indicates trending (ADX > threshold), negative X indicates ranging; positive Y indicates bullish (+DI > -DI), negative Y indicates bearish.
Trail History Management : Configurable-length position history maintains recent coordinates for each asset, rendering gradient-faded lines connecting sequential positions.
Velocity Vector Calculation : 7-bar coordinate change converted to directional arrow overlays showing regime momentum and trajectory.
Return Correlation Processing : Bar-over-bar returns calculated for each asset, pairwise correlations computed over rolling window.
Network Graph Construction : Assets positioned in circular topology, correlation lines drawn between pairs exceeding threshold with thickness/opacity scaled by correlation strength, positive correlations solid green, negative correlations dashed red.
Risk Regime Scoring : Composite score aggregates bullish risk-on assets (equities, crypto, commodities) minus bullish risk-off assets (gold, dollar, VIX), generating overall market risk sentiment with colored candle overlay.
Together, these elements form a continuously updating spatial regime framework anchored in multi-asset momentum reality and correlation structure.
Interpretation
Cross-Market Regime Scanner should be interpreted as unified spatial regime boundaries with correlation context:
Top-Right Quadrant (TREND ▲) : Assets positioned here exhibit ADX above threshold with +DI exceeding -DI - confirmed bullish trending conditions with directional conviction.
Bottom-Right Quadrant (TREND ▼) : Assets positioned here exhibit ADX above threshold with -DI exceeding +DI - confirmed bearish trending conditions with directional conviction.
Top-Left Quadrant (RANGE ▲) : Assets positioned here exhibit ADX below threshold with +DI exceeding -DI - ranging consolidation with bullish bias but insufficient trend strength.
Bottom-Left Quadrant (RANGE ▼) : Assets positioned here exhibit ADX below threshold with -DI exceeding +DI - ranging consolidation with bearish bias but insufficient trend strength.
Position Trails : Gradient-faded lines connecting recent coordinate history reveal regime trajectory - curved paths indicate regime rotation, straight paths indicate sustained directional conviction.
Velocity Arrows : Directional vectors overlaid on current positions show 7-bar regime momentum - arrow length indicates speed of regime change, angle indicates trajectory direction.
Correlation Web : Circular network graph positioned left of main quadrant map displays pairwise asset relationships - solid green lines indicate positive correlation (moving together), dashed red lines indicate negative correlation (diverging moves), line thickness reflects correlation strength magnitude.
Asset Dots : Multi-layer glow effects with color-coded markers identify each asset on both quadrant map and correlation web-symbol labels positioned adjacent to current location.
Regime Summary Bar : Vertical boxes on right edge display condensed regime state for each enabled asset - box background color reflects quadrant classification, border color matches asset identifier.
Risk Regime Candles : Overlay candles on price chart colored by composite risk score - green indicates risk-on dominance (bullish equities/crypto exceeding bullish safe-havens), red indicates risk-off dominance (bullish gold/dollar/VIX exceeding bullish risk assets), gray indicates neutral balance.
Quadrant positioning, trail trajectory, correlation network topology, and velocity vectors outweigh isolated single-asset readings.
Signal Logic & Visual Cues
Cross-Market Regime Scanner presents spatial positioning insights rather than discrete entry signals:
Regime Clustering : Multiple assets congregating in same quadrant suggests broad market regime consensus - all assets in TREND ▲ indicates coordinated bullish momentum across instruments.
Regime Divergence : Assets splitting across opposing quadrants reveals intermarket disagreement - equities in TREND ▲ while safe-havens in TREND ▼ suggests healthy risk-on environment.
Quadrant Transitions : Assets crossing quadrant boundaries mark regime shifts - movement from left (ranging) to right (trending) indicates breakout from consolidation into directional phase.
Trail Curvature Patterns : Sharp curves in position trails signal rapid regime rotation, straight trails indicate sustained directional conviction, loops indicate regime uncertainty with back-and-forth oscillation.
Velocity Acceleration : Long arrows indicate rapid regime change momentum, short arrows indicate stable regime persistence, arrow direction reveals whether asset moving toward trending or ranging state.
Correlation Breakdown Events : Previously strong correlation lines (thick, opaque) suddenly thinning or disappearing indicates relationship decoupling - often precedes major regime transitions.
Correlation Inversion Signals : Assets shifting from positive correlation (solid green) to negative correlation (dashed red) marks structural market regime change - historically correlated assets beginning to diverge.
Risk Score Extremes : Composite score reaching maximum positive (all risk-on bullish, all risk-off bearish) or maximum negative (all risk-on bearish, all risk-off bullish) marks regime conviction extremes.
The primary value lies in simultaneous multi-asset regime awareness and correlation pattern recognition rather than isolated timing signals.
Strategy Integration
Cross-Market Regime Scanner fits within macro-aware and intermarket analysis approaches:
Regime-Filtered Entries : Use quadrant positioning as directional filter for primary trading instrument - favor long setups when asset in TREND ▲ quadrant, short setups in TREND ▼ quadrant.
Correlation Confluence Trading : Enter positions when target asset and correlated instruments occupy same quadrant - multiple assets in TREND ▲ provides conviction for long exposure.
Divergence-Based Reversal Anticipation : Monitor for regime divergence between correlated assets - if historically aligned instruments split to opposite quadrants, anticipate mean-reversion or regime rotation.
Breakout Confirmation via Cross-Asset Validation : Confirm primary instrument breakouts by verifying correlated assets simultaneously transitioning from ranging to trending quadrants.
Risk-On/Risk-Off Positioning : Use composite risk score and safe-haven positioning to determine overall market environment - scale risk exposure based on risk regime dominance.
Velocity-Based Timing : Enter during periods of high regime velocity (long arrows) when momentum carries assets decisively into new quadrants, avoid entries during low velocity regime uncertainty.
Multi-Timeframe Regime Alignment : Apply higher-timeframe regime scanner to establish macro context, use lower-timeframe price action for entry timing within aligned regime structure.
Correlation Web Pattern Recognition : Identify regime transitions early by monitoring correlation network topology changes - previously disconnected assets forming strong correlations suggests regime coalescence.
Technical Implementation Details
Core Engine : Wilder's smoothing-based ADX calculation with separate True Range and directional movement tracking per asset
Coordinate Model : Threshold-relative X-axis scaling (trending versus ranging) with directional movement differential Y-axis (bullish versus bearish)
Normalization System : Boundary capping at ±50 for consistent spatial positioning regardless of instrument volatility
Trail Rendering : Rolling array-based position history with gradient alpha decay and width tapering
Correlation Engine : Return-based pairwise correlation calculation over rolling window with configurable lookback
Network Visualization : Circular topology with trigonometric positioning, weighted line rendering based on correlation magnitude
Risk Scoring : Composite calculation aggregating directional states across classified risk-on and risk-off asset categories
Performance Profile : Optimized for 8 simultaneous security requests with efficient array management and conditional rendering
Optimal Application Parameters
Timeframe Guidance:
1 - 5 min : Micro-regime monitoring for intraday correlation shifts and short-term regime rotations
15 - 60 min : Intraday regime structure with meaningful ADX development and correlation stability
4H - Daily : Swing and position-level macro regime identification with sustained trend classification
Weekly - Monthly : Long-term regime cycle tracking with structural correlation pattern evolution
Suggested Baseline Configuration:
ADX Period : 14
ADX Smoothing : 14
Trend Threshold : 25.0
Trail Length : 15
Correlation Period : 50
Min |Correlation| to Show Line : 0.3
Web Radius : 30
Show Quadrant Colors : Enabled
Show Regime Summary Bar : Enabled
Show Velocity Arrows : Enabled
Show Correlation Web : Enabled
These suggested parameters should be used as a baseline; their effectiveness depends on the selected assets' volatility profiles, correlation characteristics, and preferred spatial sensitivity, so fine-tuning is expected for optimal performance.
Parameter Calibration Notes
Use the following adjustments to refine behavior without altering the core logic:
Assets clustering too tightly : Decrease Trend Threshold (e.g., 20) to spread ranging/trending separation, or increase ADX Period for smoother ADX calculation reducing noise.
Assets spreading too widely : Increase Trend Threshold (e.g., 30-35) to demand stronger ADX confirmation before classifying as trending, tightening quadrant boundaries.
Trail too short to show trajectory : Increase Trail Length (20-25) to visualize longer regime history, revealing sustained directional patterns.
Trail too cluttered : Decrease Trail Length (8-12) for cleaner visualization focusing on recent regime state, reducing visual complexity.
Unstable ADX readings : Increase ADX Period and ADX Smoothing (18-21) for heavier smoothing reducing bar-to-bar regime oscillation.
Sluggish regime detection : Decrease ADX Period (10-12) for faster response to directional changes, accepting increased sensitivity to noise.
Too many correlation lines : Increase Min |Correlation| threshold (0.4-0.6) to display only strongest relationships, decluttering network visualization.
Missing significant correlations : Decrease Min |Correlation| threshold (0.2-0.25) to reveal weaker but potentially meaningful relationships.
Correlation too volatile : Increase Correlation Period (75-100) for more stable correlation measurements, reducing network line flickering.
Correlation too stale : Decrease Correlation Period (30-40) to emphasize recent correlation patterns, capturing regime-dependent relationship changes.
Velocity arrows too sensitive : Modify 7-bar lookback in code to longer period (10-14) for smoother velocity representation, or increase magnitude threshold for arrow display.
Adjustments should be incremental and evaluated across multiple session types rather than isolated market conditions.
Performance Characteristics
High Effectiveness:
Macro-aware trading approaches requiring cross-market regime context for directional bias
Intermarket analysis strategies monitoring correlation breakdowns and regime divergences
Portfolio construction decisions requiring simultaneous multi-asset regime classification
Risk management frameworks using safe-haven positioning and risk-on/risk-off scoring
Trend-following systems benefiting from cross-asset regime confirmation before entry
Mean-reversion strategies identifying regime extremes via clustering patterns and correlation stress
Reduced Effectiveness:
Single-asset focused strategies not incorporating cross-market context in decision logic
High-frequency trading approaches where multi-security request latency impacts execution
Markets with consistently weak correlations where network topology provides limited insight
Extremely low volatility environments where ADX remains persistently below threshold for all assets
Instruments with erratic or unreliable ADX characteristics producing unstable coordinate positioning
Integration Guidelines
Confluence : Combine with BOSWaves structure, volume analysis, or primary instrument technical indicators for entry timing within aligned regime
Quadrant Respect : Trust signals occurring when primary trading asset occupies appropriate quadrant for intended trade direction
Correlation Context : Prioritize setups where target asset exhibits strong correlation with instruments in same regime quadrant
Divergence Awareness : Monitor for safe-haven assets moving opposite to risk assets - regime divergence validates directional conviction
Velocity Confirmation : Favor entries during periods of strong regime velocity indicating decisive momentum rather than regime oscillation
Risk Score Alignment : Scale position sizing and exposure based on composite risk score - larger positions during clear risk-on/risk-off environments
Trail Pattern Recognition : Use trail curvature to identify regime stability (straight) versus rotation (curved) versus uncertainty (looped)
Multi-Timeframe Structure : Apply higher-timeframe regime scanner for macro filter, lower-timeframe for tactical positioning within established regime
Disclaimer
Cross-Market Regime Scanner is a professional-grade multi-asset regime visualization and correlation analysis tool. It uses ADX-based coordinate positioning and rolling correlation calculation but does not predict future regime transitions or guarantee relationship persistence. Results depend on selected assets' characteristics, parameter configuration, correlation stability, and disciplined interpretation. Security request timing may introduce minor latency in real-time data retrieval. BOSWaves recommends deploying this indicator within a broader analytical framework that incorporates price structure, volume context, fundamental macro awareness, and comprehensive risk management.
Multiasset

Portfolio Simulator & BacktesterMulti-asset portfolio simulator with different metrics and ratios, DCA modeling, and rebalancing strategies.
Core Features
Portfolio Construction
Up to 5 assets with customizable weights (must total 100%)
Support for any tradable symbol: stocks, ETFs, crypto, indices, commodities
Real-time validation of allocations
Dollar Cost Averaging
Monthly or Quarterly contributions
Applies to both portfolio and benchmark for fair comparison
Model real-world investing behavior
Rebalancing
Four strategies: None, Monthly, Quarterly, Yearly
Automatic rebalancing to target weights
Transaction cost modeling (customizable fee %)
Key Metrics Table
CAGR: Annualized compound return (S&P 500 avg: ~10%)
Alpha: Excess return vs. benchmark (positive = outperformance)
Sharpe Ratio: Return per unit of risk (>1.0 is good, >2.0 excellent)
Sortino Ratio: Like Sharpe but only penalizes downside (better metric)
Calmar Ratio: CAGR / Max Drawdown (>1.0 good, >2.0 excellent)
Max Drawdown: Largest peak-to-trough decline
Win Rate: % of positive days (doesn't indicate profitability)
Visualization
Dual-chart comparison - Portfolio vs. Benchmark
Dollar or percentage view toggle
Customizable colors and line width
Two tables: Statistics + Asset Allocation
Adjustable table position and text size
🚀 Quick Start Guide
Enter 1-5 ticker symbols (e.g., SPY, QQQ, TLT, GLD, BTCUSD)
Make sure percentage weights total 100%
Choose date range (ensure chart shows full period - zoom out!)
Configure DCA and rebalancing (optional)
Select benchmark (default: SPX)
Analyze results in statistics table
💡 Pro Tips
Chart data matters: Load SPY or your longest-history asset as main chart
If you select an asset that was not available for the selected period, the chart will not show up! E.g. BTCUSD data: Only available from ~2017 onwards.
Transaction fees: 0.1% default (adjust to match your broker)
⚠️ Important Notes
Requires visible chart data (zoom out to show full date range)
Limited by each asset's historical data availability
Transaction fees and costs are modeled, but taxes/slippage are not
Past performance ≠ future results
Use for research and education only, not financial advice
Let me know if you have any suggestions to improve this simulator.

Multi-Asset Cross Timeframe Divergence Ind. (MACDI) // AlgoFyreThe Multi-Asset Cross Timeframe Divergence Indicator (MACDI) identifies divergences in momentum like RSI across multiple assets and timeframes. It visually highlights lagging correlated asset momentum divergences, helping traders spot inefficiencies and potential trade opportunities in the following asset.
🔶 KEY FEATURES
🔸Average Momentum Trendline for Each Timeframe
The Average Momentum Trendline feature calculates the average momentum of multiple assets over specified timeframes. It uses smoothed values to determine the momentum trend for each timeframe on the average aggregated momentum of both assets. This trendline helps traders identify the overall direction of the market momentum, providing a clearer picture of potential price movements.
🔸Real-time Divergence Indication and Alert Table
The Real-time Divergence Indications and Alert Table feature visualizes detected divergences between the momentum values of the two assets across different timeframes. It identifies both bullish and bearish divergences, signaling lagging reversals in the the following asset and potential trading opportunities. When a divergence is detected, the system generates real-time visual indications on the chart and in an overview table for traders to act promptly. The alert table provides a comprehensive overview of all detected divergences, making it easier for traders to monitor and respond to market changes.
🔸Color and Size Based Labels on Price Chart based on Divergence Type
The Color and Size Based Labels feature visually represents divergences directly on the price chart. Bullish and bearish divergences are marked with distinct colors and sizes, making them easily identifiable at a glance. Larger labels indicate higher timeframes and thus generally more significance.
🔶 INSTRUCTION GUIDELINES
🔸Identify Divergence Clusters
The more divergences align, the higher the probability of a potential trend reversal in the asset. When multiple multi-timeframe divergences occur in both lower and higher timeframes within a local cluster, the probability of a reversal increases. This is valid for both for bullish and bearish divergences.
🔸Spot Low Probability Divergences
To further increase the probability, analyze the current state of the average momentum trendline. For a bullish reversal, a relatively low level of the average momentum trendline is preferred, whereas for a bearish reversal, a relatively high level is preferred.
🔶 INDIVIDUAL CONFIGURATION
🔸Leading Asset
This input allows the user to select the leading asset for the divergence analysis.
🔸Following Asset
This input allows the user to select the following asset for the divergence analysis.
🔸Higher Timeframe
This input sets the higher timeframe for the analysis.
🔸Lower Timeframe
This input sets the lower timeframe for the analysis.
🔸Show RSI Divergence
This input enables or disables the display of RSI divergence signals.
🔸RSI Length
This input sets the length of the RSI calculation.
🔸RSI Source
This input sets the source data for the RSI calculation (e.g., close price).
🔸RSI Smoothing Length
This input sets the length of the smoothing applied to the RSI values.
🔸Smoothing Method
This input sets the method used for smoothing the RSI values.
🔶 CONCLUSION
The Multi-Asset Cross Timeframe Divergence Indicator (MACDI) is a powerful tool for identifying momentum divergences across multiple assets and timeframes. Its visual cues and customizable table make it easy to use and interpret, providing valuable insights for trading decisions.

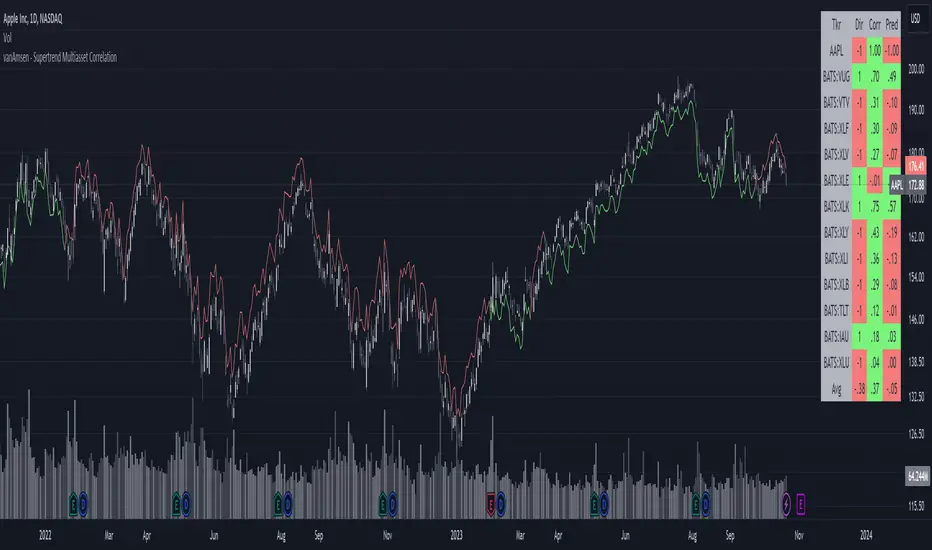
Supertrend Multiasset Correlation - vanAmsen Hello traders!
I am elated to introduce the "Supertrend Multiasset Correlation" , a groundbreaking fusion of the trusted Supertrend with multi-asset correlation insights. This approach offers traders a nuanced, multi-layered perspective of the market.
The Underlying Concept:
Ever pondered over the term Multiasset Correlation?
In the intricate tapestry of financial markets, assets do not operate in silos. Their movements are frequently intertwined, sometimes palpably so, and at other times more covertly. Understanding these correlations can unlock deeper insights into overarching market narratives and directional trends.
By melding the Supertrend with multi-asset correlations, we craft a holistic narrative. This allows traders to fathom not merely the trend of a lone asset but to appreciate its dynamics within a broader market tableau.
Strategy Insights:
At the core of this indicator is its strategic approach. For every asset, a signal is generated based on the Supertrend parameters you've configured. Subsequently, the correlation of daily price changes is assessed. The ultimate signal on the selected asset emerges from the average of the squared correlations, factoring in their direction. This indicator not only accounts for the asset under scrutiny (hence a correlation of 1) but also integrates 12 additional assets. By default, these span U.S. growth ETFs, value ETFs, sector ETFs, bonds, and gold.
Indicator Highlights:
The "Supertrend Multiasset Correlation" isn't your run-of-the-mill Supertrend adaptation. It's a bespoke concoction, tailored to arm traders with an all-encompassing view of market intricacies, fortified with robust correlation metrics.
Key Features:
- Supertrend Line : A crystal-clear visual depiction of the prevailing market trajectory.
- Multiasset Correlation : Delve into the intricate interplay of various assets and their correlation with your primary instrument.
- Interactive Correlation Table : Nestled at the top right, this table offers a succinct overview of correlation metrics.
- Predictive Insights : Leveraging correlations to proffer predictive pointers, adding another layer of conviction to your trades.
Usage Nuances:
- The bullish Supertrend line radiates in a rejuvenating green hue, indicative of potential upward swings.
- On the flip side, the bearish trajectory stands out in a striking red, signaling possible downtrends.
- A rich suite of customization tools ensures that the chart resonates with your trading ethos.
Parting Words:
While the "Supertrend Multiasset Correlation" bestows traders with a rejuvenated perspective, it's paramount to embed it within a comprehensive trading blueprint. This would include blending it with other technical tools and adhering to stringent risk management practices. And remember, before plunging into live trades, always backtest to fine-tune your strategies.
Multi-Asset Month/Month % change 10yr Averages10 Year Averages of Month-on-Month % change: Shows current asset, and 3x user input assets
-For comparing seasonal tendencies among different assets.
-Choose from a variety of monthly average measures as source: sma(close, length), sma(ohlc4, length); as well as sma's of vwap, vwma, volume, volatility. (sma = simple moving average).
-Averages based on month cf previous month: i.e. Feb % = Feb compared to Jan; Jan % = Jan compared to prev year's Dec. Average of the last 10yrs of these values is the printed value.
-Plot on current year (2023), or previous year (2022). If Plotting on current year, and a month of year has not yet occured, a 9yr average will be printed.
/// notes ///
-daily bars in month is a global setting; so choose assets which have similar trading days per month. i.e. Crypto: length = 30 (days per month); Stocks/FX/Indices: length = 21 (days per month).
-only plots on Daily timeframe.
10yr Avgs; Plotting with Year = 2022; using sma(close, 21) as source for average M/M change
