MTF SuperTrends Nexus [DarkWaveAlgo]🧾 Description:
A nexus is a connection, link, or neuronal junction where signals and information are transmitted between different elements.
The MTF SuperTrends Nexus indicator serves as a nexus between MTF SuperTrends by facilitating the visualization of up to eight multi-timeframe SuperTrends, each with its own customizable timeframe, period, factor, and coloring customization. By combining these various SuperTrends, it helps you create a comprehensive view of MTF trend dynamics and cross-timeframe confluence according to the SuperTrend indicator.
It acts as a utility/control center that brings together multiple MTF SuperTrends and allows you to visualize the interactions between them with exceptional ease-of-use and customizability, helping to provide you with valuable insights into potential trend reversals, momentum shifts, and trading opportunities.
💡 Originality and Usefulness:
While there are other multi-timeframe SuperTrend indicators available, MTF SuperTrends Nexus' semi-transparent fills create a compounding opaqueness when SuperTrends from multiple timeframes coalesce - making visual assessment of cross-timeframe confluence extremely easy. We also believe it stands above the rest with its sheer quantity and quality of settings, features, and usability.
✔️ Re-Published to Avoid Misleading Values
This script has been re-published to ensure that it does not use `request.security()` calls using lookahead_on to access future data when referencing SuperTrend calculations from other timeframes. This decreases the likelihood that the indicator will provide deceiving values. This change has been made in accordance with the PineScript documentation: "Using barmerge.lookahead_on at timeframes higher than the chart's without offsetting the `expression` argument like in `close [ ]` will introduce future leak in scripts, as the function will then return the `close` price before it is actually known in the current context" and the Publishing Rule: "Do not use `request.security()` calls using lookahead to access future data". Historical and real-time values may differ when referencing timeframes other than the chart's.
💠 Features:
8 toggleable MTF SuperTrends with customizable timeframes, periods, and factors
Compounding filled areas for easy MTF SuperTrend confluence analysis
Aesthetic and flexible coloring and color theme styling options
End-of chart labels and options for ease-of-use and legibility
⚙️ Settings:
Use a Color Theme: When this setting is enabled, all manual 'Bullish and Bearish Colors' are overridden. All plots will use the colors from your selected Color Theme - excepting those plots set to use the 'Single Color' coloring method.
Color Theme: When 'Use a Color Theme' is enabled, this setting allows you to select the color theme you wish to use.
Fill SuperTrend Areas: When enabled, the area between any MTF SuperTrend and the price bars will be filled with semi-transparent coloring.
Hide SuperTrends on Timeframes Lower Than the Chart: When this setting is enabled, any MTF SuperTrend with a timeframe smaller than that of the chart the indicator is applied to will be hidden from view.
Enable: Show/hide a specific MTF SuperTrend.
Timeframe: Set the timeframe for a specific MTF SuperTrend.
Period: Set the lookback period for a specific MTF SuperTrend.
Factor: Set the multiplier factor used for a specific MTF SuperTrend's calculation.
Bullish Color: When 'Use a Color Theme' is disabled, this will set the 'bullish color' for this specific MTF SuperTrend.
Bearish Color: When 'Use a Color Theme' is disabled, this will set the 'bearish color' for this specific MTF SuperTrend.
Enable Label: When enabled, a label will show at the end of the chart displaying the timeframe, period, factor, and current price value of this specific MTF SuperTrend.
Size: Sets the font size of this specific MTF SuperTrend's label.
Label Offset (in Bars): Sets the distance from the latest bar, in bars, at which this specific MTF SuperTrend's label is displayed.
Show Label Line: When enabled, this specific MTF SuperTrend's label will be accommodated by a dashed line connecting it to its plot.
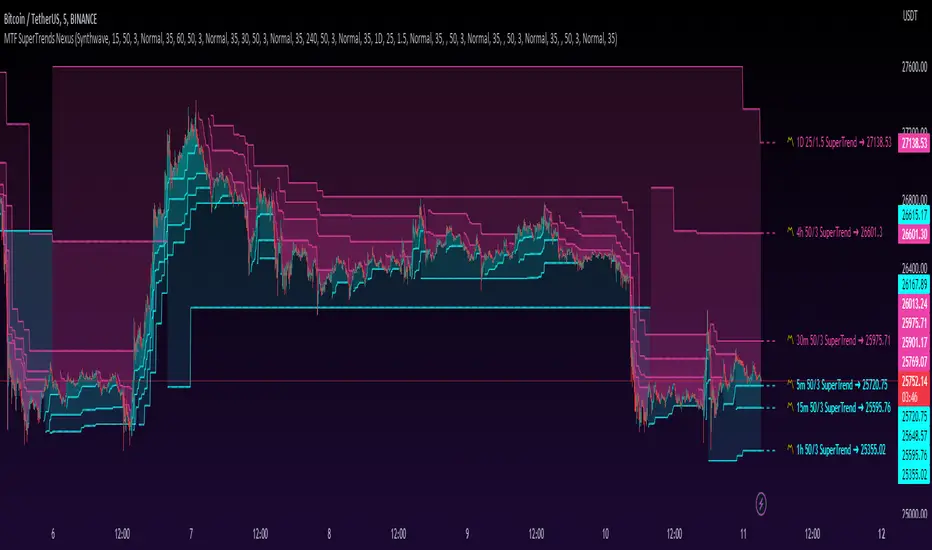
📈 Chart:
The chart shown in this original publication displays the 5 minute chart on BTCUSDT. Displayed on the chart are 6 MTF SuperTrends: the 5m 50-period/3-factor SuperTrend, 15m 50-period/3-factor SuperTrend, 30m 50-period/3-factor SuperTrend, 1h 50-period/3-factor SuperTrend, 4h 50-period/3-factor SuperTrend, and the 1D 25-period/1.5-factor SuperTrend - offering an exemplary view of how you can easily use these MTF SuperTrends to your advantage in analyzing SuperTrend relationships across multiple timeframes.
Multitimeframeanalysis
MTF MAs and Crosses Nexus [DarkWaveAlgo]🧾 Description:
A nexus is a connection, link, or neuronal junction where signals and information are transmitted between different elements.
The MTF MAs and Crosses Nexus indicator serves as a nexus between MTF Moving Averages by facilitating the visualization and interaction of up to eight multi-timeframe moving averages, each with its own customizable timeframe, period, cross-over and cross-under alerts and plot markers, moving average calculation type, and price source.
It acts as a utility/control center that brings together multiple MTF moving averages (MTF MAs) and allows you to visualize the interactions between them with exceptional ease-of-use and customizability, helping to provide you with valuable insights into potential trend reversals, momentum shifts, and trading opportunities.
💡 Originality and Usefulness:
While there are other multi-timeframe moving average indicators available, MTF MAs and Crosses Nexus' customizable alert and signal settings offer intra-indicator MTF moving average cross markers and alerts not seen in other MTF MA indicators, allowing you to visualize the cross-over and cross-under relationships between the indicator's MAs with an 'all-in-one' experience. We also believe it stands above the rest with its sheer quantity and quality of settings, features, and usability.
✔️ Re-Published to Avoid Misleading Values
This script has been re-published to ensure that it does not use `request.security()` calls using lookahead_on to access future data when referencing moving averages from other timeframes. This decreases the likelihood that the indicator will provide deceiving values. This change has been made in accordance with the PineScript documentation: "Using barmerge.lookahead_on at timeframes higher than the chart's without offsetting the `expression` argument like in `close ` will introduce future leak in scripts, as the function will then return the `close` price before it is actually known in the current context" and the Publishing Rule: "Do not use `request.security()` calls using lookahead to access future data".
💠 Features:
8 toggleable MTF Moving Averages with customizable timeframes, periods, moving average calculation types, and price sources
Customizable cross-over and cross-under alert and chart signal options for each MTF MA (toggleable cross alerts and signals for crosses between intra-indicator MAs and bar price values)
Aesthetic and flexible coloring and color theme styling options
End-of chart labels and options for ease-of-use and legibility
⚙️ Settings:
Use a Color Theme: When this setting is enabled, all manual 'Bullish and Bearish Colors' are overridden. All plots will use the colors from your selected Color Theme - excepting those plots set to use the 'Single Color' coloring method.
Color Theme: When 'Use a Color Theme' is enabled, this setting allows you to select the color theme you wish to use.
Hide MAs on Timeframes Lower Than the Chart: When this setting is enabled, any MTF MA with a timeframe smaller than that of the chart the indicator is applied to will be hidden from view.
Enable: Show/hide a specific MTF MA.
Timeframe: Set the timeframe for a specific MTF MA.
Period: Set the lookback period for a specific MTF MA.
Type: Set the calculation type for a specific MTF MA. Options include: Exponential, Simple, Weighted, Volume-Weighted, and Hull.
Source Price: Set the source value used for a specific MTF MA's calculation.
Enable Cross Over Signals & Alerts: When enabled, cross-over chart signals (markers) and alerts are enabled for when this specific MTF MA crosses above its respective 'Cross Over Cross Source'.
Enable Cross Under Signals & Alerts: When enabled, cross-under chart signals (markers) and alerts are enabled for when this specific MTF MA crosses below its respective 'Cross Under Cross Source'.
Cross Source: Set the target plot which this specific MTF MA must cross (for either a cross-over or cross-under event) to trigger a chart signal and alert.
Marker Position: Set the position where this specific MTF MA's cross chart signal should appear. Options include: Above Bar, Below Bar, and On MA Line.
Coloring Method: Set the coloring method for this specific MA. The coloring method defines how the MA should be dynamically colored. Options include: Single Color, Increasing/Decreasing, and Over/Under Price.
Bullish Color: When 'Use a Color Theme' is disabled, this will set the 'bullish color' for this specific MTF MA.
Bearish Color: When 'Use a Color Theme' is disabled, this will set the 'bearish color' for this specific MTF MA.
Single Color: When the 'Coloring Method' is set to Single Color for this specific MA, this color option will set the MA's color.
Enable Label: When enabled, a label will show at the end of the chart displaying the timeframe, period, MA type, and current price value of this specific MTF MA.
Size: Sets the font size of this specific MTF MA's label.
Label Offset (in Bars): Sets the distance from the latest bar, in bars, at which this specific MTF MA's label is displayed.
Show Label Line: When enabled, this specific MTF MA's label will be accommodated by a dashed line connecting it to its plot.
📈 Chart:
The chart shown in this original publication displays the 15 minute chart on BTCUSDT. Displayed on the chart are 4 MTF MAs: the 15m 20 WMA, 30m 100 EMA, 1h 11 EMA, and 1D 7 VWMA - offering an exemplary view of how you can use these MTF MAs and crosses to your advantage in gauging trend relationships across multiple timeframes.

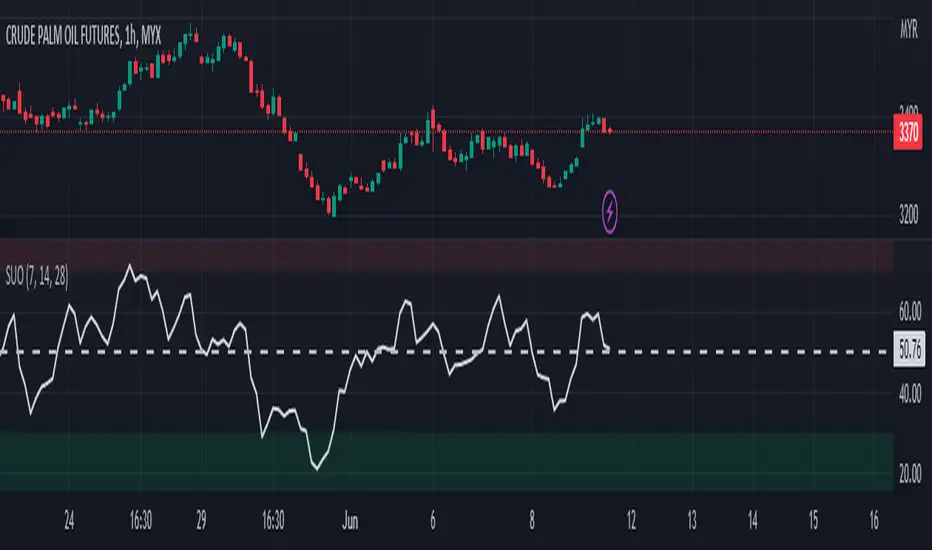
Simple Ultimate Oscillator█ OVERVIEW
This indicator as an educational and showcase the usage of user-defined types (UDT) or objects for Ultimate Oscillator.
█ CREDITS
TradingView
█ FEATURES
1. Color of plot is based on contrast color of chart background.
2. Plot fill of overbought and oversold.
3. Support Multi Timeframe.
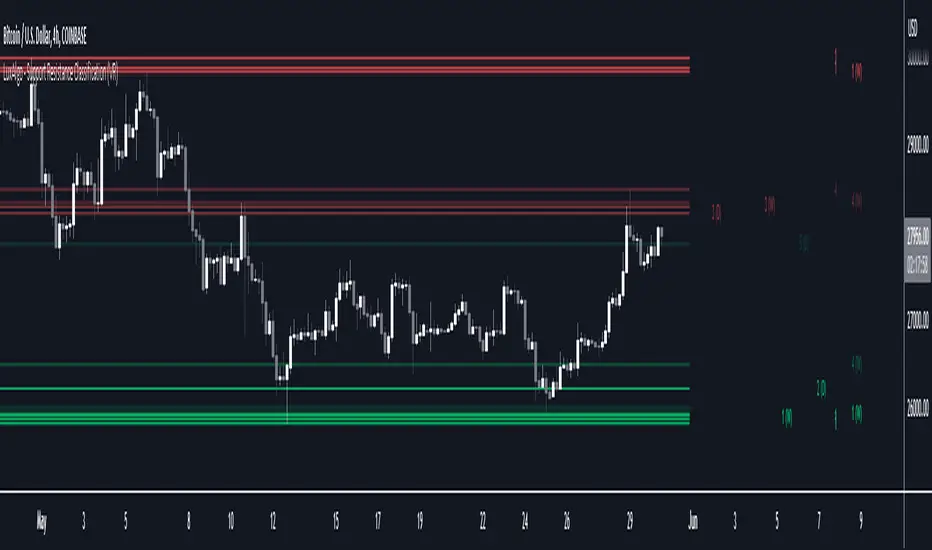
Support Resistance Classification (VR) [LuxAlgo]The Support Resistance Classification (VR) indicator shows SR levels on any chart's visible range using higher time-frame data (HTF). Levels are classified 1 through 10 based on their strength, with lower values indicating stronger support/resistance levels.
This indicator uses visible range functionality, whereas if you adjust your chart to show previous price data, the indicator may show new levels.
🔶 USAGE
Certain indicators on higher timeframes can provide longer term support/resistance levels on lower timeframes. Users can use the provided levels on a chart visible range and use them as reference for future support/resistance levels.
The classification algorithm measures the strength of a support/resistance level using the entire chart visible range and is in a range of 1 to 10, with higher values indicating a weaker support/resistance.
Supports/resistances highlighted by the indicator can be used for future applications by marking them on the chart (quickly done with alt + h).
🔶 DETAILS
All calculations are based on what you see on the Visible Chart, as such changing the chart will recalculate the indicator.
Since only Swings which are not broken are included, every break would exclude that swing. Therefore, even when 'value' is chosen at Settings ('Value'), breaks are always calculated on the entire line.
🔶 SETTINGS
Fade: After x breaks the line becomes invisible
Value:
value:
• SMA, upper/lower: the breaks are triggered on the moving average itself
• Fibonacci Pivot Point levels, Previous High, Previous Low: only last HTF values can be used for breaks
• Swings (see SWING SETTINGS)
line:
• SMA, upper/lower: the breaks are triggered on the entire line, based on its latest value
• Fibonacci Pivot Point Levels, Previous High, Previous Low: breaks are triggered on the entire line, based on its latest value
• Swings (see SWING SETTINGS)
🔹 Swing Settings
Swings are always calculated at current timeframe, setting a HTF is not applicable on Swings.
Left/Right: for Swing calculation ( pivothigh , pivotlow )
Show: enables you to see the pivot points
🔹 Set
N°: The concerning number
TYPE:
• SMA (Simple Moving Average)
• Previous High/Low
• Upper/Lower ( Bollinger Bands )
• Pivot Point levels : "Fibonacci"
LENGTH: sets the 'Number of bars', needed for calculations (applicable for SMA, upper/lower)
MULT: sets the 'Standard deviation factor' (only applicable for upper/lower - BB)
HTF: sets 'Higher Time Frame' (applicable for SMA, upper/lower, Previous High/Low, Fibonacci)
🔹 Show Values
You can make up to 5 values visible (if you want to check/verify), except for Swings (see SWING SETTINGS)
To do so, enable (A -> E), and choose the N° you want to see.
This also is a useful tool if you're not sure which value you want to set.
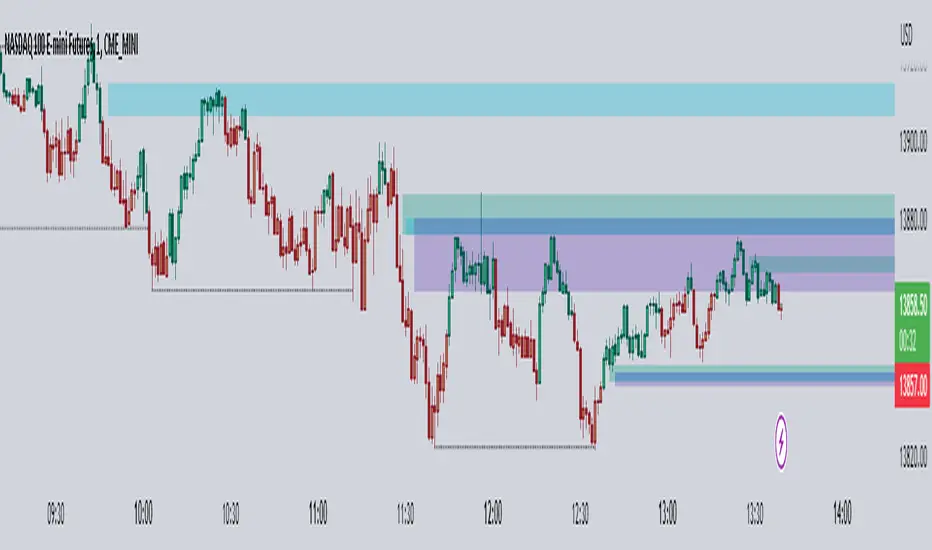
Multi-Timeframe FVG [TFO]The goal of this indicator is to find Fair Value Gaps (FVGs) that overlap on multiple timeframes. FVGs are already meant to be “sensitive” areas where one might expect price to react from, therefore FVGs that overlap on multiple timeframes could provide even more confluence that there may be a reaction in said area (with proper context).
Mitigation Type allows users to select how FVGs should be mitigated, either by wick or by completely closing through the area.
The displacement option helps to filter out smaller FVGs by looking for areas where price ran rather quickly (causing displacement). This is done by comparing the candle that made the FVG to a fractional ATR value, so that one may fine-tune how much “larger” the candle range needs to be, relative to recent price action.
The timeframe alignment option allows users to select how many timeframes must be converging in order to draw FVGs. For instance, with all timeframes selected, a timeframe alignment value of 2 would require that there be overlapping FVGs on 2 or more timeframes. A value of 3 would require that there be overlapping FVGs on all 3 timeframes in order for them to be drawn.
See inside Candles: Directionality %; Constituent Bars & GapsSee inside candles based on user-input LTF setting: get data on 'Directionality' of your candle; Gaps (total and Sum; UP and DOWN); Number of Bull or Bear constituent candles
//Features:
-DIRECTIONALITY: compare length of the 'zig-zag' random walk of lower time frame constituent candles, to the full height of the current candle. Resulting % I refer to as 'directionality'.
-GAPs: what i refer to as 'gaps' are also known as Volume imbalances: the gap between previous candles close and current candle's open (if there is one).
--Gaps total (up vs down gaps). Number of Up gaps printed above bar in green, down gaps printed below bar in red.
--Gaps Sum (total summed UP gap, total summed down gaps. Sum of Up gaps printed above bar in green, Sum of down gaps printed below bar in red.
-Candles Total: Numer of LTF up vs down candles within current timeframe candle. Number of up candles printed above bar in green, Number of down candles printed below bar in red.
//USAGE:
-Primary purpose in this was the Directionality aspect. Wanted to get a measure of how choppy vs how directional the internals of a candle were. Idea being that a candle with high % directionality (approaching 100) would imply trending conditions; while a candle which was large range and full bodies but had a low % directionality would imply the internals were back-and-forth and => rebalanced, potentially indicating price may not need to retrace back into it and rebalance further. All rather experimental, please treat it as such: have a play around with it.
-Number of gaps, Sums of up and down gaps, ratio of up and down constituent candles also intended to serve a similar purpose as the above.
-Set the input lower timeframe; this must obviously be lower then your current timeframe. You will significant differences in results depending on the ratio your timeframes (chart timeframe vs user-input timeframe).
//User Inputs:
-Lower timeframe input (setting child candle size within current chart parent candle).
-Choose function from the four listed above.
-typical formating options: Bull color/bear color txt for gaps functions.
-display % unit or not.
-display vertical or horizontal text.
-Set min / max directionality thresholds; and color code results.
-Toggle on/off 'hide results outside of threshold' to declutter the chart.
-choose label style.
//NOTES:
-Directionality thresholds can be set manually; Max and Min thresholds can be set to filter out 'non-extreme' readings.
-Note that directionality % can sometimes exceed 100%, in cases where price trends very strongly and gaps up continuously such that sum of constituent candles is less than total range of parent candle.
-Personally i like the idea of seeking bold, large-range, full bodied candles, with a lower than typical directionality %; indicating that a price move is both significant and it's already done it's rebalancing; I would see this as potentially favourable for continuation (obviously depending on context).
---- Showcase of the other functions beyond Directionality percentage ----
Candles Total (bull vs Bear). ES1! Hourly; ltf = 5min: Candles total: LTF up candles and LTF down candles making up the current HTF candle (constituent number of UP candles printed above in green, Down candles printed below in red):
Gaps SUM. SPX hourly, ltf = 5min. Sum of 'UP' gaps within candle printed above in green, sum of 'DOWN' gaps printed below in red:
Gaps TOTAL: SPX hourly, ltf = 1min. Simply the total of 'up' gaps vs 'down' gaps withing our candle; based on the user input constituent candles within:

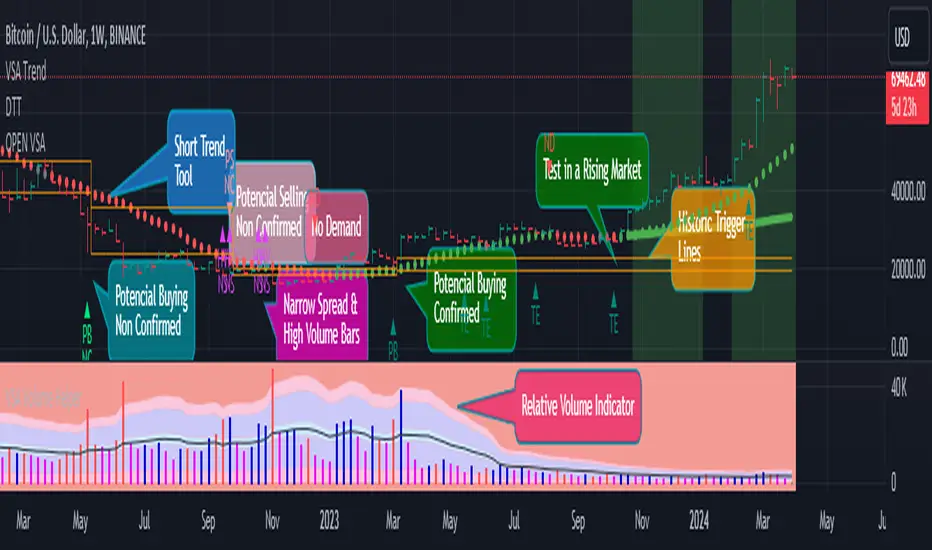
Open VsaVsa Trend is a tool that utilizes the principles of Volume Spread Analysis (VSA) to identify potential trading opportunities. This tool highlights several principles such as PB, PBNC, PS, PSNC, TE, ND, Short Trend Tool, Trigger Lines, and Multiple Alignment of Trends.
These principles assist in identifying potential buy and sell opportunities based on the relative volume of bullish and bearish bars in different trend scenarios. The Short Trend Tool is used to compare the trend and closing price to determine the color of the trend. Trigger Lines are key support and resistance levels based on PB, PBNC, PS, and PSNC bars.
The Multiple Alignment of Trends feature allows users to select between different modes such as NO, Scalping, Day Trading, and Position Trading to help identify multiple trends across various timeframes.
The Confirmation Beginning Alert feature provides users with confirmation alerts based on various filters such as ND/TE, ND/TE & Short Trend, and ND/TE & Short Trend & Trend Alignment. Using this tool in combination with an AVWAP tool can enhance its effectiveness in identifying potential trading opportunities.
-Vsa Trend is a tool that applies the principles of Volume Spread Analysis (VSA) to identify potential trading opportunities.
-The Short Trend Tool is used to compare the trend and closing price to determine the color of the trend.
-The Multiple Alignment of Trends feature enables users to choose between different modes such as NO, Scalping, Day Trading, and Position Trading to detect multiple trends across various timeframes.
-The Confirmation Beginning Alert feature provides users with confirmation alerts based on various filters such as ND/TE, ND/TE & Short Trend, and ND/TE & Short Trend & Trend Alignment.
1-PB (Potential buy confirmed. In bearish trend, a bearish bar of high relative volume with the following bullish bar)
2-PBNC (Potential buy not confirmed. In bearish trend, a bearish bar of high relative volume with the following bearish bar)
3-PS (Potential sell confirmed. In an uptrend, a bullish bar of high relative volume with the next bearish bar)
4-PSNC (Potential unconfirmed sell. In an uptrend, a bullish bar of high volume relative to the next bullish bar)
5-TE (Test confirmed. In an uptrend, a bearish bar with lower volume than the previous 2 bars, with the next bullish on average volume)
6-ND (No Confirmed Demand. In a downtrend, a bullish bar with lower volume than the previous 2 bars, with the next bearish on average volume)
7-Short Trend Tool (It is an SMA that compares its trend and the closing price to define its color
8-Trigger Lines (They are the maximum and minimum values of a PB, PBNC, PS, or PSNC bar) The idea is to look for a TEST confirmation on or NO DEMAND under that area. The above areas are also important support and resistance levels, which is why they are charted.
9-The PS/PSNC/PB/PBNC principles are always graphed as it helps us to keep in mind a possible setup in VSA. You can choose if you want to receive alerts when a principle is presented.
10. Multiple Alignment of Trends (Allows you to select between 3 modes. NO/Scalping/Day Trading and Position Trading) According to this, the "Short Trend Tool" is taken in several timeframes and when it has alignment in its trend color, it will change from color the corresponding background.
11. Confirmation Beginning Alert: Allows you to decide if you want to receive TEST or NO DEMAND Confirmation alerts under 3 filters
-ND/TE: Only the beginning is required with no short-term trend
-ND/TE & Short Trend: In addition to the principle, it takes into account the Color of the current short-term trend.
-ND/TE & Short Trend & Trend Alignment: In addition to the above, the color of the multiple alignment is taken into account to trigger an alert.
-It work better if you use in combination with a Daily VWAP tool
MTF Candle [Pt]The Multi-Timeframe (MTF) Candle Tool is a powerful indicator designed for traders who wish to analyze standard candle bars and Heikin Ashi candles of multiple timeframes simultaneously. This tool is ideal for traders who prefer to trade in higher timeframes while keeping a close eye on the lower timeframes for confirmation signals. The indicator works by overlaying standard candle bars or Heikin Ashi candles of a higher timeframe onto the current chart. This allows traders to quickly switch between the current timeframe and the higher timeframe, without having to switch charts.
Features
- Live, real time updating MTF candle
- Custom colors
- Heikin Ashi candle
- Heikin Ashi Inside bar highlight

Simple ICT Order Blocks and Fair Value Gaps by Gowtham KannakajeThis scripts identifies ICT Order Block and ICT Fair Value Gaps
Fair Value Gap:
- Fair Value Gap toggle is off by default
- Users can choose to color the bars having Fair Value Gaps or can select to define the Fair Value Gap using boxes.
- Bar color and box colors can be customized
Order Blocks:
- Order Block box and candle color toggle is on by default
- Users can choose to color the Order Block candles or can select to define the Order Blocks using boxes.
- Bar color and box colors can be customized for bullish and bearish Order Block separately
Note:
- Order Blocks are considered valid only if the candle forming the Fair Value Gap closes away from the Order Block.
- Since Trading View limits the number of boxes to 500, it is advised to use the Color Candle option to identify the Order Blocks or Fair Value Gaps which are very old.
New concept Definitions:
Naked OB : An order block whose immediate next candle forms a Fair Value Gap. Here, the Order Block high or low contributes to the formation of Fair Value Gap.
Covered OB : An order block whose immediate next candle doesn't form a Fair Value Gap. Here, the Order Block high or low doesn't contribute to the formation of Fair Value Gap. Instead it will have other candles in between the Order Block and Fair Value Gap.
Disclaimer: The usage of this indicator might or might not contribute to your profits and losses and the author is not responsible for the same.
Happy Trading.

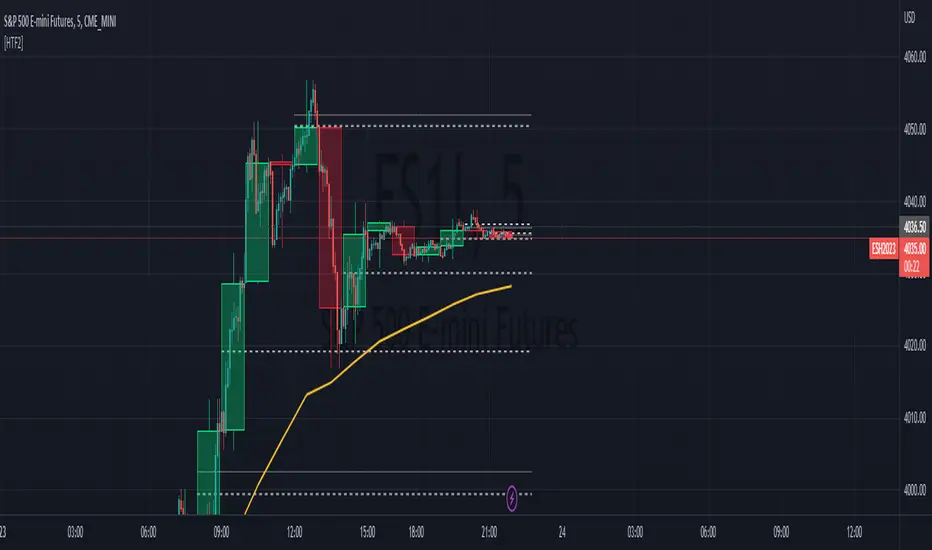
HTF Tool 2HTF Tool 2: Because the previous version was removed for being too powerful.
HTF Tool allows Users to display Higher Timeframe(HTF) Candles on their Chart with retracement lines drawn from the (High/Low) range of the HTF candle, as well as a live HTF MA.
This indicator perfectly handles Requested data to display a non-lagging HTF Moving Average(MA) by bridging a solid historical data stream with the live data stream.
This is done by offsetting plot data backwards to the middle of the last HTF candle, and then drawing a line from the last candle middle, to the live candle middle.
I have manipulated the data display to give the appearance that it consists of only 1 plot line, Whereas in reality, The HTF MA consists of 3 different processes:
- 1 historical plot value, to display the (correct) historical EMA with the same plot points you would see on the HTF chart from the same ema.
- 1 live line, re-drawn at every tick to mimic the way plot values move around while the bar is live.
- 1 live plot value, that is only displayed as a number on the status line and price scale to make it look like these are the outputs from the constantly redrawing line.
Because of this, This indicator displays the exact same way you would see this data on the requested timeframe's chart .
Note: You will see 2 values on the status line, these are the Historic MA, and Live MA values (Left, Right).
When hovering over historic values, a Historic MA value will only display in the middle of the HTF bars (same bar as the HTF wick)
This indicator include:
- HTF Candles, Drawn in the Traditional Candlestick Fashion.
- A User Adjustable HTF EMA / SMA , This Moving Average is accurate the the display you would see on a HTF chart.
- User Adjustable Retracement lines, up to 3 levels. These levels dynamically delete when price crosses them.
- Adjustable Display Range to display more or less HTF candles.
- Toggleable "Safe Mode" to keep the indicator display looking clean at all times.*
All Colors are Customizable to fit your layout style (Candle, Levels, HTF MA)
*Safe mode checks that your current chart's timeframe cleanly multiplies into your requested timeframe an odd number of times. This keeps the HTF candle wicks perfectly centered, and keeps the candle body width perfectly consistent.
If you choose to turn safe mode off here are some things to consider:
All Vertical data is consistent with the HTF requested , ONLY the horizontal alignment of the indicator will be thrown off.
When on low timeframes requesting other relatively low timeframes these issues are extremely more apparent than when requesting substantially larger timeframes.
Example: Safe Mode will likely need to be turned off for any 4h chart request, but as seen in the following image, the bars still look very normal.
Note: If you ONLY want to see the Levels and Moving Average... You ARE capable of requesting the current chart's timeframe. If you do this, the indicator will stop drawing the HTF candles, since your chart already shows that timeframe's candles.
Enjoy!
Stoch RSI 15 min - multi time frame tableABOUT THIS INDICATOR
This indicator calculates the Stochastic RSI for the time frames 15 min, 30 min, 1h, 4h, and 12h. However, the 15 min time frame should always be the default time frame for your chart.
IMPORTANT
* NOTE! It's extremely important that the chosen time frame for your chart is 15 min. Otherwise the Stochastic RSI for the longer time frames won’t be correctly calculated.
* Stochastic RSI will be calculated and displayed in a table for the time frames: 15 min, 30 min, 1h, 4h, 12h.
* All time frames are based on closed bars except the "15minR" that are realtime updated values calculated on a 15 min time frame.
ABOUT STOCHASTIC RSI
The Stochastic RSI (StochRSI) is a momentum indicator that ranges between 0 and 100. A Stochastic RSI value above 80 is considered overbought and below 20 is considered oversold.
By using different time frames you can get a better idea of what direction the trade could take in a "longer" perspective.
SETTINGS
1.) Length RSI = 14 (default period)
2.) Smoothing parameter of Stochastic RSI (Length Moving Average = 3) . Moving average of stochastic RSI
* By default the displayed Stochastic RSI values are smoothed values of the actual Stochastic RSI. The smoothnes is formed by a calculated moving average of with the length of 3 by default.
If you want Stochastic RSI with a sharper signal (higher risk for "false alarms" being more sensitive) change the Length Moving Average to = 1 (no smoothness at all)
You can see the selected "Length RSI" and "Length Moving Average" on top of the Stochastic RSI table.
Next version of this script will be updated with more a more flexible solution for different time frames.
* NOTE, Tradingview comes with a inbuilt Stochastic RSI. See the the chart below. The blue line in the Stochastic-RSI chart represents (K value = 3) the same value as the script calculate/display in the table.

Trendly
╭━━━━╮╱╱╱╱╱╱╱╱╭┳╮
┃╭╮╭╮┃╱╱╱╱╱╱╱╱┃┃┃
╰╯┃┃┣┻┳━━┳━╮╭━╯┃┃╭╮╱╭╮
╱╱┃┃┃╭┫┃━┫╭╮┫╭╮┃┃┃┃╱┃┃
╱╱┃┃┃┃┃┃━┫┃┃┃╰╯┃╰┫╰━╯┃
╱╱╰╯╰╯╰━━┻╯╰┻━━┻━┻━╮╭╯
╱╱╱╱╱╱╱╱╱╱╱╱╱╱╱╱╱╭━╯┃
╱╱╱╱╱╱╱╱╱╱╱╱╱╱╱╱╱╰━━╯
About the script:
This script is an easy-to-use trend indicator, which is based on another popular indicator called "Supertrend" . The basic idea is very simple, i.e. to compute Average True Range(ATR) and use that as the basis for trend detection. The key difference lies in a custom trend detection method, that computes trends across different timeframes and projects them in a table view. The script also tries to improve the behaviour of the existing indicator by highlighting flat regions on the chart, indicating sideways market or potential trend reversals.
How to use it:
You can use it just like any other indicator, add it to your chart and start analysing market trends. Results can be interpreted as follows.
Indicator output is currently made up of two main components:
>> Trend Table:
Appears at the bottom right of your screen
Contains trend indicator for 9 different timeframes
Timeframes can be adjusted using indicator settings panel
Green Up Arrow --> Up Trend
Red Down Arrow --> Down Trend
>> Enhanced Supertrend:
Shows up as a line plot on the chart
Green line indicates up trend
Red line indicates down trend
White regions indicates slow moving markets or a potential trend reversal
Indicator can be used on any timeframe, it provides a view of current and historical market trend
Can be used as an indicator for entering/exiting trades
Can be used to build custom trading strategies

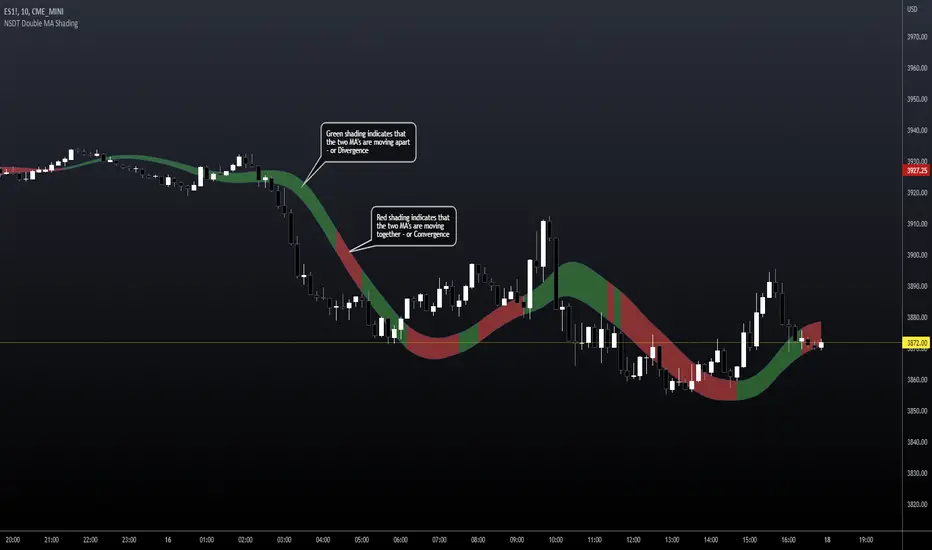
NSDT Double MA ShadingThis script is an interesting take on Convergence and Divergence of Moving Averages. With the built-in MACD Indicator, you cannot make these adjustments to the settings.
DESCRIPTION
The top Moving Average is calculated on the High of the candle.
The bottom Move Average is calculated on the Low of the candle.
If the two are moving apart (Divergence), the shaded area between them turns Green.
If the two are moving together (Convergence), the shaded area between them turns Red.
This may help identify when a trend is becoming stronger or weaker, based on the shaded area and Moving Average direction.
POSSIBLE USAGE
For example:
If the MA's are pointing downward and the shaded area is Green - it means that average distance between the candle High and Low is getting wider, which may indicate a stronger downward movement. Then, when the shaded area turns Red, signaling the average distance between the candle High and Low are getting narrower, this may indicate that the downward movement is weakening, and may be the end of that downward trend.
SETTINGS
You can choose from EMA, SMA, WMA, RMA, HMA, TMA, and VWMA.
Although you can choose the MA Source, it is highly recommended to keep one source on the High of the candle and the other on the Low of the candle, for measure Convergence and Divergence.
All indicator settings are editable.
It can be used on Multi Timeframes (MTF).
This script is free and open source.
Auto Fibo Multi Timeframe [Misu]█ This indicator shows a Multi Timeframe automatic Fibonacci retracement levels.
This indicator is built using pivots from a user-selected timeframe to draw and orient the Fibonacci retracement.
Fibonacci analysis uses a logical sequence of numbers to predict trends and price action.
█ Usages:
The Fibonacci retracement is used to identify hidden support and resistance levels that an investor can use for entry, exit, and stop placement.
Depending on your usage, you can track breakouts above and below retracement levels to provide early entry points for major breakouts and breakdowns.
Higher timeframe Fibs allow you to have more relevant and weighted signals.
█ Features:
Choose Timeframe
Choose Fib levels
Color Fib Levels Individually
Color Fib Levels all in one
█ Parameters:
Timeframe: The Timeframe chosen.
Left Bars: A parameter used to calculate pivots.
Right Bars: A parameter used to calculate pivots.
UI Settings: Select Fibs levels and colors.

CFH | RSI-SRSI tableShows RSI and SRSI values on multiple timeframes, highlights oversold and overbought
Timeframes and colors are customizable
/V1llager/

Timeframe Bias TableAllows you to display a bias for the W, D, 4h, 15m & 1m Timeframes based on your own analysis.

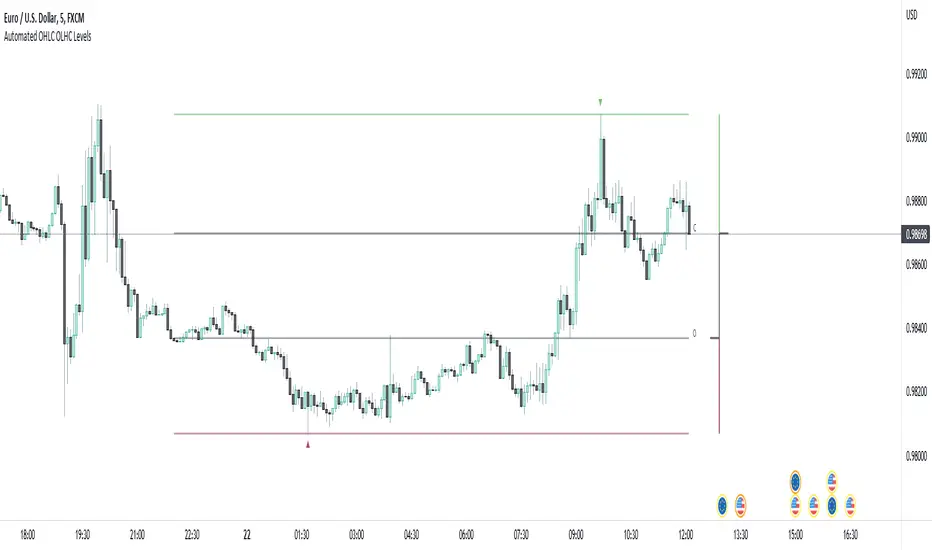
Automated OHLC OLHC LevelsA simple, clean, effective visualization tool, for the OHLC or OLHC of a chosen candle/timeframe.
Apply this indicator using a higher timeframe, in conjunction with other levels and the directional bias, to easily recognize trading opportunities at lower timeframes.
SuperTrend Momentum Chart(My goal creating this indicator) : Provide a quick way to check the current momentum of multiple timeframes. The Smart Momentum Chart was intended to be a live trading tool that should be used when a trader has already defined his edge and no longer needs the past Momentum data.
The Underlying Concept
What is Momentum ?
The Momentum shown is derived from a Mathematical Formula SUPERTREND , when price is above SUPERTREND its bullish Momentum and when its below SUPERTREND its Bearish Momentum. This indicator scans for candle closes on the timeframes you've selected and when there is a shift in momentum it notifies the trader with a color change and an alert if one was set up.
Technical inputs
- If you want to optimize the rate of signals to better fit your trading plan you would change the Factor input and ATR Length input. Increase factor and ATR Length to decrease the frequency of signals and decrease the Factor and ATR Length to increase the frequency of signals.
Quick TIP! : You can Sync all VFX SuperTrend Indicators together! All VFX SuperTrend indicators display unique information but its all derived from that same Momentum Formula. Keep the Factor input and ATR Length the same on other VFX SuperTrend indicators to have them operating on the same data.
Time Frame Inputs
- Your able to fill the chart with up to 8 timeframes
- If You don't need all 8 you can limit the amount to display by changing the "Time Frame Amount"
Display Inputs
- You can change the size of the chart and the color of the text
- You can toggle ON if you want to be signaled when a momentum switch occurs ( bullish to bearish or bearish to bullish )
- Your able to pick the Bullish and Bearish Colors of the Momentum switch
How it can be used ?
- Easily check the momentum of other Timeframes and use that information as a variable in your trading plan.
- quickly glance and know the momentum of any time frame before you enter any trade
- always know the momentum of the higher time frames
- Eliminate the need to switch from current chart
- Get an abundance of information in one location
- Have clear variables to structure your trades around

MTFT EMA CloudsMulti Time Frame Tools
Multi Time Frame Tools (MTFT) is a suite of scripts aimed to establish a standard timeframe-based color scheme. This can be utilized to overlay different timeframes calculations/values over a single timeframe. As one example, this would allow to observe the 5-month moving average, 5-week moving average, and 5-day moving average overlaid over each other. This would allow to study a chart, get accustomed to the color scheme and study all these at the same time much easier.
All indicators calculated using the below specific timeframes as input, will always use the color scheme outlined below. This is to get you in habit of recognizing the different timeframes overlaid in top of each other. These can be personalized.
Longer TF analysis.
Yearly - Black
Semi-Annual - Yellow
Quarterly - White
Monthly - Maroon
Weekly - Royal Blue
Daily - Lime
Shorter TF analysis.
4 hour - Fuchsia
1 hour - Orange
30 min - Red
15 min - Brown
10 min - Purple
5 min - Lilac
All color coordination is able to be modified in either the “Inputs” or “Style” section. If you need to make changes, make sure to select “Save as Default” on the bottom right of the settings menu.
Recommended Chart Color Layout
I played around with color coordination a lot. The final product was what worked best for me. I personally use the following chart settings to accent all available TF colors.
-> Click on the settings wheel on your chart. -> Click on “Appearance”.
Background - Solid -> On the top row pick the 6th color from the left.
Vert Grid Lines and Horz Grid Lines -> On the top row pick the 7th color from the left.
You may of course change these and the indicator line colors as you like.
Adding indicator to Chart
-> Open the TradingView “Indicators & Strategies” library, the icon has “ƒx”. -> All premium scripts will be located under “Invite-Only Scripts” -> Click indicator to add to your chart.
*** MTFT EMA Clouds ***
The Exponential Moving Average Clouds, EMA Clouds, is a commonly discussed FinTwit tool. I personally found it through Ripster47 and PatternProfits on Twitter. I have seen big FinTwit accounts solely focus on this strategy alone and have seen other big FinTwit accounts mix with their other indicators. I will be providing very basic info to utilize this script; it is up to you to dive deep into learning this strategy. I am not an expert with the tool or a financial advisor. As with all aspects of life, I recommend you research, learn, discern and practice extensively in order to become a master.
The script has the following features.
1. Two user selected timeframes(TF) per script instance. Timeframes include: Quarter, Month, Weekly, Daily, 4 hour, 1 hour, 30 min, 15 min, 10 min, and 5 min candlestick data.
2. Five Unique Clouds per selected timeframe can each be individually enabled/disabled. Cloud pairs include: 5&13, 8&9, 34&50, 72&89, and 180&200.
Below are some examples of how switching between multiple TF’s could assist you in identifying patterns and resistance/support easier. Below are 4 different timeframe EMA Clouds plotted over similar areas. What supports/resistances do you see?
Weekly timeframe selected with Quarterly Clouds
Weekly timeframe selected with Monthly Clouds
Daily timeframe selected with Weekly Clouds
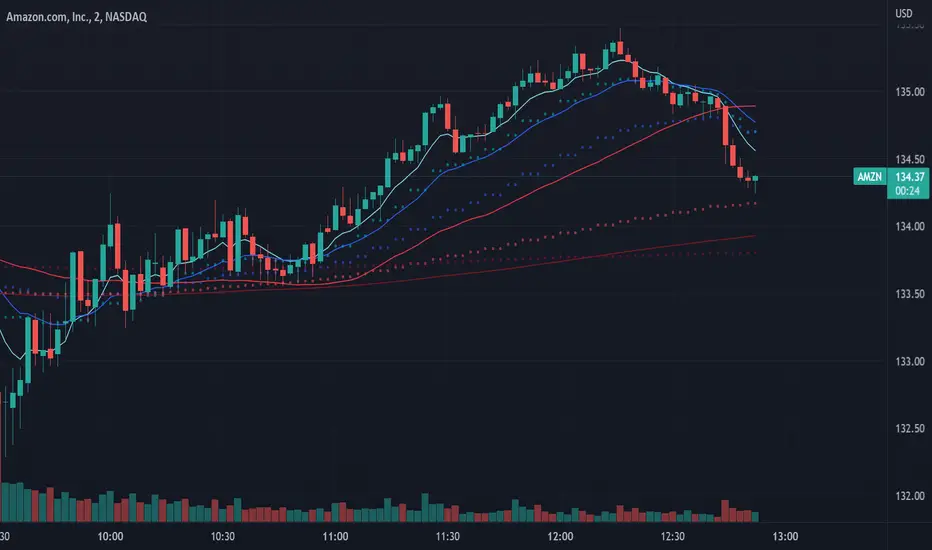
1-hour timeframe selected with Daily Clouds.
This is meant to show you that the EMA Clouds often serve as resistance/support on multiple timeframes.
3. Force a specific cloud on both selected timeframes. Maybe you want to see how one cloud on several TFs looks over the same chart. Here I added two instances of the script in order to show 4 different TF clouds (Q, M, W, and D). Then I selected the “8_9” on “Force single cloud” for each instance, which will force only the selected cloud to be forced on all the selected time frames.
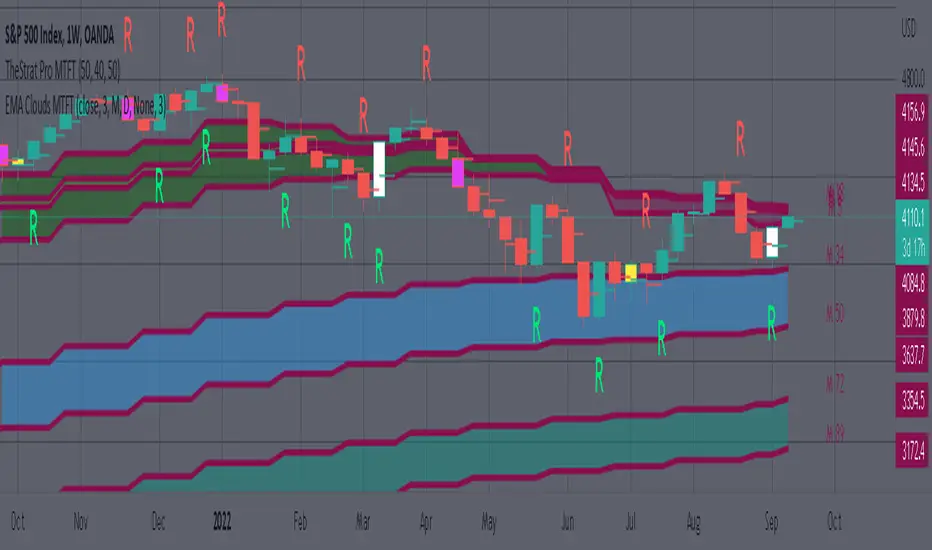
IMPORTANT NOTE: One of the lessons I would consider most important in attaining clarity regarding trading, is “TheStrat” by Rob Smith. His lesson on “actionable signals” is something that can be applied to any strategy. For this reason, I am including “MTFT TheStrat Patterns Pro” script in all images that will depict confluence for a better trade selection.
Example using TheStrat Pro MTFT with this indicator.
Look for a “TheStrat actionable signal” or a “TheStrat Reversal signal” on a smaller timeframe that has an instance of this indicator on a larger timeframe calculation that is in range of the candlestick that formed your actionable signal. This means that the indicators plot you are observing must be above the low and below the high of the candlestick that is the actionable signal/reversal signal. Image below shows what this would look like with this indicator.
The Image below shows what this would look like with this indicator. The selected candlestick is the Weekly, it shows a hammer actionable signal and the Monthly 34 EMA in range. This actionable signal is meant to be played in a long position. If the high is breached, you would enter a long position from the high of the hammer candlestick. For targets you would look at the previous pivots, for this example all targets were hit. Note that the “Entry” and “Targets” line were added manually and are not part of the script. Setups won’t always play out so nice and clean, but given that there is so many stocks and so many signals this is just a thought to improve the quality of the signal as it has extra confluence. If you are interested in learning further, research ‘TheStrat’ by Rob Smith.
Multi-timeframe Squeeze Mom + ADX and DIsMulti-timeframe Squeeze and ADX
This indicator is designed to be able to get used in combination with others that can lead to a potential help for trading.
The indicator uses colors such us light green, dark green, light red and dark red. Light green and light red to indicate the second half and strongest movement of an upwards and downwards movement, respectively. The same for the first half of an upwards or downwards movement, dark red for the possible start of the upwards movement and dark green ad possible start of the downwards movement.
The indicator is multi-timeframe because the trader can configure within the menu a background timeframe, which plots a squeeze momentum for a different timeframe than the one selected for the main graph. It plots the background timeframe with an area style, while the main squeeze is plotted with a column style. This helps the traders to analyze whether entering a position countering a higher timeframe upwards or downwards squeeze momentum.
It also shows the divergences that occur between the price and the squeeze momentum that can add strength to a potential movement upwards or downwards.
The ADX, DI+ and DI- lines are also added to determine the potential strength of the movement in the monitor (squeeze momentum). If the DI+ is over the DI-, then the strength is likely higher upwards and the opposite for the downwards strength.
Fundamentals
Squeeze momentum: It shows the periods when volatility increases or decreases, in other words, when the market goes from the trend into flat movement and vice versa.
ADX (Average Directional Index): The ADX helps the indicator to estimate the strength of the movement, always considering the DI+ and DI- to not go against the trend strength.
Positive (DI+) and Negative DI (DI-): Both DI+ and DI- measure up and down price movement, in some cases crossovers of these lines can be used as trade signals.
Divergences: Divergence occur when the price of an asset is moving in the opposite direction of a technical indicator, such as an oscillator (squeeze momentum). Divergence warns that the current price trend may be weakening, and in some cases may lead to the price changing direction.
Panel
This panel allows the trader to have a summary of the values of the direction and strength of the movement. It has the following characteristics:
It is placed on the right middle side of the chart indicator by the default.
Its colors changes according to the indicator’s values.
The summary box shows the projection for the main squeeze plot and also for the background squeeze plot. If only one is needed, it can be changed on the menu of the indicator.
Summary
From all previously mentioned, it can be stated that the indicator allows users to:
Detect the direction of trends
Detect price and squeeze divergences
Get a table summarizing important values of the indicator to determine the strength of a trend.

MTFA - Multi Time Frame Analysis - Moving AveragesThis indicator will help you make better informed trading decisions by showing higher time frame moving averages overlaid on a single chart. You can customise 4 moving averages.
Rsi/W%R/Stoch/Mfi: HTF overlay mini-plotsOverlay mini-plots for various indicators. Shows current timeframe; and option to plot 2x higher timeframes (i.e. 15min and 60min on the 5min chart above).
The idea is to de-clutter chart when you just want real-time snippets for an indicator.
Useful for gauging overbought/oversold, across timeframes, at a glance.
~~Indicators~~
~RSI: Relative strength index
~W%R: Williams percent range
~Stochastic
~MFI: Money flow index
~~Inputs~~
~indicator length (NB default is set to 12, NOT the standard 14)
~choose 2x HTFs, show/hide HTF plots
~choose number of bars to show (current timeframe only; HTF plots show only 6 bars)
~horizontal position: offset (bars); shift plots right or left. Can be negative
~vertical position: top/middle/bottom
~other formatting options (color, line thickness, show/hide labels, 70/30 lines, 80/20 lines)
~~tips~~
~should be relatively easy to add further indicators, so long as they are 0-100 based; by editing lines 9 and 11
~change the vertical compression of the plots by playing around with the numbers (+100, -400, etc) in lines 24 and 25

OHLC MTFThe script allows you to plot the opening, highest, lowest and closing (ohlc) values of a previous candle.
Settings :
- "Time Frame" : allows you to choose the reference time frame;
- "Offset" : sets which candle to select the data from.
Ex : If you select "1 day" as the time frame and "1" as the offset, the OHLC values of yesterday's daily candle will be displayed (regardless of your current time frame).
