Pulse DPO: Major Cycle Tops and Bottoms█ OVERVIEW
Pulse DPO is an oscillator designed to highlight Major Cycle Tops and Bottoms .
It works on any market driven by cycles. It operates by removing the short-term noise from the price action and focuses on the market's cyclical nature.
This indicator uses a Normalized version of the Detrended Price Oscillator (DPO) on a 0-100 scale, making it easier to identify major tops and bottoms.
Credit: The DPO was first developed by William Blau in 1991.
█ HOW TO READ IT
Pulse DPO oscillates in the range between 0 and 100. A value in the upper section signals an OverBought (OB) condition, while a value in the lower section signals an OverSold (OS) condition.
Generally, the triggering of OB and OS conditions don't necessarily translate into swing tops and bottoms, but rather suggest caution on approaching a market that might be overextended.
Nevertheless, this indicator has been customized to trigger the signal only during remarkable top and bottom events.
I suggest using it on the Daily Time Frame , but you're free to experiment with this indicator on other time frames.
The indicator has Built-in Alerts to signal the crossing of the Thresholds. Please don't act on an isolated signal, but rather integrate it to work in conjunction with the indicators present in your Trading Plan.
█ OB SIGNAL ON: ENTERING OVERBOUGHT CONDITION
When Pulse DPO crosses Above the Top Threshold it Triggers ON the OB signal. At this point the oscillator line shifts to OB color.
When Pulse DPO enters the OB Zone, please beware! In this Area the Major Players usually become Active Sellers to the Public. While the OB signal is On, it might be wise to Consider Selling a portion or the whole Long Position.
Please note that even though this indicator aims to focus on major tops and bottoms, a strong trending market might trigger the OB signal and stay with it for a long time. That's especially true on young markets and on bubble-mode markets.
█ OB SIGNAL OFF: EXITING OVERBOUGHT CONDITION
When Pulse DPO crosses Below the Top Threshold it Triggers OFF the OB signal. At this point the oscillator line shifts to its normal color.
When Pulse DPO exits the OB Zone, please beware because a Major Top might just have occurred. In this Area the Major Players usually become Aggressive Sellers. They might wind up any remaining Long Positions and Open new Short Positions.
This might be a good area to Open Shorts or to Close/Reverse any remaining Long Position. Whatever you choose to do, it's usually best to act quickly because the market is prone to enter into panic mode.
█ OS SIGNAL ON: ENTERING OVERSOLD CONDITION
When Pulse DPO crosses Below the Bottom Threshold it Triggers ON the OS signal. At this point the oscillator line shifts to OS color.
When Pulse DPO enters the OS Zone, please beware because in this Area the Major Players usually become Active Buyers accumulating Long Positions from the desperate Public.
While the OS signal is On, it might be wise to Consider becoming a Buyer or to implement a Dollar-Cost Averaging (DCA) Strategy to build a Long Position towards the next Cycle. In contrast to the tops, the OS state usually takes longer to resolve a major bottom.
█ OS SIGNAL OFF: EXITING OVERSOLD CONDITION
When Pulse DPO crosses Above the Bottom Threshold it Triggers OFF the OS signal. At this point the oscillator line shifts to its normal color.
When Pulse DPO exits the OS Zone, please beware because a Major Bottom might already be in place. In this Area the Major Players become Aggresive Buyers. They might wind up any remaining Short Positions and Open new Long Positions.
This might be a good area to Open Longs or to Close/Reverse any remaining Short Positions.
█ WHY WOULD YOU BE INTERESTED IN THIS INDICATOR?
This indicator is built over a solid foundation capable of signaling Major Cycle Tops and Bottoms across many markets. Let's see some examples:
Early Bitcoin Years: From 0 to 1242
This chart is in logarithmic mode in order to properly display various exponential cycles. Pulse DPO is properly signaling the major early highs from 9-Jun-2011 at 31.50, to the next one on 9-Apr-2013 at 240 and the epic top from 29-Nov-2013 at 1242.
Due to the massive price movements, the OB condition stays pinned during most of the exponential price action. But as you can see, the OB condition quickly vanishes once the Cycle Top has been reached. As the market matures, the OB condition becomes more exceptional and triggers much closer from the Cycle Top.
With regards to Cycle Bottoms, the early bottom of 2 after having peaked at 31.50 doesn’t get captured by the indicator. That is the only cycle bottom that escapes the Pulse DPO when the bottom threshold is set at a value of 5. In that event, the oscillator low reached 6.95.
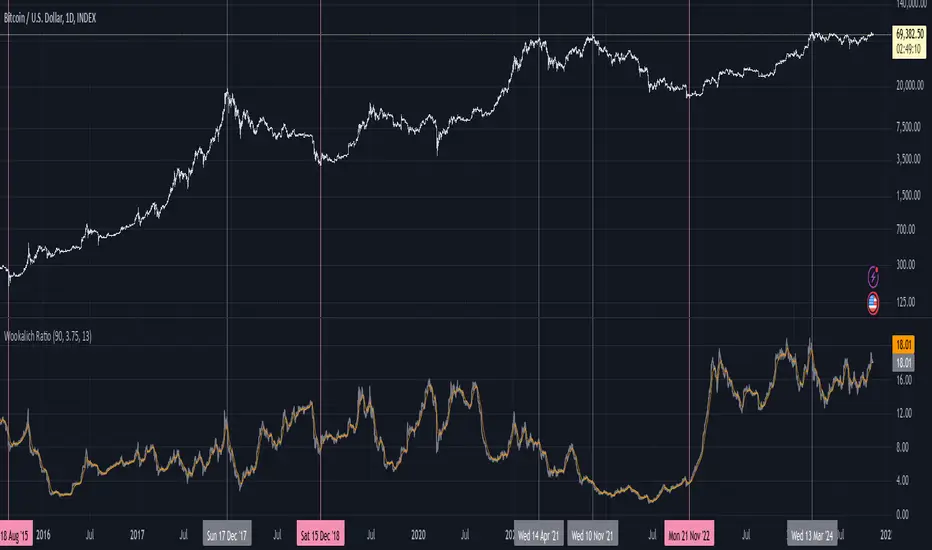
Bitcoin Adoption Spreading: From 257 to 73k
This chart is in logarithmic mode in order to properly display various exponential cycles. Pulse DPO is properly signaling all the major highs from 17-Dec-2017 at 19k, to the next one on 14-Apr-2021 at 64k and the most recent top from 9-Nov-2021 at 68k.
During the massive run of 2017, the OB condition still stayed triggered for a few weeks on each swing top. But on the next cycles it started to signal only for a few days before each swing top actually happened. The OB condition during the last cycle top triggered only for 3 days. Therefore the signal grows in focus as the market matures.
At the time of publishing this indicator, Bitcoin printed a new All Time High (ATH) on 13-Mar-2024 at 73k. That run didn’t trigger the OB condition. Therefore, if the indicator is correct the Bitcoin market still has some way to grow during the next months.
With regards to Cycle Bottoms, the bottom of 3k after having peaked at19k got captured within the wide OS zone. The bottom of 15k after having peaked at 68k got captured too within the OS accumulation area.
Gold
Pulse DPO behaves surprisingly well on a long standing market such as Gold. Moving back to the 197x years it’s been signaling most Cycle Tops and Bottoms with precision. During the last cycle, it shows topping at 2k and bottoming at 1.6k.
The current price action is signaling OB condition in the range of 2.5k to 2.7k. Looking at past cycles, it tends to trigger on and off at multiple swing tops until reaching the final cycle top. Therefore this might indicate the first wave within a potential gold run.
Oil
On the Oil market, we can see that most of the cycle tops and bottoms since the 80s got signaled. The only exception being the low from 2020 which didn’t trigger.
EURUSD
On Forex markets the Pulse DPO also behaves as expected. Looking back at EURUSD we can see the marketing triggering OB and OS conditions during major cycle tops and bottoms from recent times until the 80s.
S&P 500
On the S&P 500 the Pulse DPO catched the lows from 2016 and 2020. Looking at present price action, the recent ATH didn’t trigger the OB condition. Therefore, the indicator is allowing room for another leg up during the next months.
Amazon
On the Amazon chart the Pulse DPO is mirroring pretty accurately the major swings. Scrolling back to the early 2000s, this chart resembles early exponential swings in the crypto space.
Tesla
Moving onto a younger tech stock, Pulse DPO captures pretty accurately the major tops and bottoms. The chart is shown in logarithmic scale to better display the magnitude of the moves.
█ SETTINGS
This indicator is ideal for identifying major market turning points while filtering out short-term noise. You are free to adjust the parameters to align with your preferred trading style.
Parameters : This section allows you to customize any of the Parameters that shape the Oscillator.
Oscillator Length: Defines the period for calculating the Oscillator.
Offset: Shifts the oscillator calculation by a certain number of periods, which is typically half the Oscillator Length.
Lookback Period: Specifies how many bars to look back to find tops and bottoms for normalization.
Smoothing Length: Determines the length of the moving average used to smooth the oscillator.
Thresholds : This section allows you to customize the Thresholds that trigger the OB and OS conditions.
Top: Defines the value of the Top Threshold.
Bottom: Defines the value of the Bottom Threshold.
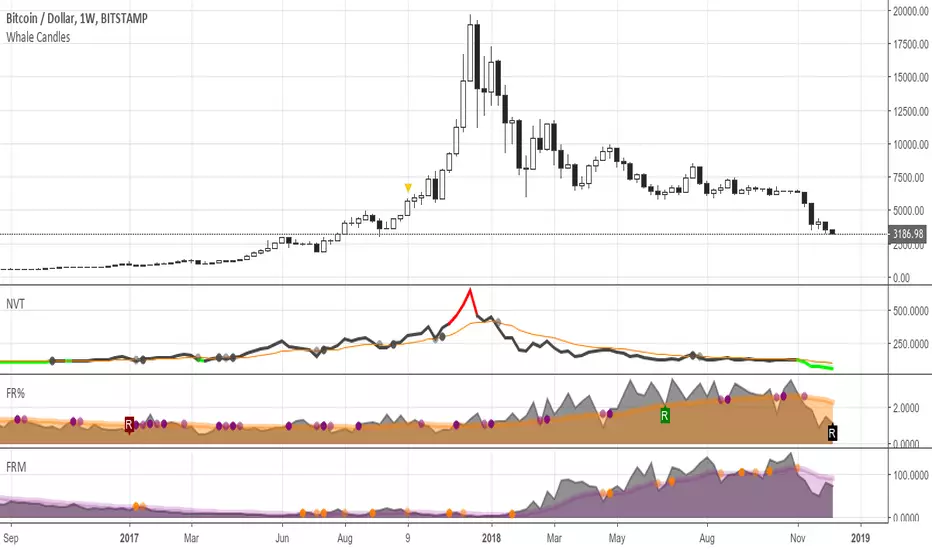
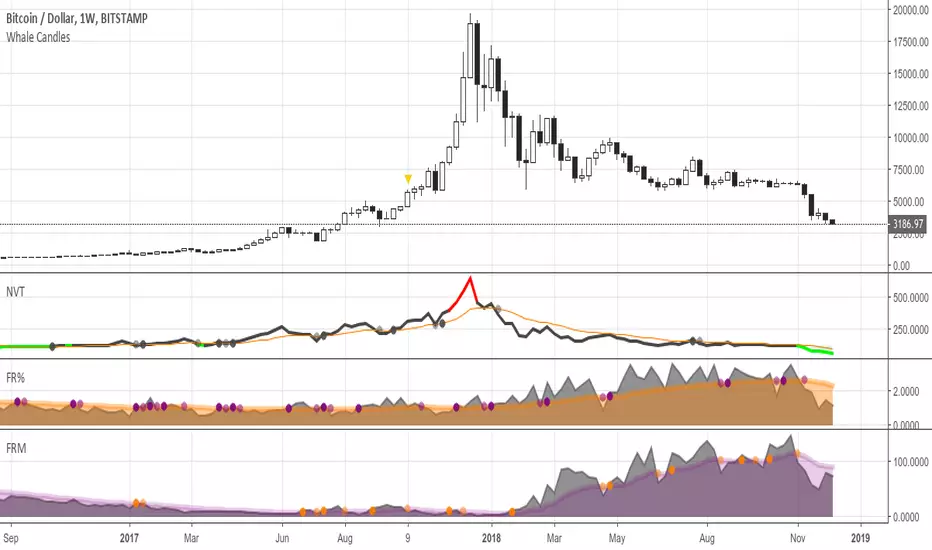
NVT

NVT Z-ScoreNVT Z-Score Script:
Data Source and Calculation: This script calculates the NVT ratio by dividing the market cap (assumed from QUANDL data) by a 90-day MA of the transaction volume (also from QUANDL), similar to the NVTS calculation. However, the adaptation lies in further analyzing the NVT ratio through a Z-score approach, not explicitly described in the original NVTS methodology.
Z-Score Analysis: The script calculates the mean and standard deviation of the NVT ratio over a user-defined period (daysForMean, defaulting to 180 days) and then computes the Z-score of the current NVT ratio relative to this historical data. This Z-score analysis introduces a standardized way of understanding the NVT ratio's deviation from its historical average, offering a nuanced view of market valuation states.
Visualization and Dynamic Zones: The visualization emphasizes Z-score-based dynamic zones (green, yellow, and red), determined by the stdDevMultiplier. These zones are plotted and filled on the chart, providing visual cues for interpreting the NVT ratio's current state in relation to its historical norm. This aspect significantly differs from the traditional NVTS approach by directly incorporating the concept of standard deviation and Z-scores into the analysis.

(mab) Dynamic Bitcoin NVT SignalBitcoin`s NVT is calculated by dividing the Network Value (market cap) by the USD volume transmitted through the blockchain daily. Note this equivalent of the bitcoin token supply divided by the daily BTC value transmitted through the blockchain, NVT is technically inverse monetary velocity.
Credits go to Willy Woo for creating the Network Value Transaction Ratio (NVT). Credits go also to Dimitry Kalichkin improving NVT and creating the NVT Signal (NVTS).
According to its creator, the NVT Ratio is somewhat similar to the PE Ratio used in equity markets. When Bitcoin`s NVT is high, it indicates that its network valuation is outstripping the value being transmitted on its payment network, this can happen when the network is in high growth and investors are valuing it as a high return investment, or alternatively when the price is in an unsustainable bubble.
I created this indicator because the NVT indicator I was using suddenly stopped working. I tried a number of other NVT indicators, but all of them seem to have the same problem and stopped updating after a certain date. The cause is that the data feed from 'Quandl' that is used by most NVT indicators is no longer updated through the previous API.
Instead TradingView created a special API to access 'Quandl" data. This indicator not only uses the new API for 'Quandl', it can also access data from other providers like 'Glassnode', 'CoinMetrics' and 'IntoTheBlock'. However, the 'Quandl' data feed seems to produce the best results with this indicator.
The indicator provides dynamically adjusting overbought and oversold thresholds based on a two year moving average and standard devition with adjustable multipliers. It also implements alerts for NVT going into overbought, oversold or crossing the moving average.
Version 1.0
--
Version history
0.1 Beta
- Initial version
1.0
- First release

TTP NVT StudioNVT Studio is an indicator that aims to find areas of reversal of the Bitcoin price based on the extreme areas of Network Value Transaction.
Instructions:
- We recommend using it on INDEX:BTCUSD
- Use the daily or weekly timeframe
The indicator works as an oscillator and offers to visualisation modes.
1) Showing the short term oscillations of NVT showing signals in potential areas of reversal.
2) The actual value of NVT displayed. When in green is an area of value and in red when its overextended.
This indicator can be used based on the signals or based on breakouts of trend lines drawn in the oscillator mode.
Red/green dots: signal type 1 - extremes with confirmation, these might trigger late
Yellow/Orange: signal type 2 - extremes without confirmation, might trigger too soon

NVTNetwork Value to Transactions Ratio (NVT) is defined as the ratio of market capitalization divided by transacted volume.
NVT Ratio can be thought of as an indicator that measures whether the blockchain network is overvalued or not.
If it is upper than red line, it means overvalued.
NVT Golden Cross targets to generate short or long signals by comparing the short-term trend of NVT and the long-term trend of NVT. If the short-term trend is way greater than the long-term trend is, the network can be interpreted as overpriced and will soon revert to mean value, meaning short signal. Similarly, the opposite case may imply a long signal.
Over the red line is short signal and under the green line is long signal.
You can find divergence in this indicator.
There are two sources
cryptocap
glassnode

NVT & HV ComboFamous NVT indicator combinated with HV
Use with BTC weekly or daily chart . Blue line represents HV 40 threshold.
Interpretation:
Red above threshold -> regular bearish
Green above threshold-> regular bullish
Red crossing threshold from below to above -> very bearish
Green crossing threshold from below to above -> very bullish

NVT + HV CombinationFamous NVT indicator combinated with HV
Use with BTC weekly or daily chart. Yellow line represents HV 40 threshold.
Interpretation:
White above threshold -> regular bearish
Red above threshold-> regular bullish
White crossing threshold from below to above -> very bearish
White crossing threshold from below to above -> very bullish

Cryptocurrency Super-Cycle IndicatorThe Cryptocurrency Super-Cycle Indicator employs a custom volume-weighted algorithm to confirm the overall, long-term trend. This works well on the 4H timeframe, but can be used on any timeframe. The indicator also plots a modified Network Value to Transactions (NVT) Ratio to identify overbought and oversold areas where price could soon reverse.

TMA + OSMA Scalping SystemSystem is based on TMA Bands + OSMA + EMA Zone. Signal is generated when:
- price recently touched lower or upper band
- price is crossing EMA Zone
- OSMA is aligned in direction of trade to be taken
Natural Target would be opposite band set by TMA.

QuantNomad - Bitcoin NVT/NVTSIn this script I included 2 quite interesting indicators for Bitcoin:
* NVT (Network Value to Transactions Ratio)
* NVTS (NVT Signal)
Both indicators are based on Bitcoin Network Value (Market Cap) and 24h transaction volume.
For both these values I'm using Quandl datasets from Blockchainc.com:
market_cap: QUANDL:BCHAIN/MKTCP
transac_vol: QUANDL:BCHAIN/ETRVU
Calculation for both indicators are pretty simple:
NVT = median(market_cap / transac_vol, 14 bars)
NVTS = market_cap / sma(transac_vol, 90 bars)
NVT and NVTS are cryptocurrency's answers to P/E ratio. They can help you to understand if bitcoin is under/overvalued.
When NVT or NVTS is relatively high it can be a pretty good point to short bitcoin, if it's low it good time to buy bitcoin.
NVT Ratio - was created by Willy Woo
NVT Signal - was created by Dimitry Kalichkin
Because of different sources of transaction volume data, these indicators can differ in values from originals, but magnitude should be the same.
This is a pretty simple example where you can select only static overbought/oversold levels and when indicator will be above/below it you will see in changing in color.
I have many more things in my head how these indicators can be developed further and what strategies can be derived from them, but as is they can be a pretty good base for you. Will share my advanced findings later.
NVT Dynamic Colored with Signals [aamonkey]NVT Dynamic
This is the dynamic version of my " Bitcoin Network Value to Transactions " indicator.
The dynamic NVT indicator is based on the Network Value to Transactions.
Definition:
NVT = Network Value / Daily Transaction Volume
Advantages:
Because BTC is a very young asset, it can be a good idea to have relatively high and low NVT values that change over time.
Signals:
When the NVT turns green = buy opportunity
NVT turns red = sell opportunity

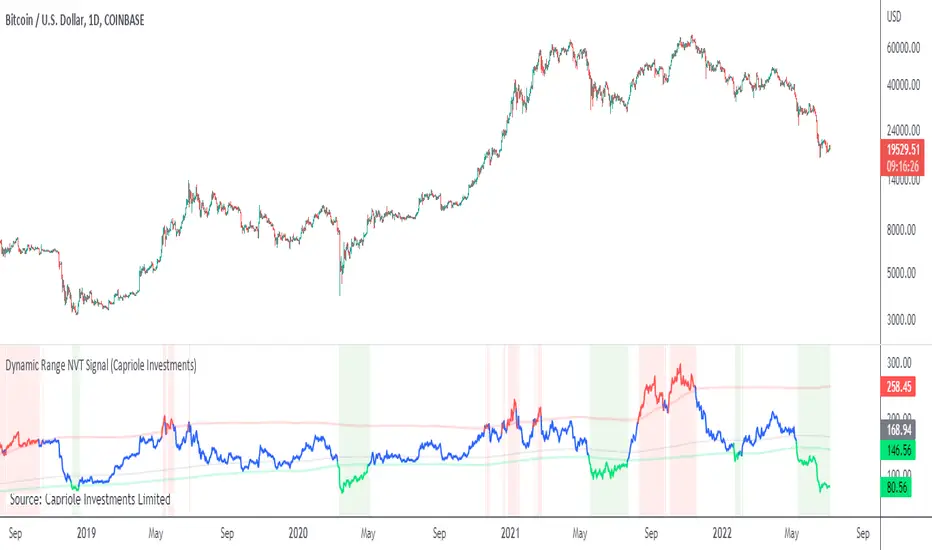
Dynamic Range NVT SignalABOUT DYNAMIC RANGE NVT SIGNAL
NVT Signal (Credit: Willy Woo and Dmitry Kalichkin) is akin to a "PE" ratio for Bitcoin , and can be used to identify when Bitcoin is overbought or oversold based on the relative value of transactions sent across the network.
This indicator includes a 2 year moving average and standard deviation to identify outlier values, instead of declaring a static high-low range for relative valuation.
THEORY
A dynamic "high-low" range was chosen for the following reasons:
- Bitcoin is only 10 years old, it is likely that relatively "high" and relatively "low" NVT values will change with time, as have PE ratios over the last century.
- Some transactions are now made off-chain (eg. Liquid Network's private side-chain which is used by many major exchanges). If this trend continues, we can expect "normal" NVT ranges to increase with time (as the relative portion of public on-chain transaction values decreases).
CALCULATION
- NVT = Circulating Market Cap / 90 average On-chain Transaction Value*
- Overbought (default): NVT > 2-year mean + 2*standard deviations. I.e. NVT Signal is in the top 2.5% of values for the prior 2 years.
- Oversold (default) NVT < 2-year mean - 0.5 * standard deviations.**
*Data source: Blockchain.info, estimated transaction value does not include returned to sender as change.
**Oversold under 2-year mean was chosen due to the skewness of NVT Signal, it is not normally distributed. For example: NVT Signal has never been less than the 2-year mean - 2* standard deviations. This may change in the future.
NOTES ON USAGE
- Use with care. Bitcoin can remain "overbought" or "oversold" for extended periods (eg. 2015-2016).
- As Bitcoin ages, the validity of NVT Signal will need to be monitored. Particularly with respect to potentially increasing use of side-chains, private transactions and potentially the lightning network.
- It is likely that a 2-year “look back period” for calculating mean and standard deviation will not be sufficient in the decades to come. As Bitcoin matures and stabilizes (some time in the future), a longer "look back period" should probably be used. To allow for this, the defaults for this indicator can be easily adjusted.
NVT (original) - Network Value to TransactionsI'm reposting the NVT indicator that was originally available for public use in TradingView.
NVT Signal is a Bitcoin-specific study to get a view on data flowing through the blockchain.
It has been used to predict tops in Bitcoin price.
I've set up this indicator for it to be possible to base the calculations on custom:
Transaction Periods
Overbought levels
Oversold levels
The indicator plots in any BTCUSD spot, futures, BLX index and BTCEUR.
It paints in intraday time frames, but Daily time frame is the correct one to interpret the 'official' read of it.
For that reason, I've enabled by default an option that forces the NVT to display the Daily value even though the time frame could be higher or lower.
Please consider unchecking this setting if you'd like to experiment with another type of reads (i.e. in weekly time frame).
Additionally, it allows the following settings:
Signal Line Plot . Added the possibility to plot a Signal Line based on EMA.
Signal Line Cross . Show/Hide Crosses with the Signal Line.
Alerts based on Signal Line . Predefined Tradingview Alerts on the Cross of the Signal Line.
OverBought Background . Highlight the background based on OB Condition.
OverBought Alert . Predefined Tradingview Alerts based on OB Condition.
OverSold Background . Highlight the background based on OS Condition.
OverSold Alert . Predefined Tradingview Alerts based on OS Condition.
Please check our blog article showing multiple practical ideas about trading the NVT indicator: medium.com
Credit for this idea goes to Willy Woo woobull.com
and Dmitry Kalichkin twitter.com

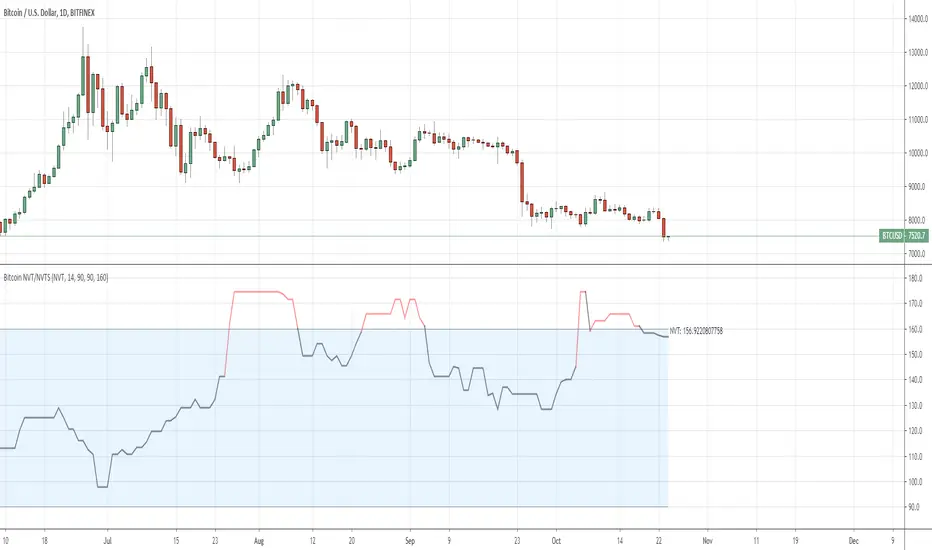
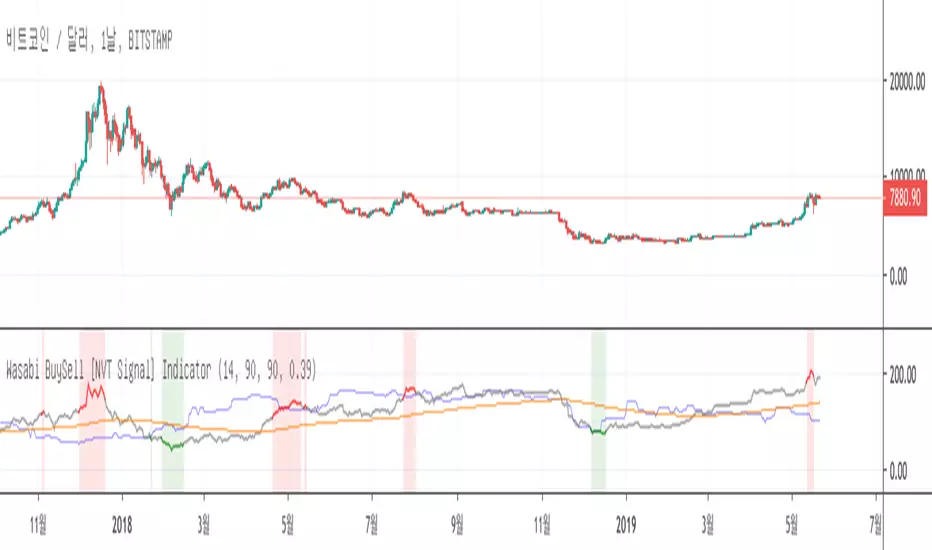
Wasabi BuySell [NVT Signal] IndicatorThis is Wasabi's optimized NVT Signal indicator.
Basically, NVT Signal (NVTS) is a derivative of NVT Ratio by Dmitry Kalichki, which provides more emphasis on predictive signaling ahead of price peaks and bottoms.
The basic calculation is based on the following equation:
NVTS = Network Value / 90d MA of Daily Transaction Value.
와사비 입니다.
현 보조지표는 와사비가 옵티마이즈한 NVT Signal 지표입니다.
기본적으로 NVT Signal (NVTS)는 Dmitry Kalichki 에 의해 고안 되었으며, 가격의 꼭지점이나 바닥에 앞서서 미리 예상하는데 보다 더 중점을 두고 있는 NVT Ratio 변종입니다.
기본적인 계산식은 다음과 같습니다.
NVTS = 네트웍 밸류 / 일일 트랜잭션 밸류의 90일 이동평군
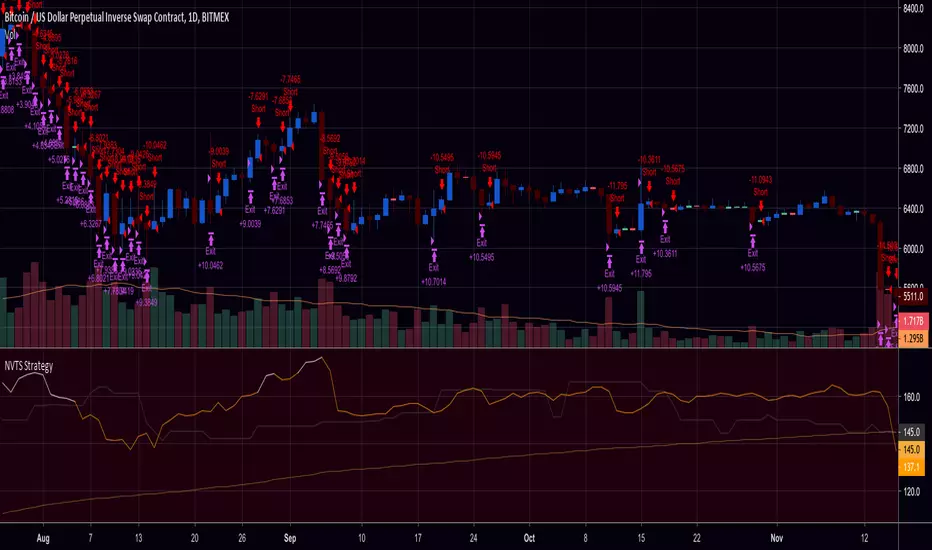
NVT Signal with RMA and Thresholds (Strategy / Backtest)This is the strategy w/ backtester and trailing-stop / stop-loss for kishin's NVT alerts
Bitcoin Wookalich Ratio (NVT)The Wookalich Ratio is an indicator derived from the NVT Signal . This is a tool used in Bitcoin markets to predict tops and bottoms.
The Wookalich Ratio aims to correct long-term inflation skewing through the use of a dilution factor.
I've setup this indicator for it to be possible to base the calculations on custom:
Transaction Periods
Overbought levels (110 by default)
Oversold levels (32 by default)
Credit for this idea goes to cryptopoiesis twitter.com
You're welcome to use add it to your charts.
FRM - Bitcoin Fee Ratio MultipleBitcoin Fee Ratio Multiple (FRM) is a BTC specific study that measures its strength as a Store of Value.
FRM may be a solid alternative to the Network Value to Transaction (NVT) indicator.
A low FRM suggests that Bitcoin can maintain its current security budget (miner revenue) without having to rely on an inflationary subsidy.
Conversely, a high FRM suggests that Bitcoin will require heavy inflation via block reward subsidies in order to maintain its existing security levels.
This means that in order to reach current security budget levels without block reward subsidies, transaction fee revenue for each chain has to grow as many times as the FRM indicator points.
We would naturally expect a strong inverse correlation between large price movements and FRM.
Strong price action in either direction is usually accompanied by a surge in volume →
More volume suggests more people are moving assets to exchanges →
More people transacting with crypto asset means higher transaction fee revenue →
Therefore, higher transaction fee revenue means lower FRM
In the long run the correlation between price and FRM would tend to disappear.
FRM for capped supply assets would continue to decline over time, eventually reaching something close to 1, the point at which transaction fee revenue makes up 100% of total miner revenue.
Some notes about NVT.
NVT is used to measure a chain’s strength as a payment network compared to its market value. A low NVT may suggest that a network is undervalued compared to the service it is providing as a settlement layer.
NVT and FRM will not always be correlated. A chain could feasibly have a high number of transactions and a low network value, and therefore a low NVT, while simultaneously having a high FRM depending on the current size of block rewards and average transaction fee.
Moreover, NVT is far easier to spoof than FRM: one merely need spam the network with low fee transactions. By contrast, significant manipulation of FRM would by definition require significant cost as FRM measures the aggregate value of transaction fees rather than count.
User notes:
This study only plots in Bitcoin charts.
It plots in Daily, Weekly and Monthly time frames.
It doesn't render in intraday charts.
Credit for this idea goes to Matteo Leibowitz: medium.com
Based on the story: medium.com
You're welcome to add it to your charts. Hope you find it useful!
FR(%) - Bitcoin Fee RatioBitcoin Fee Ratio is a BTC specific study aiming to replace the ever-misleading ‘market capitalization’ (marketcap).
It answers to the following question:
“If block rewards disappeared tomorrow what percentage of economic volume would we have to pay in fees to replace them”
A low FR means that users can transact securely while simultaneously paying a minimal % of each transaction as a fee.
Conversely, a high FR means that users have to pay a high % of each transaction as a fee in order to transact securely.
User notes:
This study only plots in Bitcoin charts.
It plots in Daily, Weekly and Monthly time frames.
It doesn't render in intraday charts.
The FR value is expressed in relative (%) terms.
Credit for this idea goes to Matteo Leibowitz: medium.com
Based on the story: medium.com
You're welcome to add it to your charts. Hope you find it useful!
Bitcoin - NVT and Velocity [NeoButane]Different Bitcoin studies that include more than price. Averaging types are arithmetic, geometric, logarithmic, and something that's supposed to be harmonic.
This has:
NVT Ratio
NVT Signal
Velocity
Sources:
NVT - medium.com
Velocity - charts.woobull.com

Bitcoin Studies (NVT et. al) [NeoButane]Currently studying the effect of NVT on price action and volume.
