Options
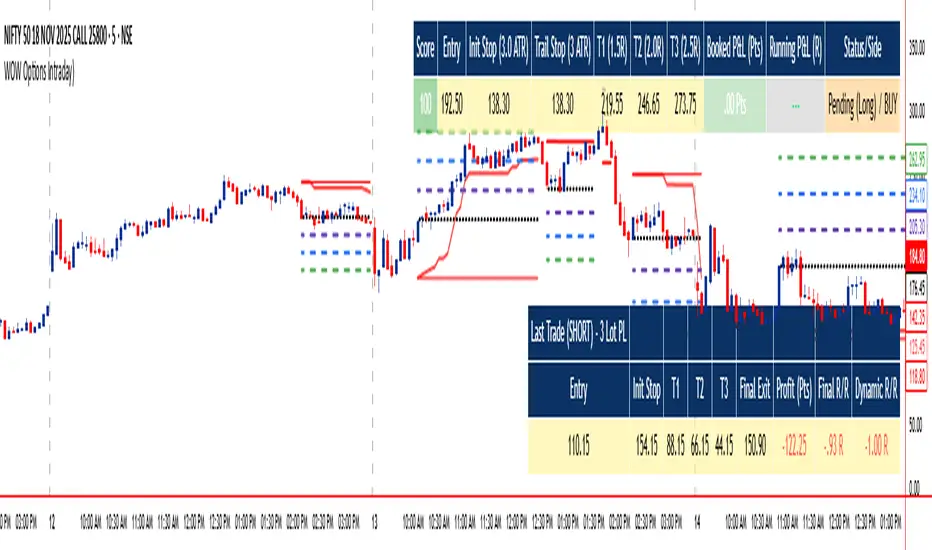
WOW Options IntradayWOW Options Intraday Indicator is a sophisticated tool designed for intraday options traders, optimized for the 5-minute timeframe. It combines advanced momentum and trend analysis, using SuperTrend, QQE RSI, and EMA signals to generate directional entry and exit points with a unique three-tier target system (3 lots). The indicator features dynamic trailing stops, smart cooling down logic to manage risk and avoid overtrading, and customizable visual styles including colors and table layouts for personalized user experience.
Designed primarily for buying options with preference for in-the-money (ITM) strikes and three profit targets, it supports prudent trade management suitable for both options buying and writing strategies. Traders should prefer taking trades during active hours (post 9:20 am to before 3:00 pm) and select strikes from the nearest expiry, shifting to the next expiry on expiry day. This tool provides clear visual entries, stops, and targets directly on the chart alongside detailed trade summary tables.
WOW Options empowers options traders with automated decision-making, precise risk control, structured exits, and flexible styling to maximize intraday opportunities effectively.
Asia and London Static GEX Levels ConverterUses GEX price from RTH Market close and plots them on NQ. Remains static since options market is closed during ETH and uses the levels and plots them. Do not use in RTH since options prices change. Made for my style of trading personally since I wanted to use GEX Levels outside of RTH

Floos 💸This is the final Script .. after long time trading Just "WaW"
ألافضل بلا منازع الي حاب يجرب يراسلني
Floos 💸 Complete is an advanced trading indicator designed for SPX (S&P 500) options trading, combining:
- AI-enhanced London/New York session analysis
- Pre-market predictions
- Swing high/low detection
- EMA crossover signals with accuracy tracking
- Dynamic support/resistance levels

Quarterly Theory ChecklistThis indicator gives you a fully customizable trading checklist directly on your chart, helping you stay consistent and avoid emotional or impulsive trades.
You can pin the checklist to one specific symbol, so it only appears when you’re analyzing the pair or asset you want to track. Each checklist item has:
A checkbox you can manually toggle
A text label you can customize
Automatic coloring (green check ✔ or red cross ✘)
The indicator also calculates a Trade Score based on how many criteria you’ve checked off.
This score updates live and is color-coded:
Green = 75–100% confidence
Yellow = 50–74%
Red = below 50%
You can choose:
The position of the table
Text size
Header text & colors
Border color
Number of visible checklist rows (1–8)
Enable or disable the Trade Score
Everything is organized inside a clean 2-column checklist table with a polished UI.
Perfect for:
→ System traders
→ Checklists (HTF bias, POIs, confirmations, timing, etc.)
→ Evaluations & trade grading
→ Staying disciplined and rule-based

WinningStocks2020 Crude Positional StrategyThis Indicator is specifically designed to Identify the Trend and Reversals. Accuracy is higher than any other existing Indicator on CRUDE.
Apply your strategies in accordance to it.

Bullish ATR Level indicatorThis indicator is used by OVTLYR Golden Ticket Trading strategy to determine the stop loss and option rollover levels. Super simple indicator that just shows the current price, -1/2 ATR for a stop loss and 1 and 2 ATR levels for possible take profit or option rollover points.

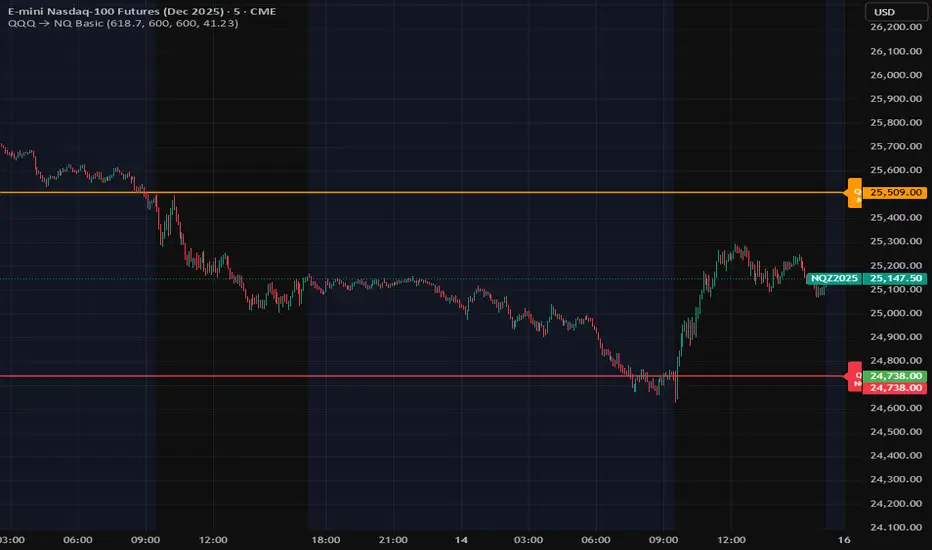
QQQ Levels on NQ# QQQ Levels on NQ - Professional Support & Resistance Indicator
## 🎯 Overview
Elevate your NASDAQ futures trading with precision-engineered QQQ support and resistance levels. This professional-grade indicator displays critical QQQ price levels directly on your NQ (E-mini NASDAQ-100) and MNQ (Micro E-mini NASDAQ-100) charts, providing institutional-quality analysis for retail traders.
## ⚡ Key Features
### 📊 Dual-Level System
- Whole Number Levels : 10 closest round QQQ levels around current price
- Half Levels : 0.5 increment levels for granular analysis
- Smart Scaling : Automatically converts QQQ levels to NQ/MNQ prices
### 🎨 Professional Visualization
- Clean Design : Minimalist lines that don't clutter your chart
- Customizable Colors : Choose your own colors for whole and half levels
- Historical Extension : Lines extend across your entire chart for context
- Dynamic Labels : Real-time QQQ price display with clear level identification
### ⚙️ Intelligent Features
- Auto-Detection : Works seamlessly on QQQ, NQ, and MNQ charts
- Real-Time Updates : Levels adjust automatically as QQQ price moves
- Performance Optimized : Efficient code that won't slow down your charts
- Flexible Settings : Toggle levels on/off based on your trading style
## 🎯 Perfect For
- NQ Futures Traders seeking QQQ correlation levels
- MNQ Micro Futures traders needing precise entry/exit points
- QQQ Options Traders analyzing support/resistance zones
- Day Traders requiring quick visual reference points
- Swing Traders identifying key technical levels
## 📈 How It Works
The indicator fetches real-time QQQ prices and calculates the 10 closest whole number levels (e.g., 480, 481, 482) plus half levels (480.5, 481.5, 482.5) around the current price. When applied to NQ or MNQ charts, it automatically scales these levels to match futures pricing, giving you precise QQQ-correlated support and resistance zones.
## 🔧 Customization Options
- QQQ Price Label : Toggle on/off
- Whole Number Levels : Show/hide with custom colors
- Half Levels : Show/hide with custom colors and transparency
- Visual Styling : Personalize colors to match your chart theme
## 💡 Trading Applications
- Support/Resistance : Identify key psychological levels
- Entry/Exit Points : Use levels for precise trade execution
- Risk Management : Set stops and targets at significant levels
- Market Structure : Understand institutional price zones
- Confluence Analysis : Combine with other technical indicators

Hours ScholarshipsThis script displays the real-time local time of the London, New York, and Tokyo trading sessions directly on the chart. It automatically calculates whether each market is currently open or closed and presents all information inside a dynamic table that adjusts to the user’s layout settings.
🔹 Technical Features
Real Local Time Calculation:
Uses timezone-specific timestamps to show accurate local time for each financial center, independent of the user's own timezone.
Session Status Detection:
London, New York, and Tokyo opening hours are calculated using actual market schedules, including Tokyo’s split session.
Dynamic Table Rendering:
The table rebuilds itself automatically on the final bar, adjusting to the user’s size and position preferences. Only the selected sessions are shown.
Smart Alert System:
Each market includes:
a user-defined target time (HH:MM)
an individual offset in minutes
The script computes a final adjusted alert time for each market (target time − offset), with full support for midnight rollover.
High-Timeframe Compatibility:
Local time is safely recalculated using security calls on 60-minute data when needed, ensuring stable behavior even on higher timeframes.
🔹 Why This Script Is Unique
Most session-time indicators only display opening hours or highlight sessions on the chart. This script goes further by combining:
Real-time local clock display for three markets
Per-session customizable alert times
Independent minute offsets for London, New York, and Tokyo
Automatic alert-time calculation with rollover handling
Dynamic UI construction and per-row visibility control
This combination of local time tracking, intelligent alert logic, and dynamic multi-session layout is not available in standard public indicators, which justifies the script as unique in both function and design.

B21V21This Pine Script is designed to provide both previous-day reference levels and real-time market data, making it suitable for live trading applications. It automatically retrieves all key historical levels—such as PDH, PDL, PDC, and PDO—for the currently selected strike as well as the corresponding opponent strike.
The script allows users to compare two instruments or strikes by selecting either a self-opponent view or any required strike for cross-analysis. Important intraday levels are displayed dynamically during live market conditions, enabling traders to make informed and timely decisions.

ProChart NF50 1H📘 Nifty 50 – 1 Hour Options Trading Indicator (By- Dr Bean)
This indicator is designed specifically for Nifty 50 Index on the 1-hour timeframe, optimized for options trading (For Call entries based on index direction).
It automatically identifies high-probability Buy and Sell signals, using a combination of trend structure, volatility filters, and momentum logic. The goal is to capture clean directional moves with controlled risk.
🔍 What the Indicator Does
✅ 1. Generates Buy & Sell Signals
Buy signal appears when the trend flips bullish and volatility confirms the momentum.
Sell signal appears when upward momentum weakens and reversal logic triggers.
This helps option traders decide when to enter CE (Call) or Exit positions with better timing.
📈 Example of Signals on Chart
The chart shows:
Buy signals at early trend stages
Sell signals when momentum weakens
Take-Profit markers based on trailing logic
Trend structure lines to visualize the move
This makes spotting trend continuation and reversal trades extremely simple.
📊 Backtested Performance
Based on historical Nifty 50 (1-hour timeframe): (On 14/11/2025)
Total Trades: 329
Win Rate: 51.67%
Profit Factor: 1.83
Largest Win: ₹944.05
Largest Loss: –₹307.15
Average R Multiple: 0.46
Max Win Streak: 7
Max Loss Streak: 6
These stats show high reward-to-risk stability, with controlled losses and strong upside streaks.
🎯 Why This Indicator Works Well for Options
Nifty 50 moves cleanly on higher timeframes
1-hour candles reduce noise
Signals are not overly frequent
Momentum and ATR-based filters help avoid choppy markets
Easy visual signals help traders take CE decisions confidently
This indicator is ideal for:
Intraday & Swing Options Traders
Traders who prefer rule-based signals
Nifty Index direction traders
💡 Overall Purpose
This tool simplifies the process of identifying:
Trend continuation
Momentum breakouts
Profit-taking zones
Early reversals
It helps option traders take trades based on clear, objective, visual signals, instead of guesswork.
⏱️ Recommended Timeframe:
Optimized for 1-Hour Charts
💬 Note : This is a paid indicator. Access is granted upon subscription.
For inquiries, trial access, or support, please contact us directly via TradingView or our official social channels.
Market Risk Applies – All trading involves risk. Always use proper risk management and never rely solely on any single indicator for trading decisions.
Backtesting Recommended – Before live trading, test this indicator on past data and in simulated environments to understand its behavior and limitations.
Disclaimer : We and our private indicator are not registered with SEBI (India), the SEC (U.S. Securities and Exchange Commission), or any other financial regulatory authority. The information provided is purely for educational and informational purposes and does not constitute financial or investment advice. Please consult a registered financial advisor before making any investment decisions.

GEX / Gamma - SPX Indicator Description – GEX / Gamma (SPX)
This indicator allows you to manually plot your daily +GEX, TRANS-GEX, and –GEX levels on SPX and visualize how price reacts around key gamma zones.
You enter the three levels each morning, and the script automatically draws:
+GEX / TRANS / –GEX zones with an adjustable buffer
Clean labels (e.g., “+GEX: 6850”) pinned to the right side of the chart
Today-only candle coloring (green above TRANS-GEX, red below)
Zones extend from yesterday’s session through the current session, helping highlight areas where dealer hedging flows may influence volatility, compression, or acceleration.
How to Use
Add the indicator to any intraday SPX chart.
Open settings and enter your +GEX, TRANS-GEX, and –GEX levels for the day.
Adjust the buffer, colors, and label style as needed.
Watch how price behaves as it moves above or below TRANS-GEX and interacts with +/- GEX zones.
Best For
Intraday SPX / ES / SPY
Options traders
Volatility and gamma-aware strategies
Strategy Behind It (Tight Version)
GEX levels help identify where dealer hedging flows can influence SPX price behavior.
+GEX (Positive Gamma)
Market tends to stabilize here. Dealers hedge against price moves, creating mean-reversion and lower volatility.
TRANS-GEX (Transition Level)
Key pivot where gamma flips. Price crossing this level often signals a shift in volatility or intraday direction.
–GEX (Negative Gamma)
Market becomes more reactive. Dealers hedge with price, increasing volatility, momentum, and trend potential.
How traders use it:
Expect resistance or slowdown into +GEX
Watch for potential bottoming or increased volatility –GEX
Use TRANS-GEX as a bias line or trigger for intraday shifts
A move outside of either the +GEX or -GEX will likely result in some type of high volume move.

Lot Size CalculatorLot Size Calculator for Gold (XAU)
This indicator helps traders calculate the proper lot size for Gold (XAU) based on their entry, stop loss, and risk amount in USD.
You can set your entry and stop levels directly on the chart, and adjust your dollar risk from the settings panel.
The indicator measures the distance between entry and stop to calculate the position size that matches your selected risk.
A clean, customizable table displays key values such as Risk, Entry, Stop, Target, Lots, and Pips.
You can easily hide specific rows, change colors, and adjust layout options to fit your chart style.
Designed specifically for Gold traders, this tool provides a simple and visual way to manage risk directly on the chart.

TradeUniv.com Expected MovesTradeUniv.com Expected Moves
See where the market expects stocks to move based on options pricing data. This indicator shows you upper and lower price levels that help identify potential support, resistance, and overextended moves.
What Are Expected Moves?
Expected moves are calculated from option prices and show where the market thinks a stock is likely to trade by the end of the day or week. Think of them as probability zones - when price reaches or crosses these levels, it may signal an unusual
move or potential reversal opportunity.
What You'll See on Your Chart:
• Upper Level (Green) - Expected high for the period
• Lower Level (Red) - Expected low for the period• Midpoint (Gray) - Previous day's closing price (your reference point)
• Shaded Area - The expected trading range between levels
How to Use:
1. Visit www.tradeuniv.com
2. Select your favorite tickers
3. Click "Generate Script" and copy the TradingView input
4. Paste it into this indicator's settings
5. The indicator automatically shows the expected moves for whatever chart you're viewing
Perfect For:
• Day traders planning entry and exit zones
• Identifying when price has moved "too far too fast"
• Spotting potential reversal areas
• Understanding daily volatility expectations
• Planning option strategies around expected ranges
Features:
• Automatically detects daily vs weekly expirations (SPY, IWM, QQQ use daily; others use weekly)
• Customizable colors and line styles
• Price crossing alerts (get notified when price breaks above/below expected levels)
• Works on any timeframe
• Clean, minimal chart display
Important:
• Requires TradeUniv.com free account to generate data
• Refresh your data daily for accurate calculations
• Only shows levels for tickers you selected when generating

FXGringo1.2FXGringo - Decision Points
This indicator identifies support and resistance zones based on reference points provided in the levels field, interpreting them as potential areas of price reaction. From these points, the script plots strength levels, allowing the trader to visualize regions where the price may encounter natural barriers to equilibrium between supply and demand.
Although the internal calculations do not directly reveal the complete methodology, its logic can be compared to concepts similar to gamma levels (GEX), insofar as it seeks to map zones where price movement tends to be more sensitive due to the concentration of positions or relevant market flows.
How the Indicator Works:
Input of External Points:
The user manually provides price points that represent potential support or resistance levels.
Strength Classification:
The indicator processes these points and plots each level based on criteria such as distance from the current price, frequency of occurrence in the history, and pre-calculated volatility variation. This generates a visual and quantitative hierarchy among the provided levels.
Context Analysis:
Based on the interaction between price and these levels, the script identifies and plots zones of greater relevance—where the price tends to react, consolidate, or reverse.
Confluence Analysis:
Observe how the external levels align with peaks, troughs, and volume zones. The overlap of strong levels often indicates areas of great institutional interest.
Risk Management:
Use the identified levels to plan entry and exit points and stop-loss or take-profit placement, based on the relative strength of the levels.
Modern Conceptual Basis: The methodology, although proprietary, can be compared to how gamma levels reflect zones of greater price sensitivity relative to the market's aggregate exposure.
Conclusion:
This indicator acts as an advanced tool for interpreting support and resistance levels, using external data to build a dynamic map of market interest zones. Its operation can be seen as an analogy to gamma levels (GEX), identifying regions where the price tends to react more significantly due to liquidity concentration or position imbalance. This approach provides the trader with a refined view of the areas of influence of large players, assisting in making decisions with greater precision and confidence.

Put Option Profits inspired by Travis Wilkerson; SPX BacktesterPut Option Profits — Travis Wilkerson inspired. This tester evaluates a simple monthly SPX at-the-money credit-spread timing idea: enter on a fixed calendar rule (e.g., 1st Friday or 8th day with business-day shifting) at Open or Close, then exit exactly N calendar days later (first tradable day >= target, at Close). A trade is marked WIN if price at exit is above the entry price (1:1 risk proxy).
The book suggests forward testing 60-day and 180-day expirations to prove the concept. This tool lets you backtest both (and more) to see what actually works best. In the book, profits are taken when the spread reaches ~80% of max credit; losers are left to expire and cash-settle. This backtester does not model early profit-taking—every trade is held to the configured hold period and evaluated on price vs entry at the exit close. Think of it as a pure “set it and forget it” stress test. In live trading, you can still follow Travis’s 80% take-profit rule; TradingView just doesn’t simulate that here. Happy trading!
Features:
Schedule: Day-of-Month (with Prev/Next business-day shift, optional “stay in month”) or Nth Weekday (e.g., 1st Friday).
Entry timing: Open or Close.
Exit: N calendar days later at Close (holiday/weekend aware).
Filters: Optional EMA-200 “risk-on” filter.
Scope: Date range limiter.
Visuals: Entry/exit bubbles (paired colors) or simple win/loss dots.
Table: Overall Win% and N (within range).
Alerts: Entry alert (static condition + dynamic alert() message).
How to use:
[* ]Choose Start Mode (NthWeekday or DayOfMonth) and parameters (e.g., 1st Friday or DOM=8, PrevBizDay).
Pick Entry Timing (Open or Close).
Set Days In Trade (e.g., 150).
(Optional) Enable EMA filter and set Date Range.
Turn Bubbles on/off and/or Dots on/off.
Create alert:
Simple ping: Condition = this indicator -> Monthly Entry Signal -> “Once per bar” (Open) or “Once per bar close” (Close).
Rich message: Condition = this indicator -> Any alert() function call.
Notes:
Keep DOM shift in same month: when a DOM falls on a weekend/holiday, PrevBizDay/NextBizDay shift will stay inside the month if enabled; otherwise it can spill into the prior/next month. (Ignored for NthWeekday.)
Credits: Concept sparked by “Put Option Profits – How to turn ten minutes of free time into consistent cash flow each month” by Travis Wilkerson; this script is a neutral research tool (not financial advice).

Slick Strategy Weekly PCS TesterInspired by the book “The Slick Strategy: A Unique Profitable Options Trading Method.” This indicator tests weekly SPX put-credit spreads set below Monday’s open and judged at Friday’s close.
WHAT IT DOES
• Sets weekly PCS level = Monday (or first trading day) OPEN − your offset; win/loss checked at Friday close.
• Optional core filter at entry: Price ≥ 200-SMA AND 10-SMA ≥ 20-SMA; pause if Price < both 10 & 20 while > 200.
• Reference modes: Strict = Mon OPEN vs Fri SMAs (no repaint); Mid = Mon OPEN vs Mon SMAs
KEY INPUTS
• Date range (Start/End) to limit backtest window.
• Offset mode/value (Points or Percent).
• Entry day (Monday only or first trading day).
• Core filters (On/Off) and Strict/Mid reference.
• SMA settings (source; 10/20/200 lengths).
• Table settings (position, size, padding, border).
VISUALS
• Active week line: Orange = trade taken; Gray = skipped.
• History: Green = win; Red = loss; Purple = skipped.
• Optional week bands highlight active/win/loss/skipped weeks (adjustable opacity).
TABLE
• Shows Date range, Trades, Wins, Losses, Win rate, and Active level (this week’s PCS price).
NOTES
• PCS level freezes at week open and persists through the week.


McMillan Volatility Bands (MVB) – with Entry Logic// McMillan Volatility Bands (MVB) with signal + entry logic
// Author: ChatGPT for OneRyanAlexander
// Notes:
// - Bands are computed using percentage volatility (log returns), per the Black‑Scholes framing.
// - Inner band (default 3σ) and outer band (default 4σ) are configurable.
// - A setup occurs when price closes outside the outer band, then closes back within the inner band.
// The bar that re‑enters is the "signal bar." We then require price to trade beyond the signal bar's
// extreme by a user‑defined cushion (default 0.34 * signal bar range) to confirm entry.
// - Includes alertconditions for both setups and confirmed entries.

Vicky IndicatorMomentum indicator used for day trading only. Focus on the line. If it crosses below midline then sell options and square off when it crosses midline on the up. Color changes added for better understanding. This is more refined than other indicators and gives better entry and exits

X ATM Option Ladder FlowX ATM Option Ladder Flow is a specialized options-market visualization tool designed for intraday tracking of at-the-money (ATM) option volume flow in index ETFs such as QQQ and SPY.
The script dynamically identifies the ATM contract on every bar and plots real-time call-versus-put volume distributions and marker to represent if the volume corresponded with the price of the option going up or down.
By analyzing volume and direction data from multiple strikes within an ±8-point range, the indicator produces a real-time histogram that reflects how order flow evolves relative to the underlying price.
Complementary status tables display the active strike, ladder position, and warnings when the underlying moves outside the monitored range.
Core Features
Dynamic ATM selection – Each bar automatically maps to the option contract closest to the underlying’s price.
Bidirectional volume comparison – Visual separation of call and put volume, with “up” markers highlighting contracts trading above their prior close.
Multi-strike ladder analysis – Samples strikes ±8 points from the defined center to capture flow skew and momentum near the money.
Optimized data calls – Uses tuple requests to minimize request.security() load, enabling a deeper ladder within TradingView limits.
Session awareness – Restricts processing to the 9:30 AM – 4:15 PM ET option-trading window.
Status dashboard – Displays date, active strike, warning flags (“⚠︎ / •outside”), and ladder parameters directly on chart.
Use Case
The indicator is intended for intraday traders and options-flow analysts who want to visualize how short-term liquidity and sentiment migrate across the ATM region as the underlying moves. Typical applications include:
Monitoring real-time call/put volume balance to confirm directional momentum or detect absorption zones.
Identifying volatility clustering near the money—where hedging pressure or gamma concentration can influence underlying price stability.
Detecting when price exits the monitored ladder (⚠︎ / •outside), signaling a potential shift to a new dominant option band or requiring manual recentering.
Integrating option flow into broader futures or ETF bias models (e.g., NQ/ES alignment or QQQ/SPY flow confirmation).
Technical Notes
Static-center architecture ensures historical consistency: prior bars remain fixed even after re-centering.
Ladder depth is hard-coded to ±8, the maximum possible within TradingView’s security-call limits.
auto_nudge is enabled to smoothly align the selected lane with the active ATM without requiring user intervention.
Indicator is optimized for 1-minute to 5-minute charts; use overlay = false to preserve scale clarity.

Watermark[Font] This watermark is designed for recording your chart.
It automatically converts to a cursive (italic) style and appears on the chart,
adding a more aesthetic touch to your visuals.
Enjoy your time!
You can freely turn the brand label on or off from the settings.
1.script
2.italic

Jackpot_By_Rao_Gs_Swng_Pbls🎯 Description
Jackpot_By_Rao_Gs_Swng_Pbls is a precision-based intraday and swing trading automation tool designed for NIFTY options, built to identify high-probability BUY CE and BUY PE opportunities.
The script automatically tracks ITM (In-the-Money) option pairs derived from the live NIFTY spot price and calculates breakout/breakdown setups based on recent swing highs and lows, EMA alignment, and RSI confirmation.
Once a valid breakout condition is met, the script generates:
Visual chart signals with complete trade details (Entry, Stop Loss, Targets)
Dynamic JSON alerts for webhook-based auto order placement
Automated trade management (Target, SL, and Exit logic)
It’s optimized for traders using Dhan API or compatible webhook integrations, enabling one-click or automated trade execution directly from TradingView alerts.
⚙️ Core Features
✅ Auto-calculates current ATM and ITM strike codes based on today’s open price
✅ Identifies breakout/breakdown trades from the previous swing levels
✅ Dynamic EMA-based trend filter (EMA 20 vs EMA 50)
✅ RSI check for directional strength (internally calculated)
✅ Full trade details shown on the chart with 5 target levels
✅ Auto JSON alert generation with webhook-ready payload
✅ Built-in Stop Loss and Exit handling logic
✅ Visual markers for CE (Green arrows) and PE (Red arrows)
✅ Adjustable parameters for expiry date, open price, and swing length
📈 Trade Logic Overview
🔹 BUY CE Condition (Bullish Setup):
EMA20 > EMA50 → Bullish trend confirmation
Spot closes below recent swing low
CE Option price below its recent high
Confirmation candle closes above previous open (if green) or above midpoint (if red)
🔹 BUY PE Condition (Bearish Setup):
EMA50 > EMA20 → Bearish trend confirmation
Spot closes above recent swing high
PE Option price below its recent high
Confirmation candle closes below previous close/midpoint depending on color
Each signal automatically plots a BUY label on the chart showing:
Entry Price
Stop Loss
Targets 1–5
Strike Code
Trigger Time |
