Kwan NRP Backtest To calculate the coordinates in which the kink of the line will cross,
the standard Forex instruments are used - Relative Strenght Index, Stochastic and Momentum.
It is very easy to optimize them for the existing trading strategy: they all have very
flexible and easily customizable parameters. Signals to enter the market can be 2 situations:
Change of color of the indicator line from red to blue. At the same time, it is worth entering into the purchase;
Change of color of the indicator line from blue to red. In this case, it is worth entering for sale.
The signals are extremely clear and can be used in practice even by beginners. The indicator
itself shows when to make deals: the user only has to accompany them and set the values
of Take Profit and Stop Loss. As a rule, the signal to complete trading is the approach of
the indicator level to the levels of the maximum or minimum of the previous time period.
מתנדים

Double Bollinger StrategyFrom "Bitcoin Trading Strategies: Algorithmic Trading Strategies For Bitcoin And Cryptocurrency That Work" by David Hanson.
*Works better with 1hr time frame and some input optimisations.
"Double Bollinger Band Scalping System
Recommended Timeframe: 1 minute or 5 minute *
Required Indicators:
// - RSI with a length of 14 (default settings)
// - Bollinger band #1 settings: Length = 50, stDev = 1 Hide the basis/middle line (basis line not needed for this strategy)
Note: This is the slower bollinger band in the directions
// - Bollinger band #2 settings: Length 20, stDev = 1 Hide the basis/middle line (basis line not needed for this strategy)
Note: This is the faster bollinger band in the directions
Enter Long/Buy Trade When:
// - RSI is above the level 50
// - A candle closes above the top of the faster bollinger band
Enter a long when a candle then closes above the top of the slower bollinger band, and price is above the top of both bands
Place a stop loss under the low of the entry candle Example of a long trade using this strategy
Exit Long Trade When: A candle closes below the top band of the fast bollinger band
Enter Short/Sell Trade When:
// - RSI is below the level 50
// - A candle closes below the bottom of the faster bollinger band
Enter a short when a candle then closes below the bottom of the slower bollinger band, and price is below both bands
Place a stop loss above the high of the entry candle Example of a short trade using this strategy
Exit Short Trade When: Price closes inside the bottom of the faster bollinger band"

[TVExtBot]Volatility Breakout Trend Strategy(1H&2H)The Volatility Breakout Trend Strategy is a short-term trend strategy that has been modified to enable trading in both long and short directions by optimizing the Volatility Breakout Basic Strategy for 1Hour and 2Hour candles.
Select Timeframe=60 for the input to use on the 1Hour candle and Timeframe=120 for the 2Hour candle.
변동성 돌파 트렌드 전략은 변동성 돌파 기본 전략을 1시간과 2시간 캔들에 최적화하여 롱과 숏 양방향으로 매매가능하도록 수정한 단기 추세 전략입니다. (※1,2시간봉 에서만 사용가능)
1시간봉에서 사용하기 위해서는 입력에서 Timeframe=60을 선택하고 2시간봉에서는 Timeframe=120을 선택합니다.
Default Options(기본설정)
Timeframe (Min) (사용시간봉) : 120분 (※60분과 120분 선택가능)
Noise Ratio (Day) (노이즈비율기간) : 30일
BeforeDay Open-Close Volatility (%) (전날 시가종가 변동률) : 7%
ToDay Open-Close Volatility (%) (당일 시가종가 변동률) : 7%
TakeProfit (%) (익절) : 15%
Trailing Stop(%) (트레일링 스탑) : 5%

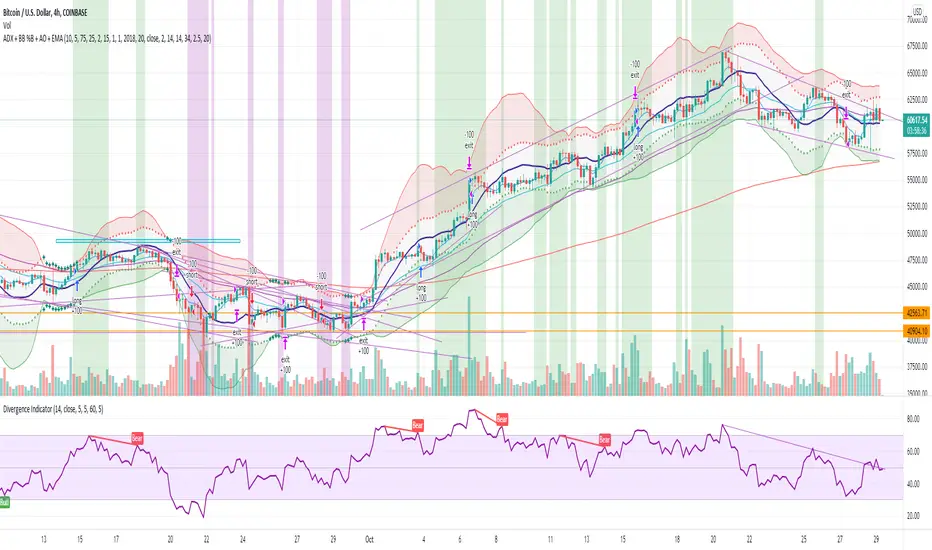
ADX + BB %B + AO + EMA [Luca Massuda]This trading strategy combines different indicators:
1) ADX, Average Directional Movement: to spot the trend
2) BB %B Bollinger Band %B: to spost relative price position to Bollinger Bands
3) AO Awesome Oscillator: to spot momentum
4) ema 5,ema21, ema50, ema200: to decide long or short position
You can configure:
Take profit % : at which % gains to take profit from the entry price
Stop loss % : at which % stop loss from the entry price
BB %B Overbought: At which level you consider Overbought respect to Bollinger Bands (values 0 to 100)
BB %B Oversold: At which level you consider Oversold respect to Bollinger Bands (values 0 to 100)
Awesome Oscillator: AO level to consider a long or short position +/- 2
ADX: ADX value to consider a long or short position
Start Date, Month, Year: Starting point for a backtesting strategy
Lenght , Source , Standard Deviation: Bollinger Bands values
ADX smoothing, DI Lenght: ADX values
Green and purple zones indicate when the strategy can go long or short.
Default Long conditions:
ema5>ema21 and ema50>ema200 and bb>75% and ao>2 and adx>15
Default Short conditions:
ema515
Combo Backtest 123 Reversal & Smoothed Williams ADThis is combo strategies for get a cumulative signal.
First strategy
This System was created from the Book "How I Tripled My Money In The
Futures Market" by Ulf Jensen, Page 183. This is reverse type of strategies.
The strategy buys at market, if close price is higher than the previous close
during 2 days and the meaning of 9-days Stochastic Slow Oscillator is lower than 50.
The strategy sells at market, if close price is lower than the previous close price
during 2 days and the meaning of 9-days Stochastic Fast Oscillator is higher than 50.
Second strategy
Accumulation is a term used to describe a market controlled by buyers;
whereas distribution is defined by a market controlled by sellers.
Williams recommends trading this indicator based on divergences:
Distribution of the security is indicated when the security is making
a new high and the A/D indicator is failing to make a new high. Sell.
Accumulation of the security is indicated when the security is making
a new low and the A/D indicator is failing to make a new low. Buy.
WARNING:
- For purpose educate only
- This script to change bars colors.

Wunder VolPIN StrategyI believe it is perhaps one of the world's simplest but one of the rare indicators where backtest results are so efficient. As a strategy, we buy every time a buy signal comes, but we need to repeat this 20 times and we buy when our average rises by 0.65 percent. I know that this indicator, which I did not prepare for the sales strategy, also works very efficiently in sales transactions.
On settings part you can change the volatility and PIN percentage. I prepare for 1 minute graphs for coins. Maybe if you can arrange the settings for the stocks and different time periods.
I use this strategy in one minute periyod. 20 times buy strategy is very important. On every buy signal you must work in process. You can arrange stoploss if you want. But I am not using stoploss system.

Combo Backtest 123 Reversal & Smoothed RSIThis is combo strategies for get a cumulative signal.
First strategy
This System was created from the Book "How I Tripled My Money In The
Futures Market" by Ulf Jensen, Page 183. This is reverse type of strategies.
The strategy buys at market, if close price is higher than the previous close
during 2 days and the meaning of 9-days Stochastic Slow Oscillator is lower than 50.
The strategy sells at market, if close price is lower than the previous close price
during 2 days and the meaning of 9-days Stochastic Fast Oscillator is higher than 50.
Second strategy
This is new version of RSI oscillator indicator, developed by John Ehlers.
The main advantage of his way of enhancing the RSI indicator is smoothing
with minimum of lag penalty.
WARNING:
- For purpose educate only
- This script to change bars colors.
Kifier's MFI/STOCH Hidden Divergence/Trend BeaterMFI/STOCH Hidden Divergence/Trend Beater
General Idea:
My premise around this strategy was to make a general strategy for crypto that would help out with finding entry positions for when you’re bullish on a crypto and want to hold on for a while, and at the same time avoiding massive drops. Essentially a way to mix long term/ swing trading; I somewhat achieved my goal however it still requires a lot of logic tuning of the trend averages.
I’m a huge proponent of volume indicators and coupled with average closing price, I think this gives a really good idea of what is happening with the market. It gives an idea on the market and retail investor sentiment. This generally gives you logical entry positions (Although I don’t know how amazing that will work with all cryptos, there’s a fine line between a good strategy and one that just rides bubble market conditions, some would argue that’s still a success and others not)
How it works:
There are many components to the strategy that try to do different things:
First of all there are two types of entries, a MFI hidden divergence with a STOCH check, essentially it will only fire when a divergence is detected while STOCH is above 50%, however this might be changed in the future as due to the volatile nature of cryptos, the STOCH is not too effective. The second entry is a simple MFI/STOCH trend, if STOCH is above 50% and the trend is detected to be in a trending long, once a MFI crossover over the 50% line is detected an entry is placed, this is designed to get out profit where the divergence would otherwise be less accurate during strongly trending conditions.
-MFI is a great indicator, as a volume weighted momentum indicator I find it the most accurate of all, the STOCH however is a great indicator to get a general picture of simple market conditions and can filter out the emotional noise of retail investors.
-VWMA and an SMA (The bottom oscillator) gives an idea of the trend tacking into account of the volume, this serves as a more short term filter of the trend for filters.
-OBV checks are done between the OBV and an EMA of the OBV, to get the idea of a volume weighted long trend, which is important for crypto as there are massive rallies to go up due to retail greed, it’s great to jump onto it at the beginning, and get off before the stack of cards fall apart.
-ATR is used to detect when the market is relatively just ranging or moving sideways, which is where the hidden divergence entries are done, during predictable and profitable market conditions.
- Stop loss is based on the closest support of the entry, this is a nice medium of room to breath but also an actual stop loss.
Future plans and improvements:
Currently there’s a lot I want to improve, mostly the divergence detection and the overall sharpe ratio could be much better, but the current value of 0.5 gives me hope that the strategy is onto something. I also want to change TP from a percentage stop to something more dynamic but that might be too optimistic. The current plan is to paper trade test this either by manual or by a python bot, to see how it performs with some user input as well.

Alert(), alertcondition() or strategy alerts?Variety of possibilities offered by PineScript, especially thanks to recent additions, created some confusion. Especially one question repeats quite often - which method to use to trigger alerts?
I'm posting this to clarify and give some syntax examples. I'll discuss these 3 methods in chronological order, meaning - in the order they were introduced to PineScript.
ALERTCONDITION() - it is a function call, which can be used only in study-type script. Since years ago, you could create 2 types of a script: strategy and study. First one enables creating a backtest of a strategy. Second was to develop scripts which didn't require backtesting and could trigger alerts. alertcondition() calls in strategy-type scripts were rejected by Pine compiler. On the other hand compiling study-type scripts rejected all strategy...() calls. That created difficulties, because once you had a nice and backtested strategy, you had to rip it off from all strategy...() function calls to convert your script to study-type so you could produce alerts. Maintenance of two versions of each script was necessary and it was painful.
"STRATEGY ALERTS" were introduced because of alertcondition() pains. To create strategy alert, you need to click "Add alert" button inside Strategy Tester (backtester) and only there. Alerts set-up this way are bound with the backtester - whenever backtester triggers an order, which is visible on the chart, alert is also fired. And you can customize alert message using some placeholders like {{strategy.order.contracts}} or {{ticker}}.
ALERT() was added last. This is an alerts-triggering function call, which can be run from strategy-type script. Finally it is doable! You can connect it to any event coded in PineScript and generate any alert message you want, thanks to concatenation of strings and wrapping variables into tostring() function.
Out of these three alertcondition() is obviously archaic and probably will be discontinued. There is a chance this makes strategy/study distinction not making sense anymore, so I wouldn't be surprised if "studies" are deprecated at some point.
But what are the differences between "Strategy alerts" and alert()? "Strategy alerts" seem easier to set-up with just a few clicks and probably easier to understand and verify, because they go in sync with the backtester and on-chart trade markers. It is especially important to understand how they work if you're building strategy based on pending orders (stop and limit) - events in your code might trigger placing pending order, but alert will be triggered only (and when) such order is executed.
But "Strategy Alerts" have some limitations - not every variable you'd like to include in alert message is available from PineScript. And maybe you don't need the alert fired when the trade hit a stop-loss or take-profit, because you have already forwarded info about closing conditions in entry alert to your broker/exchange.
Alert() was added to PineScript to fill all these gaps. Is allows concatenating any alert message you want, with any variable you want inside it and you can attach alert() function at any event in your PineScript code. For example - when placing orders, crossing variables, exiting trades, but not explicitly at pending orders execution.
The Verdict
"Strategy Alerts" might seem a better fit - easier to set-up and verify, flexible and they fire only when a trade really happens, not producing unnecessary mess when each pending order is placed. But these advantages are illusionary, because they don't give you the full-control which is needed when trading with real money. Especially when using pending orders. If an alert is fired when price actually hit a stop-order or limit-order level, and even if you are executing such alert within 1 second thanks to a tool like TradingConnector, you might already be late and you are making entry at a market price. Slippage will play a great role here. You need to send ordering alert when logical conditions are met - then it will be executed at the price you want. Even if you need to cancel all the pending orders which were not executed. Because of that I strongly recommend sticking to ALERT() when building your alerts system.
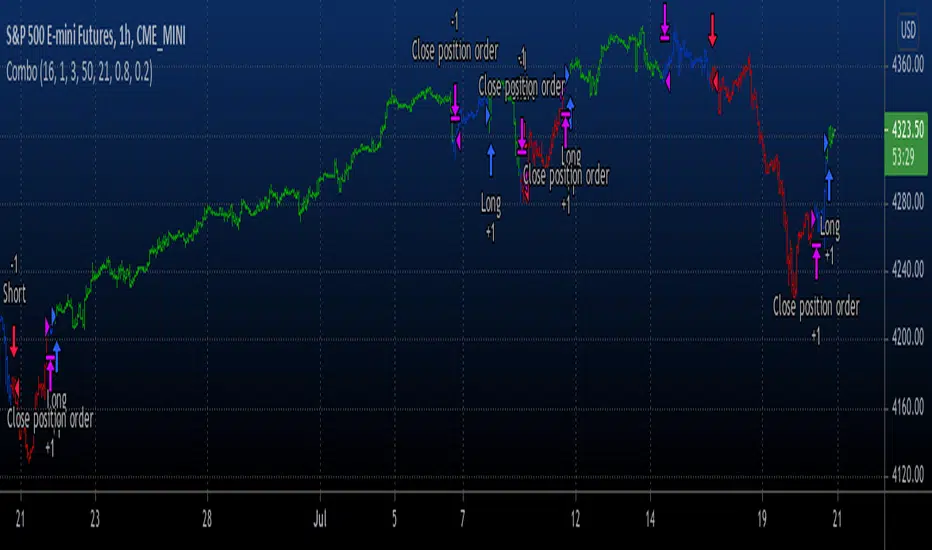
Below is an example strategy, showing syntax to manage placing the orders and cancelling them. Yes, this is another spin-off from my TradingView Alerts to MT4 MT5 . As usual, please don't pay attention to backtest results, as this is educational script only.
P.S. For the last time - farewell alertcondition(). You served us well.

Stochastic RSI + WMA + SMA strat// "...an entry signal it's a cross down or up on
// the stochastics. if you're in a downtrend
// on the hourly time frame you
// must also be in a downtrend on the five
// minute so the five period has to be below the 144
// as long as the five period is still trading below
// the 144 period on both the hourly and the five minutes
// we are looking for these short signals crosses down
// in the overbought region of the stochastic. Viceversa for longs"
// Works well with a wide stop with 20 bars lookback
// for the SL level and a 2:1 reward ratio Take Profit .
// These parameters can be modified in the Inputs section of the strategy panel.

2nd Grade StrategyThis is a strategy to complement the 2GT indicator. It utilises the same rules as 2GT.
This is comprises of multiple popularly used indicators to help decide on whether to go long or short. This indicator will overlay the MA lines and background colours on your chart.
The heikin-ashi colour will be shown as the background colour. This will help you identify a trend more easily while using bars, candles, hollow candles, etc. When the background is green, it means that it is a green HA and vice versa.
The blue MA line is for showing the short-term trend. The red MA line is for showing the medium-term trend. You can select the moving average flavour of your choice in the settings.
The yellow MA line is the long-term trend that is mainly used as a filter to indicate bullish/bearish trend. The MA type for this filter can be different from the short/mid term MA.
This indicator will also show Stochastic crossovers (GC, DC, BC) on the chart. This will help to always keep your eye on the chart candles.
In the settings, you can also turn on/off bullish/bearish signals.
Rules for bullish signals on this indicator:-
1. MA: Blue > Red > Yellow (FastMA > SlowMA > FilterMA)
2. Stochastic: K > D and both are heading upwards
3. 2nd Green HA
When 2 out of the 3 rules are met, the candle background will be Aqua in colour. When all 3 rules are met, the candle background will be Green .
Rules for bearish signals on this indicator:-
1. MA: Yellow > Red > Blue (FilterMA > SlowMA > FastMA)
2. Stochastic: D > K and both are heading downwards
3. 2nd Red HA
When 2 out of the 3 rules are met, the candle background will be Orange in colour. When all 3 rules are met, the candle background will be Red .
Do note that you can hide any of these elements in via the settings.
If you find this useful, do smash the LIKE and FOLLOW button.
WSLM

Bollinger Bands + ADX Strategy// This strategy uses Bollinger Bands to buy when the price
// crosses over the lower band and sell when it crosses down
// the upper band. It only takes trades when the ADX is
// below a certain level, and exits all trades when it's above it.

ADX + RSI Strat// This is a strategy that uses the 7 Period RSI to buy when the indicator is shown as oversold (OS) and sells when
// the index marks overbought (OB). It also uses the ADX to determine whether the trend is ranging or trending
// and filters out the trending trades. Seems to work better for automated trading when the logic is inversed (buying OB
// and selling the OS) wihout stop loss.

Combo Backtest 123 Reversal & SMI Ergodic Oscillator This is combo strategies for get a cumulative signal.
First strategy
This System was created from the Book "How I Tripled My Money In The
Futures Market" by Ulf Jensen, Page 183. This is reverse type of strategies.
The strategy buys at market, if close price is higher than the previous close
during 2 days and the meaning of 9-days Stochastic Slow Oscillator is lower than 50.
The strategy sells at market, if close price is lower than the previous close price
during 2 days and the meaning of 9-days Stochastic Fast Oscillator is higher than 50.
Second strategy
The SMI Ergodic Indicator is the same as the True Strength Index (TSI) developed by
William Blau, except the SMI includes a signal line. The SMI uses double moving averages
of price minus previous price over 2 time frames. The signal line, which is an EMA of the
SMI, is plotted to help trigger trading signals. Adjustable guides are also given to fine
tune these signals. The user may change the input (close), method (EMA), period lengths
and guide values.
WARNING:
- For purpose educate only
- This script to change bars colors.
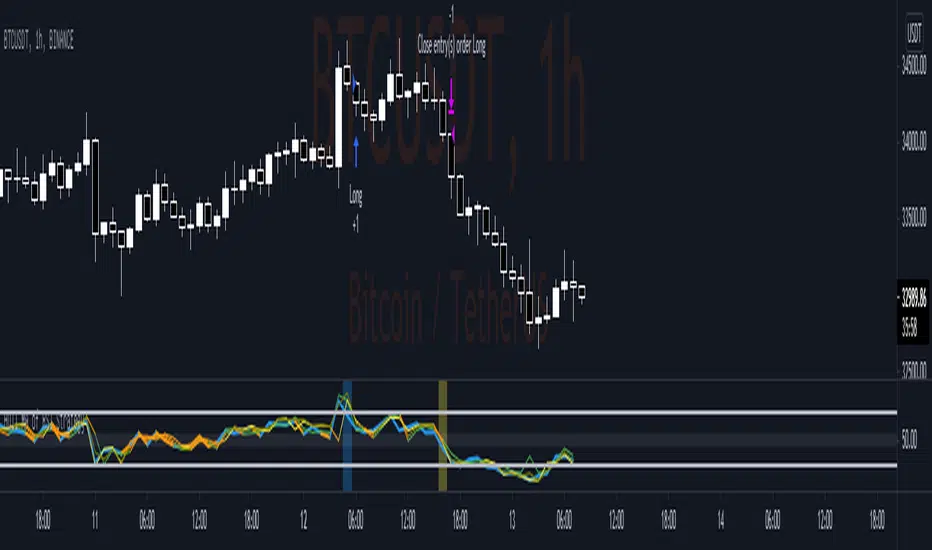
Hull MA of RSI StrategyThis simple strategy base on RSI value of Close Price, High Price, Low Price, Median Price and RSI value smoothed by Hull Moving Average.
1. Optimize parameter on BTC H1 Binance chart
RSI period: 13
Hull MA period: 3
Middle Channel: 55-45
Overbough / Oversold: 70-30
2. Setup
2.1 Long Condition
- RSI of Close Price crossunder Overbought
- Close Price lower than Median Price (HL2)
- RSI of Median Price above Overbought
2.2 Close Long Position
- RSI of Close Price crossover Overbought (Take profit)
or
- RSI of Low Price crossunder upper value of Middle Channel (Stop loss)
2.2 Short Condition
- RSI of Close Price crossover Oversold
- Close Price higher than Median Price (HL2)
- RSI of Median Price below Oversold
2.2 Close Long Position
- RSI of Close Price crossunder Oversold (Take profit)
or
- RSI of High Price crossover lower value of Middle Channel (Stop loss)
3. Idea
- Follow strong momentum of Price to catch Flash Buy/Sell Bar in Crypto Market
- RSI of High Price and Low Price help to regconize setup failure quickly.
- This case study desire to find a balance of Winrate, Profit factor, Sharpe Ratio
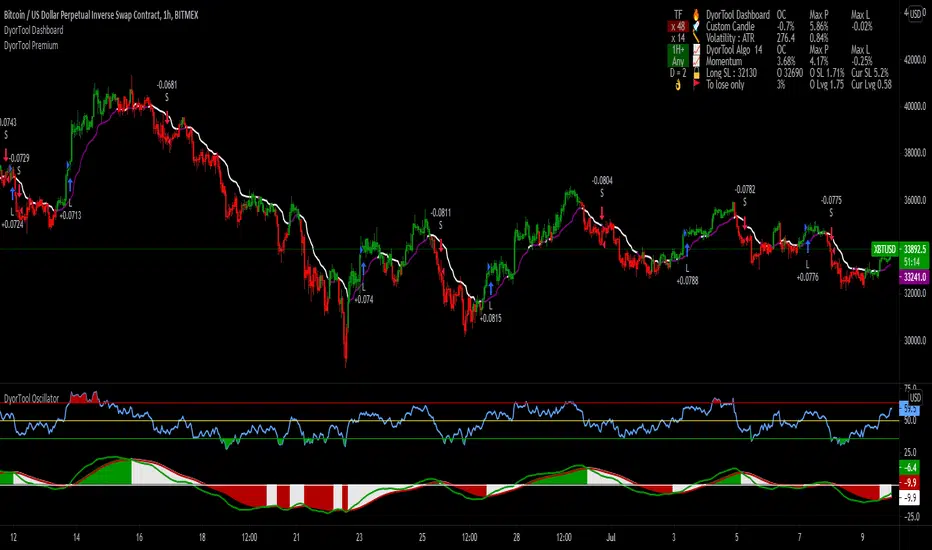
DyorTool PremiumWhat is the DyorTool Suite?
It is a toolkit that helps the trader to trade the market emotionless, under any condition.
This package is made of 3 scripts :
DyorTool Premium
DyorTool Oscillator
DyorTool Dashboard
What indicators are in these scripts?
DyorTool Premium
DyorTool Algo which gives buy and sell signals : 4 setups. The stats shown in the picture is set with a leverage of 0.4 on each trade with the commission of Binance ( without reduction ).
Range : 4 setups
Ribbon : 4 setups
Aggressiv Scalping : Trend Following - low UT : 2 setups
EVWMA : 4 setups
Ping Pong scalping : 4 setups
Support Line : 4 setups
DyorTool Oscillator
DyorTool RSI : 8 setups
DyorTool Oscillator : 8 setups
Smart candle color : Filter noise of the market
DyorTool Dashboard
Allows the user to feel the market sentiment with a custom candle
Measure the volatility of the market
Show DyorTool Algo trend
Show the momentum trend and measure his evolution.
Smart Stop Loss and Leverage calculation in order to not get in a trade if you are late, or to protect your capital.
All these indicators allow users to :
Trade the market easier, within a clearly defined framework - range.
Detect macro trend and the nearby momentum
Get early in a trade by entering in a trade with one of the 42 setups explained.
Have realistic target profit
Protect your capital with a smart stop loss and calculate the leverage for a defined stop loss
Detect if the market is with or against you so you are not holding more than you should.
This package is unique in its kind and it is complete. You can either do scalping or day-trading with it.
There are many different indicators in it. And a formation is given to explain in detail each indicator. This formation is easy to understand.
As you saw, each indicator has its own setups. These setups are explained one by one, under what condition you can enter in a trade, how to do it, where to exit, what to understand about the market next.
There is no interpretation possible. You are either in a setup or in a waiting zone.
These indicators are self-sufficient. You don't have to use all of them, and not at the same time. You use the ones which fit you better.
Combo Backtest 123 Reversal & Smart Money Index (SMI) This is combo strategies for get a cumulative signal.
First strategy
This System was created from the Book "How I Tripled My Money In The
Futures Market" by Ulf Jensen, Page 183. This is reverse type of strategies.
The strategy buys at market, if close price is higher than the previous close
during 2 days and the meaning of 9-days Stochastic Slow Oscillator is lower than 50.
The strategy sells at market, if close price is lower than the previous close price
during 2 days and the meaning of 9-days Stochastic Fast Oscillator is higher than 50.
Second strategy
Smart money index (SMI) or smart money flow index is a technical analysis indicator demonstrating investors sentiment.
The index was invented and popularized by money manager Don Hays. The indicator is based on intra-day price patterns.
The main idea is that the majority of traders (emotional, news-driven) overreact at the beginning of the trading day
because of the overnight news and economic data. There is also a lot of buying on market orders and short covering at the opening.
Smart, experienced investors start trading closer to the end of the day having the opportunity to evaluate market performance.
Therefore, the basic strategy is to bet against the morning price trend and bet with the evening price trend. The SMI may be calculated
for many markets and market indices (S&P 500, DJIA, etc.)
The SMI sends no clear signal whether the market is bullish or bearish. There are also no fixed absolute or relative readings signaling
about the trend. Traders need to look at the SMI dynamics relative to that of the market. If, for example, SMI rises sharply when the
market falls, this fact would mean that smart money is buying, and the market is to revert to an uptrend soon. The opposite situation
is also true. A rapidly falling SMI during a bullish market means that smart money is selling and that market is to revert to a downtrend
soon. The SMI is, therefore, a trend-based indicator.
Some analysts use the smart money index to claim that precious metals such as gold will continually maintain value in the future.
WARNING:
- For purpose educate only
- This script to change bars colors.

15 min Spear Wunder LONG BotThis indicator, which was developed to collect a coin in a downtrend for a long time, is based on the strategy of exiting with 1 percent profit by using the bots. This indicator is based on the data of the 15 min Spear by TrendciHoca indicator. The indicator that buys with the signal coming to the coin, which is in a downtrend, is designed so that you can set it in the settings section. Its default value is 10. This value can be adjusted to be lower or higher than 10 according to the risk you can take. The profit portion of 1 percent can also be adjusted upwards according to the level of risk you can take. I prefer to use all setting to 15min interval and for cryptos. You can change setting for any other interval.

Moving Stop-Loss mechanism + alerts to MT4/MT5"How to code moving stop-loss mechanism", is one of the most often repeating questions in private messages I receive, so just to focus on this mechanism, I made a spin-off from my previous script: TradingView-Alerts-to-MT4-MT5-dynamic-variables-NON-REPAINTING .
The logic here moves the stop-loss each time a trade is running and a new pivot high/low is detected. When such event occurs (UpdateLongStopLoss or UpdateShortStopLoss), stoploss_long or stoploss_short mutable variable is modified. And it needs to be coded inside strategy.exit() line as "stop=stoploss_long" or "stop=stoploss_short". Entries are pretty straightforward - on Stoch crosses.
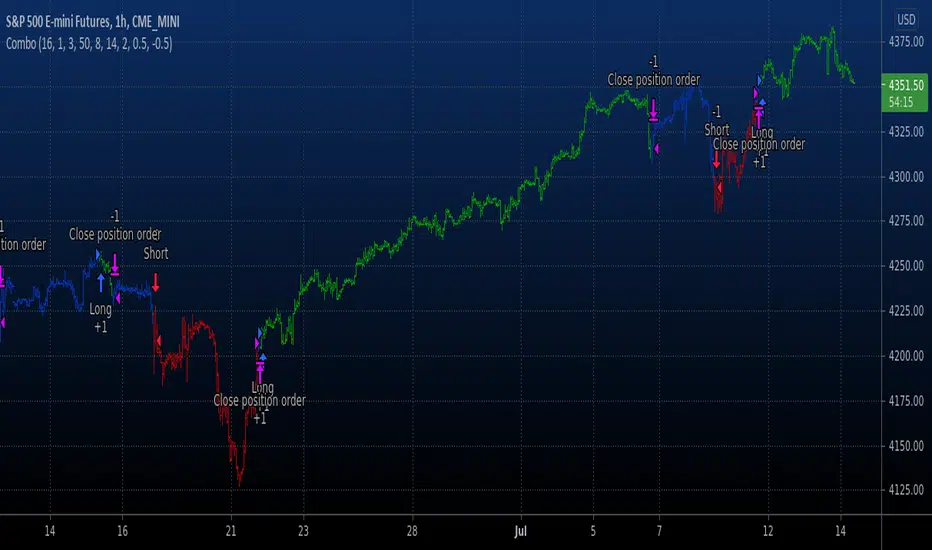
Last lines of the script show how to wrap information about such updates and send send alerts to MetaTrader via TradingConnector for execution in Forex/indices/commodities/crypto markets via MetaTrader. Please note that "tradeid=" variable must be passed with each alert, to let MetaTrader know which trade to modify. SLMOD, TPMOD are recently added commands, along with BE (as in "move stop-loss to breakeven" - but that's another topic).
Please disregard strategy backtest results, as this script is for coding education purposes only. However, it seems with the stop-loss mechanism enabled, the results are even better, than in original version of the script :)

Combo Backtest 123 Reversal & Stochastic This is combo strategies for get a cumulative signal.
First strategy
This System was created from the Book "How I Tripled My Money In The
Futures Market" by Ulf Jensen, Page 183. This is reverse type of strategies.
The strategy buys at market, if close price is higher than the previous close
during 2 days and the meaning of 9-days Stochastic Slow Oscillator is lower than 50.
The strategy sells at market, if close price is lower than the previous close price
during 2 days and the meaning of 9-days Stochastic Fast Oscillator is higher than 50.
Second strategy
This back testing strategy generates a long trade at the Open of the following
bar when the %K line crosses up UpBand line.
It generates a short trade at the Open of the following bar when the %K line
crosses down DownBand line.
WARNING:
- For purpose educate only
- This script to change bars colors.

RSI Cross [xaurr]This is simple but profitable rsi cross strategy, to find optimal values you can change rsi and ema periods.
Good Luck!

TradePro's Trading Idea Cipher Divergence EMA Pb StrategyHere I present you on of Trade Pro's Trading Idea: Cipher B+ Divergence EMA Pullback Strategy.
Optimized the crypto pairBTC/USDT in the 30 minute chart.
There is the possibility to switch between short and long positions.
You can choose between 2 different take profit/stop loss types: The Lowest Low/ Highest High Stop Loss/ Take Profit and the ATR Take Profit/ Stop Loss.
-----------------------------------------------------------------------------------
How does the strategy work?
ENTRY
Long
The price must be above the 200 EMA .
The price needs to make a pullback into the 50 EMA .
Right after that, the Cipher B indicator must give a buy signal, it must be below the zero line and the Money Flow cloud must be green.
Short
Contrary to the premise of long positions.
EXIT
Lowest Low/ Highest High Exit
The Lowest Low (long) / highest high (short) serves as the stop loss. The TP is formed on the basis of a factor.
(Long for example: *Lowest Low* multiplied by *Profitfactor* = TP).
ATR Exit
The value of ATR at the time of buying is multiplied by the value entered in "Profit factor ATR" and "Stop factor ATR". As soon as the price reaches this value, it is closed.
Important
The script must be optimized for each coin or currency pair. However, only the values for the profit factor, the stop loss and Lowest Low / Highest High are relevant.
Also, by changing the Chanel Length and the Chanel Average, you can create strong profit changes.
The results of the strategy are without commissions and leverage.
If you have any questions or feedback, please let me know in the comments.
If you need more information about the strategy and want to know exactly how to apply it, check out my profile. There I have created a tutorial for the function of the script.

MACD ReLoaded STRATEGYSTRATEGY version of MACD ReLOADED Indicator:
A different approach to Gerald Appel's classical Moving Average Convergence Divergence.
Appel originaly set MACD with exponential moving averages.
In this version users can apply 11 different types of moving averages which they can benefit from their smoothness and vice versa sharpnesses...
Built in Moving Average type defaultly set as VAR but users can choose from 11 different Moving Average types like:
SMA : Simple Moving Average
EMA : Exponential Moving Average
WMA : Weighted Moving Average
DEMA : Double Exponential Moving Average
TMA : Triangular Moving Average
VAR : Variable Index Dynamic Moving Average a.k.a. VIDYA
WWMA : Welles Wilder's Moving Average
ZLEMA : Zero Lag Exponential Moving Average
TSF : True Strength Force
HULL : Hull Moving Average
TILL : Tillson T3 Moving Average
In shorter time frames backtest results shows us TILL, WWMA, VIDYA (VAR) could be used to overcome whipsaws because they have less numbers of signals.
In longer time frames like daily charts WMA, Volume Weighted MACD V2, and MACDAS and SMA are more accurate according to backtest results.
My interpretation of Buff Dormeier's Volume Weighted MACD V2:
Thomas Aspray's MACD: (MACDAS)
