RSI Structure Engine (Aggressive Soft) | It measures the direction (trend) and turning points of the market via RSI(7).
But unlike the classic RSI:
It doesn't say "sell at 70 - buy at 30" ❌
Instead:
It reveals the STRUCTURE of the RSI (HH–HL / LH–LL).
That is:
Is there a trend?
Is the trend continuing?
Has the trend ended?
It divides the RSI into 3 zones:
Zone Meaning
RSI ≥ 70 Strong upward momentum (peak regime)
RSI ≤ 30 Strong downward momentum (bottom regime)
30–70 Transition / breathing space
But the key point is this 👇
The bottom/top RSI is FOLLOWED within these regimes, it doesn't lock in immediately.
What and How
🔺 🔻 Locked RSI peak/trough
HH/HL RSI upward trend
LH/LL RSI downward trend
Small points being followed (not yet locked)
If RSI HL breaks, the trend ends
WHAT YOU SHOULDN'T DO?
❌ Don't assume it's a buy-sell indicator alone
❌ Don't short just because you see RSI 70
❌ Don't long just because you see RSI 30
This indicator:
Answers the question "Which side should I be on?"
It doesn't say "Enter right here"
TREND FILTER (MAIN USE)
LONG LOOK:
Last structure: HH + HL
RSI doesn't fall below 30
🔻 HL is protected
SHORT LOOK:
Last structure: LH + LL
RSI cannot rise above 70
🔺 LH is protected
❌ Don't take a trade in the opposite direction.
אינדיקטורים ואסטרטגיות

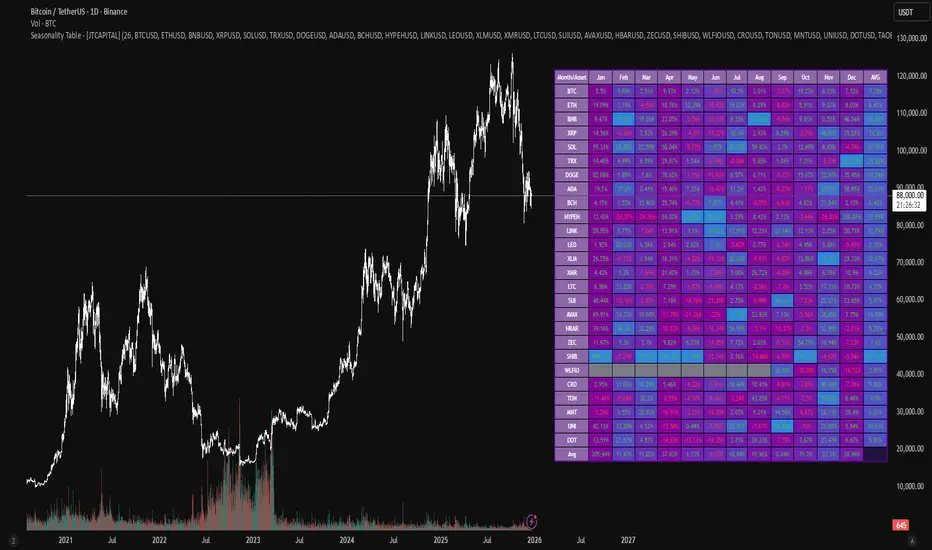
Seasonality Table - [JTCAPITAL]Seasonality Table - is a modified way to use monthly return aggregation across multiple assets to identify seasonal trends in cryptocurrencies and indices.
The indicator works by calculating in the following steps:
Asset Selection
The user defines a list of assets to include in the seasonality table. By default, the script allows up to 32 assets, including popular cryptocurrencies like BTC, ETH, BNB, XRP, and others. Each asset is identified by its symbol (e.g., "CRYPTO:BTCUSD").
Monthly Return Calculation
For each asset, the script requests monthly price data using request.security. Specifically, it retrieves the monthly open, close, and month number. The monthly return is calculated as:
Return = (Close - Open) / Open
This step provides a normalized measure of performance for each asset per month.
Data Aggregation
The script stores two key arrays for each asset and month combination:
sumReturns: The cumulative sum of monthly returns
countReturns: The number of months with valid data
This allows averaging returns later while handling months with missing data gracefully.
Table Construction
Rows representing months (January–December)
Columns representing each asset
An additional column showing the average return for all assets per month
A final row showing the yearly average return for each asset
Filling the Table
The table cells are filled as follows:
Monthly returns are averaged for each asset and displayed as a percentage.
Positive returns are colored green, negative returns red.
Missing data is displayed as a gray “—” placeholder.
Each row’s values are normalized for the color gradient to show relative performance.
Averages Computation
The script calculates two types of averages:
Monthly Average Across Assets : Sum of all asset returns for a month divided by the number of valid data points.
Yearly Average Per Asset : Sum of all monthly returns for an asset divided by the number of months with valid data.
These averages are displayed in the last column and last row respectively, with gradient coloring for visual comparison.
Buy and Sell Conditions
This indicator does not generate explicit buy or sell signals. Instead, it provides a visual heatmap of historical seasonality, allowing traders to:
Identify months where an asset historically outperforms (bullish bias)
Identify months with weak historical performance (bearish caution)
Compare seasonal patterns across multiple assets for portfolio allocation
Filters can be applied by adjusting the asset list, changing the color mapping, or focusing on specific months to highlight seasonal anomalies.
Features and Parameters
Number of assets: Set how many assets are included in the table (1–32).
Assets: Input symbols for the assets you want to analyze.
Low % Color: Defines the color for the lowest monthly returns in the gradient.
High % Color: Defines the color for the highest monthly returns in the gradient.
Cleaned asset names for concise display.
Gradient-based visualization for easier pattern recognition.
Monthly and yearly averages for comparative analysis.
Specifications
Monthly Return Calculation
Uses the formula (Close - Open) / Open for each asset per month. This standardizes performance across different price scales and ensures comparability between assets.
Arrays for Storage
sumReturns: Float array storing cumulative monthly returns.
countReturns: Integer array storing the number of valid data points per month.
These arrays allow efficient aggregation and average calculations without overwriting previous values.
Data Retrieval via Security Calls
Requests monthly OHLC data for each asset using request.security.
Ensures calculations reflect the correct timeframe and allow for historical comparison.
Color and Text Assignment
Green text for positive returns, red for negative returns.
Gray cells indicate missing data.
Gradient background shows relative magnitude within the month.
Seasonality Analysis
The table visually encodes which months historically produce stronger returns.
Useful for portfolio rotation, risk management, and identifying cyclical trends.
Scalability
Supports up to 32 assets.
Dynamically adapts to the number of assets and data availability.
Gradient scales automatically per row for consistent comparison.
Order Blocks & ImbalanceThis indicator automatically identifies and plots Order Blocks (also known as Fair Value Gaps or Imbalances) based on Smart Money Concepts (SMC) and ICT methodology. It detects significant price inefficiencies (gaps between candles) that often act as institutional supply or demand zones.
How It Works (Technical Methodology)
1. Fair Value Gap (FVG) Detection
The indicator identifies classic 3-candle imbalances:
- Bullish Order Block (Demand): When the low of the current candle is significantly below the high of the candle two bars ago (low - high ).
- Bearish Order Block (Supply): When the high of the current candle is significantly above the low of the candle two bars ago (low - high ).
A minimum size threshold is enforced using ATR(14) × user-defined multiplier (default 0.5) to filter out minor gaps and focus on meaningful inefficiencies.
2. Zone Creation
- Bullish zones are created at the candle two bars ago (the "origin" candle where inefficiency occurred).
- Bearish zones use the same origin candle.
- Zone boundaries:
Top = high of origin candle
Bottom = low of origin candle
This captures the full range where price moved aggressively, leaving an imbalance that institutions may later revisit.
3. Mitigation Detection
Zones can be mitigated in two ways (user-selectable):
- "Close": Zone is considered touched only if the close price enters the zone.
- "Wick": Zone is touched if any wick (high/low) enters the zone (more sensitive).
When mitigated:
- Background becomes more transparent
- Border turns dotted
- Label changes to "Mitigated"
Broken zones (price fully closes beyond the opposite side) are automatically deleted.
4. Zone Lifecycle Management
- Active Zone: Strong color fill (green for demand, red for supply) with solid border.
- Mitigated Zone: Faded color, dotted border – indicates partial fill or reduced strength.
- Broken Zone: Automatically removed from chart to reduce clutter.
Old zones are also pruned when exceeding 450 total to maintain performance.
5. Smart Visibility Engine (Optional)
When enabled:
- All zones are initially hidden.
- Only the closest relevant zones are shown:
- Up to user-defined limit (default 10) highest bullish zones (closest below price)
- Up to user-defined limit (default 10) lowest bearish zones (closest above price)
- Visible zones are automatically extended to the right and styled appropriately.
This keeps the chart clean while highlighting the most actionable zones near current price.
6. Visual Elements
- Demand Zones: Green fill, labeled "OB Demand"
- Supply Zones: Red fill, labeled "OB Supply"
- Tiny text size to minimize chart clutter
- Zones drawn as boxes using bar_index positioning
How to Use
Order Blocks represent areas of price inefficiency where smart money likely entered/exited positions aggressively.
- Demand Zones (Green): Potential long entry areas when price returns. Expect buying pressure to defend these levels. Best setups when price retests an active (non-mitigated) zone.
- Supply Zones (Red): Potential short entry areas when price returns. Expect selling pressure to emerge.
- Mitigated Zones: Lower probability – may act as weaker support/resistance.
- Smart Visibility: Highly recommended for cleaner charts. Focuses attention on zones most likely to be tested soon.
- Combine with:
- Break of Structure (BOS)/Change of Character (CHOCH)
- Liquidity grabs
- Higher timeframe confluence
- Volume or momentum confirmation
Use higher FVG threshold (e.g., 0.8–1.0) for fewer, higher-quality zones. Lower threshold for more aggressive detection.
Disclaimer
This indicator is a technical analysis tool and should be used in conjunction with other forms of analysis. Past performance does not guarantee future results. Always use proper risk management.

deKoder | Business Cycle vs BitcoinThis indicator overlays Bitcoin's detrended momentum with the US ISM Manufacturing PMI (a key business cycle proxy) to visually dissect the relationship between crypto cycles and broader economic health.
Inspired by ongoing debates in crypto macro analysis (e.g., "Is there a 4-year halving cycle, or is it just the business cycle?" ), it highlights potential lead-lag dynamics - challenging the popular view that PMI strictly leads Bitcoin rallies and tops.
Key Features
• BTC Momentum Wave (Yellow/Orange Line):
Detrended deviation from Bitcoin's long-term "fair value" (24-month SMA).
Formula: ((close / sma(close, 24)) * 100 - 100) * 0.15
- Positive (yellow): BTC overvalued relative to trend | bullish momentum
- Negative (orange): Undervalued relative to trend | bearish momentum
• PMI Wave (Teal/Red Line):
ISM Manufacturing PMI centered at zero (raw PMI - 50, scaled ×3 for alignment).
- Positive (teal): Expansion (>50 raw) — economic tailwinds.
- Negative (red): Contraction (<50 raw) — headwinds, often linked to risk-off in assets.
• S&P 500 Momentum (White Line, Optional):
Similar deviation for SPX, showing how equities bridge BTC's volatility and PMI's smoothness.
• Divergence Highlights (Bar & Background Colors):
- Teal/Green Zones : BTC momentum positive while PMI negative → BTC signaling early recovery (potential lead by 1-3+ months at bottoms).
- Maroon/Red Zones : BTC momentum negative while PMI positive → BTC warning of rollovers (early bear signals).
- Neutral: No color — aligned cycles.
• Overlaid SMA on Price Chart :
24-month SMA for BTC (teal when price above, red when below) — quick fair value reference.
How to Interpret: Does BTC Lead the Business Cycle?
The chart flips the common meme ( "No 4-year cycle, it's just the business cycle" ) by visually emphasising BTC's potential as a forward-looking signal .
Historical cycles (2013–2025) show:
• BTC Leads at Bottoms : E.g., 2018–2019 and 2022 troughs — BTC momentum crosses positive 2–4 months before PMI, as speculative traders price in liquidity easing/recoveries ahead of manufacturing data.
• Coincident or BTC-Led at Tops : Peaks align closely (e.g., 2017, 2021), with PMI rollovers often coinciding or slightly leading the initial BTC euphoria fade. BTC then rolls over before PMI confirms later.
• Why? Markets are anticipatory (6–12 months forward), while PMI is a lagged survey snapshot. BTC, as a high-beta risk asset, amplifies early sentiment shifts before they hit factory orders/employment.
Inputs & Customization
• BTC Source (Default: BITSTAMP:BTCUSD)
• Fair Value MA Length (Default: 24 months)
• Show S&P (Default: False)
• PMI Multiplier (Default: 3.0)
• BTC Momentum Multiplier (Default: 0.15)
• Cap BTC Momentum at ±100 (Default: True)
• Toggle Early Cross Arrows, Bar/Background Deviation Colors, Difference Histogram

CSA / Infinity MKR / Final Pro [NPR21}Title: CSA – Precision Infinity MKR & Confluence Dashboard
The Institutional Edge: Multi-Kernel Smoothing & Real-Time Confluence
The CSA Precision Infinity MKR is an advanced trend-following suite that replaces traditional, lagging EMAs with a high-performance Multi-Kernel Regression (MKR) engine. Designed for the "Top Center" of the chart, this script features our proprietary Infinity Bridge —a logic system that ensures your trend signal never breaks or snaps, tracking price action with surgical precision directly to the live candle.
Key Technical Features
1
7-Kernel Smoothing Engine: Unlike standard indicators, you can cycle through 17 different mathematical kernels (Sinc, Gaussian, Lorentzian, etc.) to match the specific volatility of any asset class, from high-cap Stocks to volatile Crypto.
The Infinity Bridge: We solved the "broken line" issue. Our script bridges historical regression math with live price data, providing a continuous, seamless trend line that never lags behind the current price.
15-Indicator Confluence HUD: A professional "Heads-Up Display" tracks 15 momentum and trend metrics (Heikin Ashi, SuperTrend, TTM, RSI, etc.) simultaneously. It does the heavy lifting so you can focus on execution.
High-Vis Neon Aesthetics: Built for dark-mode traders. Featuring Neon Fluorescent Green and Bright Red trend lines with a high-contrast dark green dashboard for zero eye strain.
Trader’s Manual: How to Trade the Suite
Step 1: Identify the Regime (The MKR Line)
Bullish: When the MKR line is Neon Green , you are in a buy-only regime.
Bearish: When the MKR line is Bright Red , you are in a sell-only regime.
The Curve: Watch the "hook" of the line. When the line begins to curve toward price, a trend shift is imminent.
Step 2: Confirm Confluence (The Dashboard)
Look at the CONFIRMED tally on the far right of the HUD:
Strong Buy (11/15 – 15/15): Deep green signal. High-probability entry.
Caution (7/15 – 10/15): Orange signal. The trend is weakening or consolidating.
No Trade (Below 7/15) : Red signal. High risk of "chop" or reversal. Avoid new entries.
Step 3: Check the "Non-Trending" Filter
Look for the Non-Trending cell. If it is Dark Blue , the market has officially entered a "Trending State." If it is Gray, the market is sideways, and signals should be taken with caution.
Settings & Customization
Thickness: Defaulted to 3px for a strong chart presence.
Styles: Fully adjustable Solid, Dashed, and Dotted options in the Inputs tab.
Alerts: Built-in alert conditions for Strong Confluence (11/15) and State Flips (Long to Short).

TRADING NAVIGATOR📘 TRADING NAVIGATOR OPERATIONS MANUAL
This manual is designed to turn the script into your complete trading plan.
1. The Golden Rule: Planetary Alignment
Success with this script is not about trading every signal, but waiting for the confluence. Golden Trick: Do not trade on low timeframes (15M) if the trend on the higher timeframe (4H or D) is contrary. The Master Signal: Enter when the RELIABILITY column marks "HIGH" on at least 3 consecutive timeframes.
2. How to open a LONG (Buy) position: Look for these exact conditions on the board: TREND: It should say "BULLISH" (Price above the 200 EMA). ACTION: It should be marked LONG. ENTRY: The price should be near or touching the value indicated in the SUPPORT column. RSI: Ideally between 35 and 45 (healthy pullback) or crossing above 30. Execution: Place your limit order at the ENTRY price on the chart. The TP and SL are your mandatory exit coordinates.
3. How to open a SHORT (Sell) position: Look for these exact conditions on the board: TREND: It should say "BEARISH" (Price below the 200 EMA). ACTION: It should be marked SHORT. ENTRY: The price should be near or touching the value indicated in the RESIST column. (Resistance). RSI: Ideally between 55 and 65 or crossing below 70. Execution: Limit order at the ENTRY price on the chart. Don't chase the price; let it rise to the resistance to enter.
4. Golden Tricks to Gain Consistency: The Volatility Filter: If the VOLAT column shows "HIGH," reduce your position size by half. High volatility means sharp movements that can hit your SL before reaching the TP. The Timeframe Jump: If you see a LONG position on the 15M chart but the trend on the D (Daily) chart is BEARISH, that trade is high risk (pure Scalping). If both are BULLISH, you have a "High Probability Trade." RSI as a sentinel: If the RSI is at 50, the market is indecisive. Wait for it to approach the extremes (30 or 70) so that the Navigator's ACTION has more rebound strength.
5. Recommended Markets:
The TRADING NAVIGATOR is a structure and volatility algorithm, so it works where there is liquidity: Market | Effectiveness | Why |
Cryptocurrencies | ⭐⭐⭐⭐⭐ ATR volatility is best exploited in BTC and ETH. |
Indices (Nasdaq/SP500) | ⭐⭐⭐⭐ Ideal for following the TREND column (EMA 200). |
Forex (Majors) | ⭐⭐⭐ Use it on high-volume pairs (EURUSD, GBPUSD). |
Gold / Oil | ⭐⭐⭐⭐ Very sensitive to the support and resistance levels calculated by the script. |
6. Risk Management (Psychology) | Accepts Stop Loss: The script calculates the SL at 2.0x ATR to give the price "breathing room". If it is touched, the structure has been broken. Don't move the Stop Loss. Partial Taking: When the price has moved 50% of the way to the Take Profit, move your Stop Loss to the ENTRY (Breakeven) price. This ensures that the trade can no longer result in losses.

spy scalp cheat codecombines hma directional scalping strategy plus the option to use optional stochastic quad band to confrim entry

Daytrading Suite: Neon TPO + FVG v6.1Here is the summary of the code and the trading guide in English.
---
### 1. Code Summary: What does the chart show?
The script combines three dimensions of trading into a single chart:
* **The Context (TPO / Market Profile - Yesterday):**
* **Gold Zone (Center):** Yesterday's **POC (Point of Control)**. This was the "fairest price". It often acts as a magnet.
* **White Dashed Lines:** The **VAH (Value Area High)** and **VAL (Value Area Low)**. Yesterday, 70% of all trading volume happened between these lines. This is the area of "Balance".
* **The Structure (HTF - 1 Hour+):**
* **Red/Green Boxes (Right Edge):** Automatic **Supply & Demand Zones** based on the 1-hour chart (or your setting). They indicate major resistance and support levels.
* **The Timing (Entries):**
* **Neon FVG Boxes (Small):** "Fair Value Gaps". These represent imbalances in price. If price revisits these, it is often your **entry signal**.
* **Lines (VWAP, EMA, PDH/PDL):** Act as dynamic support and trend indicators.
---
### 2. Trading Strategy: How to use it
Do not just trade every colored spot. You must combine **Location (TPO)** with **Signal (FVG)**.
#### Step A: The Open (Where are we?)
In the morning (or at the US Open), check where the price is relative to the **white TPO lines**.
1. **Inside the White Lines (In Balance):**
* The market is undecided. Expect ranging/choppy behavior.
* **Strategy:** Buy at the bottom edge (VAL), Sell at the top edge (VAH). The target is often the Gold Zone (POC) in the middle.
2. **Outside the White Lines (Imbalance):**
* The market is seeking new prices. Danger of a Trend!
* **Strategy:** If price breaks above VAH and tests it from above -> **Long**. If it breaks below VAL -> **Short**.
#### Step B: The Setup (The High Probability Scenario)
Here is the "Rejection" Setup (Long Example):
1. Price drops to the lower white line (**VAL**) or into a green **Demand Zone**.
2. It bounces (shows a wick).
3. In the process, a small **green Neon FVG** is formed.
4. **Entry:** Limit Order at the top of the Neon FVG.
5. **Target:** The Gold Zone (POC) or the upper white line (VAH).
6. **Stop Loss:** Below the recent swing low.
#### Step C: Warning Signals (When NOT to trade)
* **In "No Man's Land":** If the price is sitting right in the middle between Gold (POC) and White (VAH/VAL), do nothing. The risk is 50/50. Wait until price hits an edge.
* **Against the Flow:** If EMA 9 and 21 are pointing steeply downwards, do not buy blindly at the VAL just because the line is there. Wait for confirmation (FVG).
### Pre-Trade Checklist:
1. **Level:** Am I at a white line (VAH/VAL) or the Gold Zone (POC)?
2. **Structure:** Do I have an HTF Demand/Supply Zone backing me up?
3. **Trigger:** Do I see a Neon FVG pointing in my direction?

Interest ZonesThis indicator automatically identifies and plots "Interest Zones" around significant pivot highs and lows, representing potential areas of institutional interest, support/resistance, or accumulation/distribution. Zones are dynamically merged when pivots cluster near the same price level and extended for visibility.
How It Works (Technical Methodology)
Pivot Point Detection
The indicator uses Pine Script's ta.pivothigh() and ta.pivotlow() with asymmetric left/right lengths (default left=20, right=13) to detect swing highs and lows. This allows for customizable sensitivity – longer left for stronger confirmation, shorter right for faster detection.
Zone Start Condition (Filtering)
Multiple modes control from which point in history zones begin to be drawn:
"None": All historical pivots (limited by max zones).
"Auto (Start of Day)": Zones only from the beginning of the current trading day (resets daily).
"Manual Date": User-defined fixed date.
"Interactive (Chart)": User-confirmed date via input (useful for backtesting specific periods).
"Last X Bars": Only pivots within the last user-defined number of bars (default 400).
A vertical line marks the start point in date-based modes for visual reference.
Zone Construction
For each valid pivot:
Zone thickness is based on ATR(14) × user-defined multiplier (default 0.3) for dynamic, volatility-adjusted height.
Pivot High zones: Centered below the high (potential supply/resistance).
Pivot Low zones: Centered above the low (potential demand/support).
Zones are drawn as boxes extending to the right, with gray fill and border.
Merge & Overlap Logic
When a new pivot falls inside an existing zone or is very close (within user-defined "Proximity Sensitivity %" of the zone's midpoint, default 1.1%):
The new pivot is merged into the existing zone.
A counter ("x2", "x3", etc.) is displayed on the zone, indicating how many pivots have clustered there.
The zone is strengthened visually (counter text) and extended further right.
This highlights high-interest levels where price repeatedly reversed.
Zone Management
In "None" mode: Only the most recent user-defined max zones are kept (default 5) – oldest deleted automatically.
In other modes: Up to ~490 zones (performance limit), oldest pruned if exceeded.
All zones auto-extend to the right on the last bar for continuous visibility.
Visual Elements
Uniform gray color for all zones (configurable).
Transparent background fill (adjustable).
Counter text in white (configurable) when zones have multiple touches.
Clean, non-directional design – focuses purely on clustered reversal points.
How to Use
Interest Zones highlight price levels where the market has shown repeated respect through multiple swing pivots – often coinciding with institutional order clusters, psychological levels, or hidden support/resistance.
Higher counter values ("x3+", "x5+"): Stronger zones – higher probability of reaction on retest.
Use for:
Potential reversal or bounce areas when price approaches a zone.
Confluence with other tools (order blocks, FVG, volume profile, etc.).
Stop-loss placement beyond zones or take-profit at opposite zones.
Daily reset ("Auto Start of Day"): Ideal for intraday trading – fresh zones each session.
Backtesting: Use "Manual" or "Interactive" date modes to analyze specific historical periods.
"Last X Bars": Good for medium-term swing analysis without full history clutter.
Adjust ATR multiplier for tighter (lower) or wider (higher) zones based on asset volatility. Increase proximity sensitivity for more aggressive merging in ranging markets.
Combine with trend direction, volume, or higher-timeframe structure for best results.
Disclaimer
This indicator is a technical analysis tool and should be used in conjunction with other forms of analysis. Past performance does not guarantee future results. Always use proper risk management.

QuantCrawler 5m ORB Pro - Opening Range with Confluence FiltersThis indicator captures the 5-minute Opening Range and generates entry signals using a breakout-then-retest methodology. It includes optional confluence filters to refine entries and reduce false signals.
HOW IT WORKS
1. Captures the 5-minute Opening Range (high, low, midpoint) at your selected session open
2. Waits for price to break beyond OR high or low by your defined distance
3. After breakout, monitors for price to retest the OR midpoint
4. Signals LONG after bullish breakout + midpoint retest
5. Signals SHORT after bearish breakout + midpoint retest
6. Marks invalidated signals with (X) if price breaks through the opposite side
PRE-CONFIGURED SESSIONS
- NYSE - 9:30-9:35 ET
- CME - 8:30-8:35 CT
- London - 3:00-3:05 ET
- Asia - 7:00-7:05 PM ET
- Custom - Define your own session times and timezone
BREAKOUT DISTANCE OPTIONS
Choose between fixed points or percentage-based breakout threshold. Percentage mode automatically scales to the instrument price.
CONFLUENCE FILTERS
Optional filters to add confirmation before signals fire:
- VWAP - Long requires price above VWAP, short requires below
- EMA Slope - Confirms trend direction using 20-period EMA
- Volume - Requires relative volume above 1.5x average
- FVG - Requires a Fair Value Gap supporting trade direction
- ATR - Filters Opening Ranges that are abnormally small or large relative to ATR
When filters block a valid setup, the indicator displays a BLOCKED label so you can see what you missed and why.
STATUS BOX
Real-time display showing:
- Current trade state (Building OR, Watching, Awaiting Retest, Long/Short Active)
- OR High, Low, and Midpoint levels
- Active filters and block reasons
ALERTS
Built-in alerts for Long Entry, Short Entry, or Any Entry.

XAUUSD M15 momentum real Detects when xausd enters a healthy directional phase during the NY session, and only flags entries with real momentum and controlled volatility.

Long Position (Manual Setup)BINANCE:BTCUSDT
This script is for long position setup manually....
Just enter the following data ......
1. higher entry price
2. lower entry price
3. stop loss price
4. targets ( up to 5 targets)
5- extra targets ( up to 3 extra targets)
then you will have the long position draw in the chart with the trade summary including risk and reward percentage.

SMC Strategy Tool v1.0 - Institutional SuiteDescription: The SMC Strategy Tool v1.0 is a comprehensive technical analysis suite designed for traders following the Smart Money Concepts (SMC) methodology. It combines market structure, institutional liquidity zones, and mathematical pivots to provide a high-probability trading environment.
Key Features:
Automatic Market Structure: Real-time detection of CHoCH (Change of Character) and BOS (Break of Structure) based on price action confirmation.
Institutional Order Flow (FVG): Identifies Fair Value Gaps with a dynamic mitigation system (boxes disappear once the price fills the inefficiency).
Premium & Discount Zones: Automatically calculates the current trading range and highlights the "cheap" (Discount) and "expensive" (Premium) areas for optimal entry.
Daily Pivot Points: Seamless integration of Daily Pivots (P, R1-R3, S1-S3) for institutional confluence.
Live Analytics Dashboard: A clean, non-intrusive table monitoring Market Phase, RSI (Momentum), and ATR (Volatility).
Smart Alerts: Built-in logic for "Discount Entry" during Bullish trends and "Premium Entry" during Bearish trends.
How to Trade:
Identify the Trend: Look at the Dashboard for the current Market Phase (Bullish/Bearish).
Wait for Value: Do not chase the price. Wait for the price to return to the Discount Zone (for Longs) or Premium Zone (for Shorts).
Find Confluence: The highest probability trades occur when a Discount/Premium entry aligns with an FVG and a Daily Pivot level.
Confirmation: Check the RSI cell. If it's red/green, the move might be exhausted; wait for a neutral reading or a structural reaction.
Available Alerts:
Trend Shift (CHoCH): Get notified immediately when the market structure shifts (e.g., from Bearish to Bullish).
Trend Continuation (BOS): Signals when the current trend is confirmed by a new structural break.
Discount Zone Entry (Long Bias): Notifies you when the price enters the Discount Zone while the Market Phase is Bullish. This prevents FOMO buying at high prices.
Premium Zone Entry (Short Bias): Notifies you when the price enters the Premium Zone while the Market Phase is Bearish. This ensures you are selling at institutional "expensive" prices.
How to set up Alerts:
Click the Alerts icon in the right sidebar.
Under Condition, select: SMC Strategy Tool v1.0 - Institutional Suite.
Select "Any alert() function call" (or Qualsiasi chiamata alla funzione alert()).
Choose your preferred notification method (Popup, Email, or App notification).
The alert message will automatically include the Ticker, Timeframe, and the specific action to take!

Quant VWAP System 3.8 This is the lower-indicator companion to the "Quant VWAP System." While the main chart tells you where the price is, this oscillator tells you how statistically significant the move is.
It uses a Z-Score algorithm to normalize price action. This means it ignores dollar amounts and instead measures how many Standard Deviations (SD) the price is away from its mean (VWAP). This allows you to instantly spot "Overbought" or "Oversold" conditions on any asset (Bitcoin, Forex, or Stocks) without needing to guess.
Key Features:
1. Normalized Extremes (The "Kill Zones")
±2.0 SD: These dotted lines represent statistical extremes. When the signal line crosses above +2.0, the asset is mathematically expensive (Overbought). When it crosses below -2.0, it is mathematically cheap (Oversold).
The Logic: Price rarely sustains movement beyond 2 Standard Deviations without a reversion or a pause.
2. The Squeeze Radar (Yellow Dots)
Volatility Detection: A row of Yellow Dots appearing on the center line indicates a "Squeeze."
What it means: The Standard Deviation bands are compressing. Energy is building.
Warning: DO NOT trade Mean Reversion when you see Yellow Dots. A squeeze often leads to a violent breakout. Wait for the dots to disappear to confirm the direction of the explosion.
3. Momentum Coloring
Green Line: Z-Score is rising (Bullish Momentum).
Red Line: Z-Score is falling (Bearish Momentum).
This helps you spot divergences (e.g., Price makes a Higher High, but the Oscillator makes a Lower High = Exhaustion).
How to Trade with It
Strategy A: The "Zero Bounce" (Trend Continuation)
Scenario: You are in a Bull Trend.
Signal: The Oscillator line pulls back to the Zero Line (White), turns Green, and curls upward.
Meaning: Price has tested the average (VWAP) and buyers have stepped in. This is a high-probability entry for trend continuation.
Strategy B: The "Extreme Fade" (Reversion)
Scenario: The Oscillator pushes deep into the Red Zone (+2.0 SD).
Signal: The line turns Red and crosses back down below the +2.0 dotted line. A small Red Triangle will appear.
Meaning: The statistical extension has failed, and price is likely snapping back to the mean.
Strategy C: Squeeze Breakout
Scenario: Yellow Dots appear on the center line.
Action: Stop trading. Wait.
Signal: The dots disappear, and the line shoots aggressively through +1.0 SD (Long) or -1.0 SD (Short). Ride the momentum.

TRS (Trend Readiness System)TRS – Trend Readiness System
TRS (Trend Readiness System) is a trend-aligned trading framework designed to help you identify stocks that are becoming ready for entry , not just those already breaking out.
Instead of producing noisy buy/sell signals, TRS evaluates trend quality, pullback structure, momentum rebuilding, and market context , and converts them into clear scores, states, and timing awareness — both on the chart and inside the TradingView Screener.
---
Core Philosophy
Strong trends don’t start at the breakout — they start when conditions quietly align.
TRS focuses on:
• Primary trend alignment
• Healthy pullbacks above long-term support
• Early momentum recovery
• Market regime confirmation
• Entry timing (fresh vs late)
---
What TRS Measures
1. Setup Score (Trend Quality)
Answers the question: “Is this stock structurally worth watching?”
Based on:
• Price position relative to MA150
• Long-term trend direction
• Higher-low structure
• Distance from MA150 (overextension control)
• Market regime (bullish / bearish)
---
2. Entry Score (Timing Quality)
Answers the question: “Is the timing right — or still early?”
Based on:
• Short and mid-term moving averages
• Pullback behavior
• Momentum stabilization
• Volume confirmation
---
3. General Score
A combined readiness score used for ranking in the TradingView Screener:
General Score = Setup Score + Entry Score
---
Entry State Tracking (Key Feature)
TRS tracks the full entry lifecycle , not just signals:
• Valid Entry
• Pending Entry (almost ready)
• Bars Since Valid Entry
• Entry Window (Fresh / Expired)
• Entry Still Valid (Yes / No)
This helps avoid chasing late or already-played setups.
---
Market Regime Filter
Signals automatically adapt to overall market conditions:
• Market trend confirmation (e.g. SPY / QQQ)
• Reduced false signals during weak markets
• Clear explanation when setups are blocked
---
Visual Dashboard (Optional)
The on-chart dashboard can display:
• General Score
• Market state
• Setup quality
• Entry status
• Entry window
• Bars since entry
• Blocking reason (if any)
You can switch between:
• Minimal mode – essential info only
• Full table mode – detailed diagnostics
---
Screener Integration
TRS exposes clean numeric outputs for the TradingView Pine Screener:
• Setup Score
• Entry Score
• General Score
• Pending Entry (1 / 0)
• Valid Entry (1 / 0)
• Bars Since Valid Entry
• Market Bullish (1 / 0)
Example Screener Filters:
• Setup Score ≥ 50
• Pending Entry = 1
• Bars Since Valid Entry ≤ 3
• Market Bullish = 1
---
How to Use TRS (Daily Routine)
Step 1 – Scan
• Look for high Setup Score
• Prefer Pending Entry = 1
Step 2 – Review
• Confirm pullback quality
• Check MA150 support
• Observe momentum rebuilding
Step 3 – Act
• Enter only on Valid Entry
• Avoid expired entry windows
• Skip setups blocked by market regime
---
What TRS Is NOT
• Not a breakout chaser
• Not a day-trading system
• Not signal spam
TRS is a decision-support system for swing and position traders who value structure, context, and timing.
---
Best Used On
• Daily timeframe (1D)
• Liquid stocks & ETFs
• Trend-following strategies
• Portfolio-level screening
---

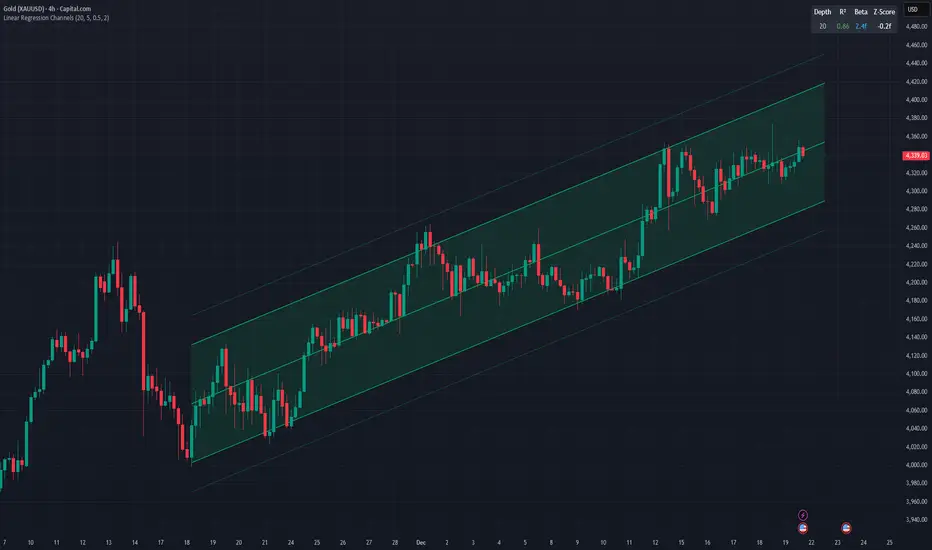
Linear Regression ChannelsThis indicator dynamically identifies and plots the best-fit linear regression channels based on recent pivot points, optimizing for statistical strength across user-defined depths.
How It Works (Technical Methodology)
1. Pivot Point Detection
The indicator uses Pine Script's ta.pivothigh() and ta.pivotlow() functions with a configurable sensitivity length to detect swing highs and lows. All recent pivot indices are stored in an array (limited to avoid performance issues), providing potential starting points for regression calculations.
2. Multi-Depth Evaluation
Users input comma-separated "Pivot History Depths" (e.g., "5,20,50"). For each depth:
- The script evaluates regression fits starting from the most recent pivots, up to the specified depth count.
- It calculates linear regression statistics for each possible channel originating from those pivot bars backward to the current bar.
3. Linear Regression Calculation
For each candidate channel:
- Slope (m) and intercept (b) are computed using least-squares method.
- R-squared (R²) measures goodness of fit (how well price follows the trend line).
- Standard error of the estimate is calculated to quantify volatility around the regression line.
- A composite score = R² × log(length) prioritizes stronger fits on longer periods.
4. Best-Fit Selection and Validation
- Only channels with R² ≥ user-defined minimum (default 0.5) are considered valid.
- The channel with the highest score for each depth is selected and drawn.
- This ensures the most statistically significant and relevant channels are displayed, avoiding weak or short-term noise.
5. Channel Construction
- Mean Line: The regression trend line extended slightly into the future.
- Inner Channels: ± user-configurable standard deviation multiplier (default 2.0σ) around the mean.
- Outer Bands: ±1.5× the inner deviation for additional visual context.
- Filled areas between mean and inner channels for better visibility.
- Color: Green shades for upward slopes (bullish trend), red shades for downward slopes (bearish trend).
6. Dashboard and Statistics
- Optional table in the top-right corner displays for each depth:
- Depth value
- R² (colored green if >0.7, orange otherwise)
- Slope (Beta) – positive blue for uptrend, red for downtrend
- Current Z-Score: How many standard deviations the latest close is from the expected regression value (yellow if |Z| > 2)
How to Use
Regression channels help identify trending markets, potential mean reversion, and overextension.
- Upward Channels (Green): Price above the mean may indicate strength; pullbacks to the mean or lower band offer long opportunities. Overextension above upper band could signal exhaustion.
- Downward Channels (Red): Price below the mean may indicate weakness; rallies to the mean or upper band offer short opportunities. Overextension below lower band could signal capitulation.
- High R² (>0.7): Strong trending channel – trade in direction of slope.
- Low R²: Choppy/range-bound market – avoid trend-following trades.
- Z-Score: |Z| > 2 suggests price is statistically overextended from the trend (potential reversion setup).
- Multi-Depth: Smaller depths catch short-term trends; larger depths capture major trends. Use multiple for confluence across timeframes.
Combine with volume, support/resistance, or other indicators for confirmation.
Disclaimer
This indicator is a technical analysis tool and should be used in conjunction with other forms of analysis. Past performance does not guarantee future results. Always use proper risk management.
OCC Strategy Optimized (MA 5 + Delayed TSL)# OCC Strategy Optimized (MA 5 + Delayed TSL) - User Guide
## Introduction
The **OCC Strategy Optimized** is an enhanced version of the classic **Open Close Cross (OCC)** strategy. This strategy is designed for high-precision trend following, utilizing the crossover logic of Open and Close moving averages to identify market shifts. This optimized version incorporates advanced risk management, multi-timeframe analysis, and a variety of moving average types to provide a robust trading solution for modern markets.
>
> **Special Thanks:** This strategy is based on the original work of **JustUncleL**, a renowned Pine Script developer. You can find their work and profile on TradingView here: (in.tradingview.com).
---
## Key Features
### 1. Optimized Core Logic
- **MA Period (Default: 5):** The strategy is tuned with a shorter MA length to reduce lag and capture trends earlier.
- **Crossing Logic:** Signals are generated when the Moving Average of the **Close** crosses the Moving Average of the **Open**.
### 2. Multi-Timeframe (MTF) Analysis
- **Alternate Resolution:** Use a higher timeframe (Resolution Multiplier) to filter out noise. By default, it uses $3 \times$ your current chart timeframe to confirm the trend.
- **Non-Repainting:** Includes an optional delay offset to ensure signals are confirmed and do not disappear (repaint) after the bar closes.
### 3. Advanced Risk Management
This script features a hierarchical exit system to protect your capital and lock in profits:
- **Fixed Stop Loss (Initial):** Protects against sudden market reversals immediately after entry.
- **Delayed Trailing Stop Loss (TSL):**
- **Activation Delay:** The TSL only activates after the trade reaches a specific profit threshold (e.g., 1%). This prevents being stopped out too early in the trade's development.
- **Ratchet Trail:** Once activated, the stop loss "ratchets" up/down, never moving backward, ensuring you lock in profits as the trend continues.
- **Take Profit (TP):** A fixed percentage target to exit the trade at a pre-defined profit level.
### 4. Versatility
- **12 MA Types:** Choose from SMA, EMA, DEMA, TEMA, WMA, VWMA, SMMA, HullMA, LSMA, ALMA, SSMA, and TMA.
- **Trade Direction:** Toggle between Long-only, Short-only, or Both.
- **Visuals:** Optional bar coloring to visualize the trend directly on the candlesticks.
---
## User Input Guide
### Core Settings
- **Use Alternate Resolution?:** Enable this to use the MTF logic.
- **Multiplier for Alternate Resolution:** How many charts higher the "filter" timeframe should be.
- **MA Type:** Select your preferred moving average smoothing method.
- **MA Period:** The length of the Open/Close averages.
- **Delay Open/Close MA:** Use `1` or higher to force non-repainting behavior.
### Risk Management Settings
- **Use Trailing Stop Loss?:** Enables the TSL system.
- **Trailing Stop %:** The distance the stop follows behind the price (Optimized Default: 1.5%).
- **TSL Activation % (Delay):** The profit % required before the TSL starts moving. (Optimized Default: 2.0% to ensure 0.5% profit is locked immediately).
- **Initial Fixed Stop Loss %:** Your hard stop if the trade immediately goes against you.
- **Take Profit %:** Your ultimate profit target for the trade.
---
## How to Trade with This Strategy
1. **Identify the Trend:** Look for the Moving Average lines (Close vs Open) to cross.
2. **Wait for Confirmation:** If using MTF, ensure the higher timeframe also shows a trend change.
3. **Manage the Trade:** Let the TSL work. With the default **2.0% Activation** and **1.5% Trail**, the strategy will automatically lock in **0.5% profit** the moment the threshold is hit, then follow the price higher.
4. **Position Sizing:** Adjust the `Properties` tab in the script settings to match your desired capital allocation (Default is 10% of equity).
---
## Recommended Settings
1. Trialing < Activation
2. Check ranging
## Credits
Original Strategy by: **JustUncleL**
Optimized and Enhanced by: **Antigravity AI**

Impulse Trend Suite LITE🚀 Impulse Trend Suite LITE
Smart trend visualization with precise flip arrows. A lightweight, momentum-filtered trend tool designed to stay clean, avoid repeated signals, and keep you focused only on real market direction.
🔍 Quick Guide
BUY setup = green arrow + green background
SELL setup = red arrow + red background
Stay in the move while color doesn’t change
ATR channel helps avoid chasing overextended candles

Elephant Edge Session Levels Predictor**Elephant Edge** is a robust trading tool designed to streamline decision-making for swing and intraday traders alike. It combines accuracy and simplicity to help you spot promising buy and sell signals with ease. The Session Levels Predictor+ feature draws upper and lower percentile lines derived from session data, enabling traders to pinpoint key support and resistance areas accurately. It computes these percentile projections from daily sessions automatically and displays them as sleek, adjustable lines—perfect for intraday and short-term strategies focused on statistical price boundaries.
For **swing traders**, Elephant Edge highlights pivotal market reversals and trend shifts, allowing you to seize bigger trends and maintain momentum. For **intraday traders**, it offers precise buy and sell thresholds, providing reliable entry and exit cues during active market hours.
No matter if you're chasing quick trades or sustaining positions over several sessions, Elephant Edge promotes a methodical and disciplined strategy. Its smart signals cut through market clutter, delivering a solid advantage while eliminating emotional biases.
With **Elephant Edge**, you shift from merely responding to the market to trading with **precision, assurance, and reliability**.

RSI Divergences KittenRSI Divergences + Adjustable RSI σ-Bands + Band Pierce Signals (with optional US weekend filter)
Description:
This indicator combines three RSI tools into one clean workflow:
1. RSI σ-Bands (mean ± k·σ)
It builds dynamic upper/lower bands around RSI using a moving mean and standard deviation. These bands adapt to regime changes (expanding in volatile periods, contracting in quiet periods). Bands can be clipped to RSI’s natural 0–100 range and optionally filled for readability.
2. Band “Pierce” Signals
It prints a marker when RSI crosses outside the upper band (overextension) or outside the lower band (underextension). These pierces are useful as timing signals for mean-reversion setups, especially when you expect price to revert back toward a reference mean (e.g., VWAP). Optional “re-entry” markers show when RSI crosses back inside the bands.
3. Proper RSI Divergences (Regular + Hidden)
Divergences are detected using RSI pivots (not price pivots). At each RSI pivot, the script samples the corresponding price high/low on that pivot bar and compares it to the previous pivot within a configurable bar-distance window.
• Bullish divergence: price lower low + RSI higher low
• Hidden bullish: price higher low + RSI lower low
• Bearish divergence: price higher high + RSI lower high
• Hidden bearish: price lower high + RSI higher high
Line width is configurable for visibility.
Manual Band Adjustment (Near-Miss Control):
If your best reversals “nearly” tag the band, you can manually tune sensitivity without rewriting the math:
• Band offset (RSI points): nudges trigger levels
• Band width scale: tightens/widens the σ-band envelope
US Weekend Filter (Optional):
You can optionally suppress pierce/divergence signals during US weekend hours (Fri 17:00 ET → Sun 17:00 ET) and optionally shade those periods to help isolate low-liquidity behavior.
Notes / Intended Use:
This is designed as a mean-reversion timing tool, not a standalone trading system. For best results, combine signals with a market “mean” (e.g., rolling VWAP) and basic risk controls.


XAUUSD M15 FINALDetects when xausd enters a healthy directional phase during the NY session, and only flags entries with real momentum and controlled volatility.

cd_VW_Cx IMPROVED - Quant VWAP System: Regime, Magnets & Z-ScoQuant VWAP System: Regime, Magnets & Z-Score Matrix
This indicator is a comprehensive Quantitative Trading System designed to move beyond simple support and resistance. Instead of static lines, it uses Statistical Probability (Z-Score) and Standard Deviation to define the current market regime, identify institutional value zones, and project high-probability liquidity targets.
It is engineered for Day Traders and Scalpers (Crypto & Futures) who need to know if the market is Trending, Ranging, or preparing for a Breakout.
1. The "Regime" System (Standard Deviation Bands)
The core engine anchors a VWAP (Volume Weighted Average Price) to your chosen timeframe (Daily, Weekly, or Monthly) and projects volatility bands based on market variance.
The Trend Zone (Inner Band / 1.0 SD): This is the "Fair Value" zone. In a healthy trend, price will pull back into this zone and hold. A hold here signals a high-probability continuation (Trend Following).
The Reversion Zone (Outer Band / 2.0 SD): This represents a statistical extreme. Price rarely sustains movement beyond 2 Standard Deviations without a reversion. A touch of this band signals "Overbought" or "Oversold" conditions.
2. Liquidity Magnets (Virgin VWAPs)
The script automatically tracks "Unvisited VWAPs" from previous sessions. These are price levels where significant volume occurred but have not yet been re-tested.
The Logic: Algorithms often target these "open loops." The script visualizes them as Blue Dashed Lines with price tags.
Smart Scaling (Anti-Scrunch): Includes a custom "Ghost Engine" that automatically hides or "ghosts" magnets that are too far away. This prevents your chart from being squashed (scrunched) on lower timeframes, keeping your candles perfectly readable while still tracking targets in the background.
3. The Quant Matrix (Dashboard)
A real-time Heads-Up Display (HUD) that interprets the data for you:
Regime: Detects Volatility Squeezes. If the bands compress, it signals "⚠ SQUEEZE", warning you to stop mean-reversion trading and prepare for an explosive breakout.
Bias: Color-coded Trend Direction (Bullish/Bearish) based on VWAP slope.
Signal: actionable text prompts such as "BUY DIP" (Trend Following), "FADE EXT" (Mean Reversion), or "PREP BREAK" (Squeeze).
4. Visual Intelligence
Bold Day Separators: Clear, vertical dotted dividers with Date Stamps to instantly separate trading sessions.
Dynamic Labels: Floating labels on the right axis identify exactly which deviation level is which, preventing chart confusion.
How to Use
Strategy A: The Trend Pullback (continuation)
Check Matrix: Ensure Bias is BULLISH (Green).
Wait: Allow price to pull back into the Inner Band (Dark Green Zone).
Trigger: If price holds the Center VWAP or the -1.0 SD line, enter Long.
Target: The next Liquidity Magnet above or the +2.0 SD band.
Strategy B: The Reversion Fade (Counter-Trend)
Check Matrix: Ensure price is labeled "EXTREME" or Signal says "FADE EXT".
Trigger: Price touches or pierces the Outer Band (2.0 SD).
Action: Enter counter-trend (Short) with a target back to the Center VWAP (Mean Reversion).
Strategy C: The Magnet Target
Identify a "MAGNET" line (Blue Dashed) near current price.
These act as high-probability Take Profit levels. Price will often rush to these levels to "close the loop" before reversing.
Settings
Anchor: Daily (default), Weekly, or Monthly.
Magnet Focus Range: Adjusts how aggressively the script hides distant magnets to fix chart scaling (Default: 2%).
Visuals: Fully customizable colors, label sizes, and dashboard position.
