HMA Direction Scalping + Liquidity Zones + Metricsuses hma to determine buy and sell using 9hma for direction.
אינדיקטורים ואסטרטגיות

ORB 5 Min Break & Retest + Alerts By KhanORB 5-Minute Break & Retest Indicator
This indicator plots the high and low of the first 5-minute candle of the trading session (Opening Range). It then monitors price for a breakout above or below the ORB levels and triggers an alert when price retests the broken level and holds.
Designed to help identify high-probability ORB continuation setups with clear visual levels and TradingView alerts.
If you want, I can also:
Make it even shorter (1–2 lines)
Write a more detailed TradingView public script description
Add a usage guide (rules + best timeframe)
Disclaimer:
This is general information only and not financial advice. For personal guidance, please talk to a licensed professional.

Composite Fear & Greed IndexComposite Fear & Greed Index
This is an advanced, professional-grade sentiment analysis engine designed to quantify market psychology. Unlike standard oscillators that rely on a single metric, this script uses a weighted composite of four distinct technical components to generate a holistic "Fear & Greed" score.
It includes Multi-Timeframe (MTF) capabilities, proprietary FOMO/Panic detection logic, and Zero-Lag trend analysis.
1. Unique Mathematical Methodology
This script is not a simple overlay of existing indicators. It uses a Composite Normalization Engine to blend four distinct metrics into a single, bounded 0-100 oscillator.
The "Mashup" Problem Solved: Standard indicators like MACD are "unbounded" (they can go to infinity), while RSI is "bounded" (0-100). You cannot simply average them.
Our Solution: This script calculates the Z-Score of the MACD histogram relative to its historical deviation and normalizes it into a 0-100 percentile. This allows for a mathematically valid combination with RSI and Bollinger Bands.
The Component Logic:
Momentum (RSI): (Weight: 30%) Pure price velocity.
Volatility (Bollinger %B): (Weight: 25%) Relative position within volatility bands.
Trend Strength (Normalized MACD): (Weight: 25%) Uses the custom Z-Score logic described above.
Trend Integrity (ZLEMA): (Weight: 20%) We replaced the standard SMA with a custom Zero-Lag Exponential Moving Average (ZLEMA) algorithm. This removes the "lag" associated with traditional sentiment analysis, allowing the index to react to crypto volatility in real-time.
The Calculation: These raw values are weighted and smoothed to produce the final Index Value.
Greater than 80: Extreme Greed (High risk of reversal)
Less than 20: Extreme Fear (Potential accumulation zone)
2. Unique Features
A. FOMO & Panic Event Detection The script does not just track price; it tracks behavior.
FOMO (Fear Of Missing Out): Triggered when Price breaks the Upper Bollinger Band + RSI is Overbought + Volume spikes > 2.5x the average. This often marks local tops.
PANIC: Triggered when Price drops significantly in one bar + Volume spikes > 3.0x the average + RSI is Oversold. This often marks capitulation bottoms.
B. Divergence Detection The script automatically detects and plots Regular Bullish and Bearish divergences between Price and the Sentiment Index.
Bullish Divergence: Price makes a Lower Low, but Sentiment makes a Higher Low (indicating waning selling pressure).
Bearish Divergence: Price makes a Higher High, but Sentiment makes a Lower High (indicating waning buying pressure). Note: The script plots these signals precisely on the indicator line corresponding to the pivot point.
C. Multi-Timeframe (MTF) Engine Users can view the "Daily" sentiment score while trading on a 5-minute or 15-minute chart. This allows scalpers to align their trades with the higher-timeframe market psychology.
3. Usage Guide
Step 1: Trend Alignment Look at the dashboard or the main line color. Green indicates Greed/Uptrend, Red indicates Fear/Downtrend.
Step 2: Extremes
Sell/Take Profit: When the Index crosses 80 (Extreme Greed) or a "FOMO" triangle appears.
Buy/Long: When the Index crosses 20 (Extreme Fear) or a "PANIC" triangle appears.
Step 3: Confirmation Use the Divergence Dots as confirmation. A "Panic" signal followed by a "Bullish Divergence" dot is a high-probability reversal setup.
Settings
Timeframe: Select the MTF resolution (default is Chart).
Weights: You can adjust the influence of RSI, MACD, BB, or Trend to fit your specific asset class.
Visuals: Fully customizable colors, table position, and toggle switches for shapes/backgrounds.
Disclaimer: This script is for informational purposes only and does not constitute financial advice.

TRADING NAVIGATOR📘 TRADING NAVIGATOR OPERATIONS MANUAL
This manual is designed to turn the script into your complete trading plan.
1. The Golden Rule: Planetary Alignment
Success with this script is not about trading every signal, but waiting for the confluence. Golden Trick: Do not trade on low timeframes (15M) if the trend on the higher timeframe (4H or D) is contrary. The Master Signal: Enter when the RELIABILITY column marks "HIGH" on at least 3 consecutive timeframes.
2. How to open a LONG (Buy) position: Look for these exact conditions on the board: TREND: It should say "BULLISH" (Price above the 200 EMA). ACTION: It should be marked LONG. ENTRY: The price should be near or touching the value indicated in the SUPPORT column. RSI: Ideally between 35 and 45 (healthy pullback) or crossing above 30. Execution: Place your limit order at the ENTRY price on the chart. The TP and SL are your mandatory exit coordinates.
3. How to open a SHORT (Sell) position: Look for these exact conditions on the board: TREND: It should say "BEARISH" (Price below the 200 EMA). ACTION: It should be marked SHORT. ENTRY: The price should be near or touching the value indicated in the RESIST column. (Resistance). RSI: Ideally between 55 and 65 or crossing below 70. Execution: Limit order at the ENTRY price on the chart. Don't chase the price; let it rise to the resistance to enter.
4. Golden Tricks to Gain Consistency: The Volatility Filter: If the VOLAT column shows "HIGH," reduce your position size by half. High volatility means sharp movements that can hit your SL before reaching the TP. The Timeframe Jump: If you see a LONG position on the 15M chart but the trend on the D (Daily) chart is BEARISH, that trade is high risk (pure Scalping). If both are BULLISH, you have a "High Probability Trade." RSI as a sentinel: If the RSI is at 50, the market is indecisive. Wait for it to approach the extremes (30 or 70) so that the Navigator's ACTION has more rebound strength.
5. Recommended Markets:
The TRADING NAVIGATOR is a structure and volatility algorithm, so it works where there is liquidity: Market | Effectiveness | Why |
Cryptocurrencies | ⭐⭐⭐⭐⭐ ATR volatility is best exploited in BTC and ETH. |
Indices (Nasdaq/SP500) | ⭐⭐⭐⭐ Ideal for following the TREND column (EMA 200). |
Forex (Majors) | ⭐⭐⭐ Use it on high-volume pairs (EURUSD, GBPUSD). |
Gold / Oil | ⭐⭐⭐⭐ Very sensitive to the support and resistance levels calculated by the script. |
6. Risk Management (Psychology) | Accepts Stop Loss: The script calculates the SL at 2.0x ATR to give the price "breathing room". If it is touched, the structure has been broken. Don't move the Stop Loss. Partial Taking: When the price has moved 50% of the way to the Take Profit, move your Stop Loss to the ENTRY (Breakeven) price. This ensures that the trade can no longer result in losses.

NeuralFlow Forecast Levels | SPY WeeklyThis is a companion script that plots AI-adaptive market equilibrium & expansion mapping levels for SPY on chart.
NeuralFlow Forecast levels are generated though a Artificial Intelligence framework trained to identify where price is statistically inclined to re-balance and where expansion zones historically exhaust rather than extend.
What the Bands Represent
Band Layer Meaning
AI Equilibrium (white core) Primary weekly balance zone where price is most likely to mean-revert
Predictive Rails (aqua / purple) High-confidence corridor of institutional flow containment
Outer Zones (green / red) Expansion limits where continuation historically decays
Extreme Zones (top/bottom) Rare deviation envelope where auction completion is statistically favored
NeuralFlow operates Artificial Intelligence models trained specifically to map statistical re-balancing behavior, not trader predictions or sentiment. No discretionary drawing. No correlations. No lagging overlays.
This engine updates only when underlying structure changes — not when candles fluctuate intraday.
Risk:
Educational & analytical use only. Not financial advice

Big Notional Volume Bubbles (Lower-TF Order Flow Approximation)Big Notional Volume Bubbles (Lower-TF Order Flow Approximation)
### Overview
This indicator visualizes large notional trading activity by scanning lower-timeframe candles inside each chart bar and highlighting periods where unusually high traded value (volume × price) occurs.
This script is intended to help short-term traders and scalpers identify bursts of aggressive activity, potential absorption zones, and areas of heightened participation, using standard OHLCV data.
Important: This indicator does not access true market order tape or DOM data. It is an approximation based on lower-timeframe OHLCV data provided by TradingView.
What the Indicator Shows
Each bubble represents a lower-timeframe candle where traded notional value exceeds a user-defined threshold.
Bubble size scales with the notional value of that candle.
Green bubbles indicate the lower-timeframe candle closed higher (buy-side pressure approximation).
Red bubbles indicate the lower-timeframe candle closed lower (sell-side pressure approximation).
Bubbles can be plotted at candle closes or wick extremes for contextual analysis.
How It Works
1. Lower-timeframe OHLCV data is requested using `request.security_lower_tf`.
2. Notional value is calculated as volume × price for each micro-candle.
3. The script selects the largest notional events per bar that exceed the minimum threshold.
4. These events are rendered as bubbles on the main price chart.
Intended Use Cases
Scalping and short-term trading
Momentum ignition and continuation analysis
Absorption and failed breakout detection
Effort versus result analysis
Confirmation at key structural levels
Recommended Settings
Lower timeframe: Start with 1 (1 minute). Seconds-based timeframes may not be supported on all feeds.
Minimum notional (USD/USDT):
BTC / ETH: 25,000 – 250,000
Mid-cap assets: 5,000 – 50,000
Adjust based on liquidity and volatility
Max bubbles per bar: 3–8 to avoid visual clutter
Limitations
This indicator does not display individual market orders or aggressor-side execution.
Buy/sell classification is inferred from candle direction, not bid/ask data.
Lower-timeframe data availability depends on the selected symbol and exchange feed.
This tool should not be used as a standalone signal generator.
Best Practices
Use in conjunction with market structure, VWAP, and key price levels.
Focus on price behavior after a bubble appears rather than the bubble itself.
Interpret bubbles as areas of interest, not directional guarantees.

Trend Consensus Engine [TCE]The Trend Consensus Engine (TCE) is a comprehensive market analysis system designed to filter out noise and provide a quantifiable "Trend Score" (0-100). Instead of relying on a single indicator, this script aggregates data from multiple market factors—volatility, momentum, and trend structure—to generate high-probability entry signals based on a consensus logic.
This tool is particularly optimized for Crypto (with specific time-gated logic) and BIST (Borsa Istanbul) markets, allowing traders to see the overall health of the trend at a glance via a dashboard.
How It Works
The engine calculates a composite "Total Score" (0-100) derived from four weighted components:
Trend Structure (AlphaTrend & Guppy):
Analyzes the slope and position relative to the AlphaTrend (Credit to @KivancOzbilgic) and Guppy Multiple Moving Averages (GMMA).
Positive slopes and price action above key levels add points to the score.
Volatility & Momentum (Squeeze & ADX):
Incorporates the Squeeze Momentum logic (Credit to @LazyBear) to detect explosive moves.
ADX Filter: Filters out chopping/ranging markets. If the ADX is too low, the score is penalized or the signal is blocked.
Dynamic Resistance (MA Channels):
Uses a combination of Donchian Mid-Lines and SMAs to determine if the price is in a "safe zone" or hitting resistance.
Price Action Filters (Pinbar Veto):
Automatically detects bearish "Shooting Star" or weak candles at highs. If a bearish pinbar is detected, the entry signal is vetoed regardless of the trend score.
Features & Settings
Smart Scoring Dashboard: Displays the realtime Score, Instant Decision, and confirmed Close Decision on the chart.
Market Profiles:
Crypto Mode: Includes a "Time Gate" feature (07:00 UTC+3 check) to prevent fakeouts during low-liquidity hours.
BIST Mode: Optimized parameters for the Turkish stock market logic (14:00 session checks).
Score Threshold: Users can adjust the minimum score required (Default: 70) to trigger a "BUY" signal.
Visual Guidance: The background of the dashboard changes color (Green/Red/Yellow) based on the consensus.
How to Use
Check the Dashboard: Look at the "SONUÇ" (Result) row.
GİRİŞ ✅ (ENTRY): The Score is above 70, Momentum is positive, and no Bearish Pinbars are present.
BEKLE ⏳ (WAIT): The trend is weak, or a filter (like ADX or Squeeze) is blocking the trade.
Confirm with Price Action: Use the AlphaTrend lines (Blue/Red) as dynamic support/stop-loss levels.
Credits:
AlphaTrend by KivancOzbilgic
Squeeze Momentum Indicator by LazyBear
VuManChu Cipher concepts for inspiration.
Custom Logic: Scoring algorithm and Time-Gating mechanisms are original custom developments.
Disclaimer: This tool is for educational purposes only and does not constitute financial advice.

Muros Multi-TF Pro Dashboard v2fwrvw w fw wf fs rf wf wf jni hb hu huhb yhi ib i ibb uoobu ic biicb ibc bic k

Precision Trendlines - Relevant Current TFPrecision Structural Trendlines (Current TF)
Overview
The Precision Structural Trendlines indicator is a high-performance price action tool designed for traders who rely on market structure and trend convergence. Unlike standard trendline scripts that clutter the chart with every possible connection, this indicator strictly follows professional structural rules—connecting Lower Highs for resistance and Higher Lows for support.
Key Features
Structural Integrity: The engine ensures that resistance lines are only drawn during bearish sequences (Lower Highs) and support lines during bullish sequences (Higher Lows), aligning with core Price Action principles.
Dynamic Relevance Filter: Solve the "web of lines" problem. By default, the script only shows trendlines that are currently relevant to price. As price moves away from old trends, they fade out, keeping your workspace clean.
Zero Drift Synchronization: Built using absolute time-anchoring (xloc.bar_time), ensuring that trendlines stay perfectly "glued" to the candle wicks regardless of how much you scroll or zoom.
Customizable Aesthetics: Choose between Random Dark Colors to easily distinguish overlapping trends or a Static Color for a unified look. Global width controls allow for instant visibility adjustments.
How to Use
Trend Confirmation: Use the Minimum Points setting. Set it to 2 for aggressive, early trend detection, or 3 to only see lines that have been validated by multiple touches.
Major vs. Minor Swings: Adjust the Pivot Strength. A value of 30 (default) captures significant intraday turns, while 20+ is ideal for identifying major swing structure.
Relevance Buffer: Tune the Price Buffer % to determine how close price must be to a historical trendline before it reappears on your chart.
Settings Breakdown
Minimum Points: Number of pivot points required to anchor a line.
Pivot Strength: The "look-left/look-right" requirement to confirm a peak or valley.
Validation Tolerance: The vertical buffer allowed for a 3rd point to "hit" the trendline.
Show Relevant Only: Toggles the visibility filter (highly recommended for high-volume traders).

Structure Lite - Automatic Major Trend LinesStructure Lite – Pivot-Based Market Structure Visualization
OVERVIEW
Structure Lite is an open-source charting tool designed to assist traders in visualizing higher-timeframe market structure. The script identifies major swing points using high-period pivot analysis and projects structural support and resistance lines directly on the chart. Its purpose is to highlight persistent market structure while minimizing visual noise.
CORE CONCEPTS & CALCULATIONS
Pivot Identification
The script uses Pine Script’s built-in ta.pivothigh() and ta.pivotlow() functions to identify confirmed swing highs and lows. A pivot is only validated after a user-defined number of bars (Major Pivot Lookback) have formed on both sides of the price extreme, ensuring that only structurally significant pivots are selected.
Structural Pairing
Each structural line is created only after two consecutive pivots of the same type are confirmed (high-to-high or low-to-low). The script stores the price and bar index of these pivots and uses them as fixed anchor points.
Line Projection
Once a valid pivot pair is formed, the script draws a line between the two points using line.new() and extends it forward using extend.right. These lines represent projected structural boundaries rather than trade signals.
Object Management
To maintain chart clarity and performance, the script manages all drawn objects through a line array. A FIFO (First-In, First-Out) method is applied so that only the three most recent structural lines remain visible. Older lines are automatically deleted as new ones are created.
DESIGN PHILOSOPHY & ORIGINALITY
While many indicators plot frequent swing points or short-term pivots, Structure Lite focuses on structural persistence. By filtering for higher-period pivots and limiting the number of displayed projections, the script emphasizes dominant market structure rather than short-term fluctuations. This approach is intended to support discretionary analysis, not replace it.
HOW TO USE
Major Pivot Lookback
Increase the value to focus on higher-timeframe structure (e.g., swing or position trading).
Decrease the value to visualize intraday structural levels.
Visual Encoding
Green lines represent projected structural support
Red lines represent projected structural resistance
Visibility Control
A boolean input allows all structure lines to be hidden instantly to restore a clean price chart.
LIMITATIONS & DISCLAIMER
This script is a visualization tool only. It does not generate trade signals, entry or exit points, alerts, or directional forecasts. All plotted levels are derived from historical price action and may change as new pivots form. The script is provided for educational and analytical purposes and should be used in conjunction with other forms of market analysis

Multi-Ticker Overlay V6 [SPY/QQQ/ES]Key Improvements in this Version:Triple Ticker Support: You now have three distinct sections in the settings (SPY, QQQ, and ES1!). You can toggle them on or off individually.Flexible Symbols: While I defaulted them to SPY, QQQ, and ES, you can use the Ticker Symbol input to change them to anything (e.g., change ES to "DIA" to see Dow Jones levels).Decimal Increments: I changed the increment to a float. You can now set SPY to 1.0 and QQQ to 0.5 or 5.0 depending on how much "clutter" you want.Individual Aesthetics:Colors: Each ticker has its own color picker.Labels: Labels are prefixed with the symbol name (e.g., "QQQ 450") so you don't get confused about which line belongs to which ticker.Smart Ratio Engine: All three tickers respect the "Freeze at 16:00" rule if you turn it on, ensuring the levels stay mathematically accurate based on the market close.Note on Performance: Because this script draws many lines (up to 3 tickers $\times$ 21 lines each), I set the extend to none. The lines will appear as short segments to the right of the current price to keep your chart clean.

XAUUSD M15 momentum realDetects when xausd enters a healthy directional phase during the NY session, and only flags entries with real momentum and controlled volatility.

king 3//@version=5
indicator("BTC_QQQ_Crown_Indicator", overlay=true)
// 1. MACD Numbers (8, 16, 11)
= ta.macd(close, 8, 16, 11)
// 2. Engulfing Candle Logic
bull = close < open and open < close and close > open
bear = close > open and open > close and close < open
// 3. Crown Signal Condition
crownBuy = bull and hist > hist
crownSell = bear and hist < hist
// 4. Drawing Crowns on Chart
plotshape(crownBuy, title="Buy_Crown", style=shape.labelup, location=location.belowbar, color=color.yellow, size=size.normal, text="👑 BUY", textcolor=color.black)
plotshape(crownSell, title="Sell_Crown", style=shape.labeldown, location=location.abovebar, color=color.red, size=size.normal, text="👑 SELL", textcolor=color.white)


Minervini Template + Powerplay detectorMinervini Template + PowerPlay Detector
This indicator implements a rule-based Minervini trend template to identify stocks in strong, institutionally supported uptrends, combined with a Power Play momentum detector for explosive leadership moves.
Minervini Model (MM) Rules
The MM dashboard turns GREEN only when all of the following rules are met:
Close ≥ 150-day SMA
Close ≥ 200-day SMA
50-day SMA > 150-day SMA
50-day SMA > 200-day SMA
150-day SMA ≥ 200-day SMA
200-day SMA is rising (current value higher than ~1 month ago)
Close is at least 30% above the 52-week low
Close is within 25% of the 52-week high
Close is not more than 8% below the 50-day SMA
These rules ensure:
Proper long-term trend structure
Institutional accumulation alignment
Strength near highs, not extended weakness
When MM is red, hovering over it shows exactly which rules failed, allowing quick diagnosis of why a stock does not qualify.
POWERPLAY Logic
POWERPLAY highlights rare, high-velocity leadership moves:
Triggers when a stock gains 90% or more within any rolling window of up to 60 trading sessions
Remains active as long as the condition continues to hold
Hover tooltip displays:
Start date of the move
Current date
Total percentage gain so far
This captures fast institutional momentum, even if the move occurs in fewer than 60 sessions.
Dashboard Features
Moveable to any corner of the chart
Adjustable size
Adjustable opacity
Designed for trend followers and momentum traders seeking true market leaders, not short-term noise or late-stage breakouts.

Trinity Swing Trading Buy and SellThis is a simple little Heiken Ashi MA + ADX & MACD trend-following trading system designed to capture medium- to longer-term moves while filtering out noise and weak trends. It combines modified Heiken Ashi candles (for smoother trend detection) with a moving average alignment, plus optional confirmation from ADX (trend strength) and MACD (momentum).
In practice, the indicator works well on higher timeframes (e.g., 1H, 4H, daily) where trends are more sustained. It performs best in trending markets and naturally avoids choppy/range-bound conditions thanks to the ADX filter (requiring ADX > 20 by default). All key components are fully customizable, so you can disable filters or adjust parameters to suit different instruments (stocks, forex, crypto, futures).
Default settings are:
16 HMA
8,17,9 MACD
15,20 ADX
Recommend to add an additional longer term EMA like 200 for long term trend confirmation.
Adjust inputs in the settings panel as needed:
Toggle MA, ADX, or MACD filters on/off.
Change MA type/length, MACD parameters, ADX threshold
- Use the visual blue diamonds (below bars) for long entries and purple diamonds (above bars) for short entries as confirmation of signals.
- Set alerts on the "Buy Alert" and "Sell Alert" conditions if you want real-time notifications.
This setup gives you a complete, rule-based system that avoids emotional trading and repetitive entries, making it suitable for both backtesting and live trading with proper risk management.

Liquidity ZonesLiquidity Zones
Liquidity Zones is a price-action–based indicator designed to identify high-probability support and resistance areas where liquidity has historically accumulated.
Instead of drawing single lines, the script builds dynamic price zones based on repeated pivot reactions validated by volume, helping traders focus on meaningful levels rather than noise.
How It Works
Pivot Detection
The indicator scans historical price data for pivot highs and pivot lows using a fixed pivot strength.
Each pivot represents a potential liquidity interaction point.
Volume Qualification
A pivot is only considered valid if the volume at the pivot bar exceeds:
Volume SMA × Sensitivity
This filters out weak or low-participation levels and keeps zones formed during strong market interest.
Zone Construction
Nearby pivots are grouped into a single zone if their price difference stays within an ATR-based threshold.
Each time price reacts within this threshold, the zone’s touch count increases.
Once the minimum number of touches is reached, a liquidity zone is drawn and extended to the right.
Adaptive Zone Expansion
As new qualifying pivots appear, zones automatically expand to reflect the true liquidity range instead of staying static.
Dynamic Zone Coloring
Zones update their color in real time based on price position:
Green (Support) → Price is above the zone
Red (Resistance) → Price is below the zone
Gray (In-Zone) → Price is trading inside the zone
This allows instant visual feedback on whether a level is acting as support, resistance, or an active liquidity area.
Settings Overview
Bars to Apply
Controls how much historical data is scanned for liquidity zones.
Volume Sensitivity
Higher values require stronger volume spikes to validate pivots, resulting in fewer but higher-quality zones.
Styling Options
Fully customizable colors and transparency for support, resistance, and in-zone states.
Best Use Cases
Identifying high-liquidity support and resistance zones
Planning entries, exits, and stop placement
Combining with trend-following or momentum indicators
Filtering out weak levels in sideways or choppy markets

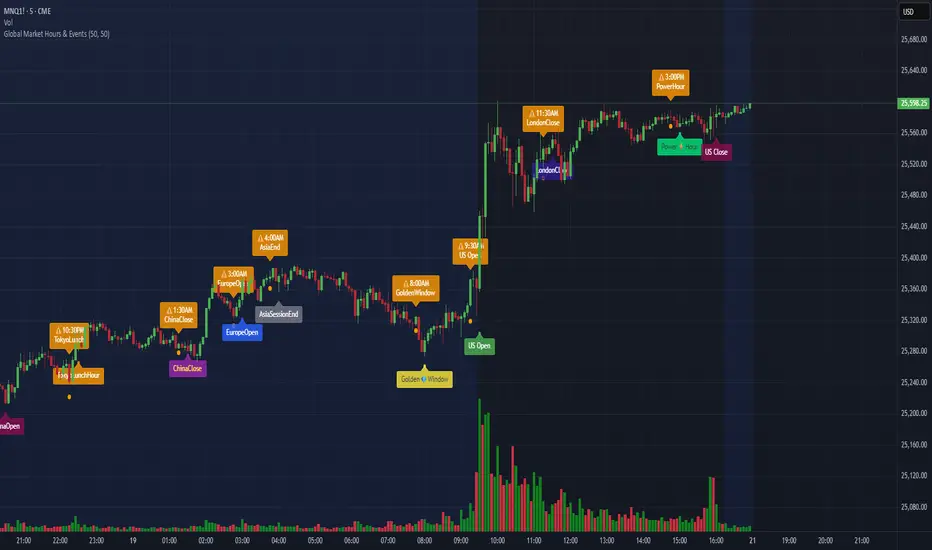
Global Market Hours & Eventswww.tradingview.com
Global Market opens and closes and other related events,
15min warning ahead of time, visual indicator for warning and for the event
not over-crowded with the possibility to remove labels and have just a little circle marker.
Adjustements for labels and circles are in the settings
Activate Pane Label to identify
Razzere Cloned! V.8.1The foreign exchange market (forex, FX, or currency market) is a global decentralized or over-the-counter (OTC) market for the trading of currencies. This market determines foreign exchange rates for every currency. By trading volume, it is by far the largest market in the world, followed by the credit market.
The main participants are the larger international banks. Financial centres function as anchors of trading between a range of multiple types of buyers and sellers around the clock, with the exception of weekends. As currencies are always traded in pairs, the market does not set a currency's absolute value, but rather determines its relative value by setting the market price of one currency if paid for with another. Example: 1 USD is worth 1.1 Euros or 1.2 Swiss Francs etc. The market works through financial institutions and operates on several levels. Behind the scenes, banks turn to a smaller number of financial firms known as "dealers", who are involved in large quantities of trading. Most foreign exchange dealers are banks, so this behind-the-scenes market is sometimes called the "interbank market". Trades between dealers can be very large, involving hundreds of millions of dollars. Because of the sovereignty issue when involving two currencies, Forex has little supervisory entity regulating its actions. In a typical foreign exchange transaction, a party purchases some quantity of one currency by paying with some quantity of another currency.

Statistical Deviation per AssetINDICATOR: STATISTICAL DEVIATION PER ASSET (SDPA)
1. Overview
The Statistical Deviation per Asset (SDPA) is a quantitative analysis tool designed to measure the strength and exhaustion of price movements. Unlike standard oscillators (like RSI ), the SDPA calculates the actual percentage deviation from the most recent pivot point (High or Low) and compares it against historical performance averages specific to each asset.
---
2. Core Logic & Calculation
The script operates on a Mean Reversion principle. It assumes that every asset (Gold, Bitcoin, Ethereum, etc.) has a unique "volatility signature" depending on the timeframe.
* Dynamic Pivot Detection : The indicator identifies recent Swing Highs and Swing Lows using an adaptive lookback period.
* Real-Time Return Calculation : Once a pivot is confirmed, the script calculates the real-time percentage gain (from a Low) or loss (from a High).
* Zero-Indexed Histogram : This return is plotted as an oscillator centered around a Zero Line , representing the current trend's progress since the last reversal.
---
3. Adaptive Intelligence (Multi-Asset & Multi-TF)
The SDPA is pre-loaded with a statistical database. It automatically adjusts its sensitivity and thresholds based on:
1. The Selected Asset : Whether trading XAUUSD , Bitcoin , or Solana , the deviation thresholds adapt to the specific volatility of that instrument.
2. The Timeframe (TF) : The calculation period ( period ) and performance targets ( hausse_perf / baisse_perf ) change dynamically. For example, a 1-minute scalping setup uses a longer lookback (200) compared to a Daily swing setup (10).
---
4. Visual Anatomy
The interface is designed for instant "at-a-glance" interpretation:
* The Histogram :
* Green : Price is trending up since the last Swing Low .
* Red : Price is trending down since the last Swing High .
* Threshold Lines (The Statistical Averages) :
* Thick Line (60% Opacity) : Represents the Average Historical Deviation . When the histogram hits this line, the move is considered "statistically mature."
* Thin Line (70% Opacity) : Represents the Strong Deviation Zone (1.5x the average), indicating extreme momentum or potential exhaustion.
* Background Highlighting : The chart background colors automatically when the price exceeds historical averages, signaling a High-Probability Reversal Zone .
---
5. How to Trade with SDPA
* Trend Maturity : If the histogram exceeds the Bullish Average (Green line), the current move has reached its typical historical limit. Traders should look for take-profit opportunities or wait for a reversal.
* Impulse Strength : A rapid move from the Zero Line toward the thresholds confirms strong institutional interest.
* Mean Reversion : When the histogram reaches the Strong Zone (1.5x), the price is "overextended" statistically, offering a high reward-to-risk ratio for counter-trend setups.
---
6. Technical Parameters
* Asset Choice : Dropdown menu to select the specific asset.
* Colors : Customizable Bullish and Bearish colors to match any UI theme.
* Precision : Set to 4 decimal places to ensure accuracy across all asset types.

NeuralFlow Forecast Levels - User InputsThis is a companion indicator that plots AI-adaptive market equilibrium and expansion mapping levels directly on the SPY chart.
NeuralFlow Forecast Levels are generated through a Artificial Intelligence framework trained to identify:
Where price is statistically inclined to re-balance
Where expansion zones historically exhaust rather than extend
This is structure mapping, not prediction.
......................................................................................
What the Bands Represent?
AI Equilibrium (white core)
Primary weekly balance zone where price is most likely to mean-revert.
Predictive Rails (aqua / purple)
High-confidence corridor of institutional flow containment.
Outer Zones (green / red)
Expansion limits where continuation historically begins to decay.
Extreme Zones (top / bottom)
Rare deviation envelope where auction completion is statistically favored.
.The engine updates only when underlying structure changes —
not when candles fluctuate intraday.
.................................................................................................................
Usage Context
These levels are contextual reference zones, not entry signals. They are designed to answer:
Where does price matter?
Where does continuation weaken?
Where does balance statistically reassert itself?
Risk Disclaimer
Educational and analytical use only. Not financial advice.

Fair Value Gap [Tradeuminati]Fair Value Gap
Fair Value Gap is a clean and rule-based Fair Value Gap indicator for TradingView, designed to display only valid and confirmed Fair Value Gaps (FVGs) and Inverted Fair Value Gaps (iFVGs).
The indicator is built on a strict 3-candle FVG definition and operates exclusively on candle close, ensuring no repainting and no premature signals.
🔹 Key Features
Valid Fair Value Gaps (FVG)
- Detects bullish and bearish Fair Value Gaps using a precise 3-candle structure
- FVGs are only plotted after the confirming candle has closed
- A Fair Value Gap remains visible only as long as it is valid
- Once price closes beyond the FVG, it is removed or converted
Inverted Fair Value Gaps (iFVG)
- When a valid FVG is invalidated by a candle close, it can be converted into an iFVG
- iFVGs retain the original price range and structure
- Only valid iFVGs are displayed
- As soon as price closes through an iFVG, it is automatically removed
Clean & Controlled Visualization
- Only the last N active FVGs are displayed (bullish + bearish combined)
- Only the last N valid iFVGs are shown
- Boxes automatically extend to the current price + configurable bars
- Labels are dynamically positioned at the right edge of each zone
🔹 Technical Notes
- No repainting
- No intrabar signals
- Close-based validation only
- Works on all markets and timeframes
- Lightweight and performance-friendly
⚠️ Disclaimer
This indicator is for technical analysis purposes only and does not constitute trading or investment advice.

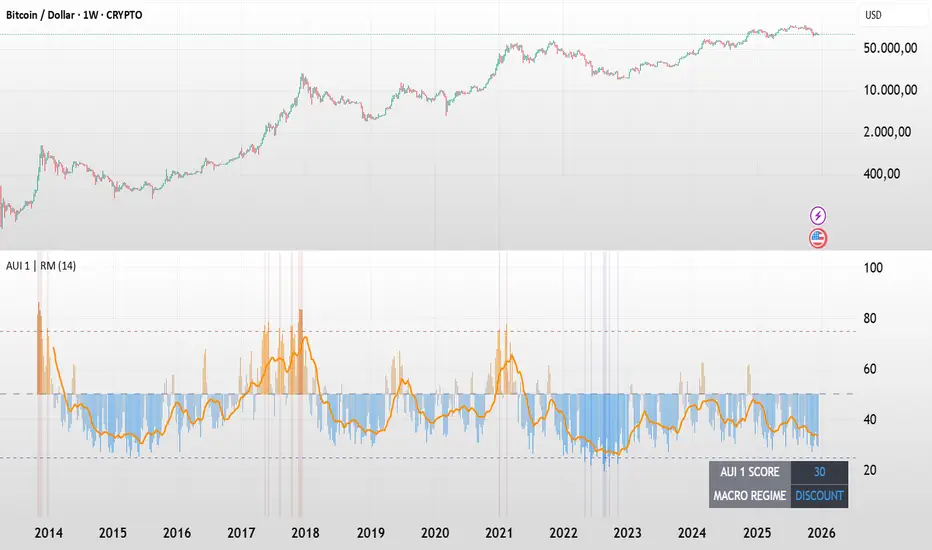
BTC - AUI 1: Macro Sentiment & On-Chain CompositeBTC - AUI 1: Macro Sentiment & On-Chain Composite | RM
Overview & Philosophy The AUI 1 ( Another Ultimate Indicator, Volume 1 ) is a 10-pillar quantitative composite designed to solve the "noise problem" in Bitcoin analysis. Most traders fail because they rely on a single metric in isolation. The AUI 1 aggregates ten distinct dimensions of the network — from speculative flow to institutional extension — into a singular 0–100 score.
The 10-Pillar Quant Framework
Each pillar is mathematically normalized to a standardized 0 to 10 scale . The sum of these pillars creates the final 0–100 index:
1. BEAM (Adaptive Logarithmic Multiple)
• Method: Log-deviation from the 4-year cycle mean.
• Logic: Measures price distance from its fundamental growth curve.
(Credit: BitcoinEcon)
2. MVRV Z-Score (Statistical Distance)
• Method: Standard deviations between Market Cap and Realized Cap.
• Logic: Identifies historical "Fair Value" vs. "Bubble" extremes.
(Credit: M. Mahmudov & D. Puell)
3. Metcalfe’s Law (Network Utility)
• Method: Logarithmic scaling of Active Addresses.
• Logic: Ensures price growth is supported by actual user adoption.
(Credit: T. Peterson)
4. RHODL Proxy (Speculative Flow)
• Method: Supply rotation intensity between HODLers and New Money.
• Logic: Cycle peaks are defined by "Old Money" distributing to "New Money."
(Credit: Philip Swift)
5. AXIS Momentum (Structural Trend Intensity)
• Method: Dual-speed Rate of Change (RoC) fusion engine.
• Logic: Identifies the acceleration and "torque" of the macro trend.
(Credit: Rob_Maths)
6. Mayer Multiple (Institutional Extension)
• Method: Raw distance from the 200-day SMA.
• Logic: Tracks the primary anchor used by institutional mean-reversion desks.
(Credit: Trace Mayer)
7. Unrealized Profit (Financial Pressure)
• Method: Absolute MVRV Ratio mapping.
• Logic: Measures the financial "stress" or "greed" held by the average holder.
8. Retail Participation (Psychology Proxy)
• Method: Inverted Log-Average Transaction Size (USD).
• Logic: Declining transaction sizes historically signal retail FOMO (Euphoria).
9. Volatility Overextension (Structural Risk)
• Method: 30-day Standard Deviation relative to the mean.
• Logic: High-intensity volatility clusters often precede cycle trend-shifts.
10. Macro RSI (Cycle Maturity)
• Method: High-timeframe momentum saturation levels.
• Logic: Identifies the statistical "Buying Exhaustion" of a macro move.
(Credit: J. Welles Wilder Jr.)
How to Read the AXIS Quadrants
The AUI 1 uses a Seamless Heatmap to categorize the market into four specific macro regimes:
❄️ 0–25: FROZEN (Deep Blue) Maximum Opportunity. Structural capitulation where only long-term conviction remains. Historically the "Generational Wealth" window.
🔵 25–50: DISCOUNT (Light Blue to Gray) Value Accumulation. The market is cooling down; risk is mathematically low, and the network is building a structural floor.
🟠 50–75: EXPANSION (Gray to Orange) Trend Acceleration. Healthy bullish growth supported by network utility and positive momentum.
🔥 75–100: SCORCHED (Orange to Deep Red) Terminal Euphoria. Maximum Risk zone. Speculative FOMO is at its peak; the market is fundamentally overextended.
The Orange Signal Line
To filter short-term noise, the AUI 1 includes a Signal Smoothing Line (Parametrizable).
• Cycle Confirmation: Index Bars crossing above the Signal Line indicates trend acceleration.
• Peak Confirmation: If the Index Score rolls over and breaks below the Signal Line while in the SCORCHED zone, the cycle peak is likely confirmed.
Credits & Data Built by Rob_Maths (2025) using on-chain frameworks from Glassnode and IntoTheBlock. Special recognition to the pioneers: Murad Mahmudov, David Puell, Philip Swift, Trace Mayer, and Timothy Peterson.
Strategic Recommendation: For the most accurate macro cycle signals and to filter daily market noise, it is strongly recommended to use this indicator on the Weekly (1W) timeframe.
⚠️ Data Requirement Note: This quantitative composite utilizes professional on-chain data feeds, specifically GLASSNODE:BTC_ACTIVEADDRESSES , GLASSNODE:BTC_ACTIVE1Y , and INTOTHEBLOCK:BTC_MVRV . A TradingView paid plan (Essential or higher) may be required to access these institutional data streams.
Disclaimer This script is for macro-economic research purposes. It is a probabilistic model, not a crystal ball. Past performance is not a guarantee of future results.
Tags:
bitcoin, btc, on-chain, macro, composite, mvrv, rhodl, momentum, index, valuation, active-addresses, cycles, sentiment, risk, AUI, Rob Maths