GuidedByGod-Vertical Timestamp-GOD MODEmaximum 15 custom vertical lines for time based study-timing might be off by Hour or so , will fix in future iteration , for now does the job
אינדיקטורים ואסטרטגיות

BTC - Institutional Cost Corridor (Overlay)BTC - Institutional Cost Corridor | RM
Strategic Context
The approval of Spot Bitcoin ETFs on January 11, 2024, signaled the beginning of the "Institutional Era." Since then, price discovery has shifted from being purely retail-driven to being heavily influenced by massive, off-chain equity flows.
The Institutional Cost Corridor is an approach for a quantitative tool designed to solve the problem of "Institutional Blindness" by mapping the aggregate cost basis of Wall Street's entry. It allows for the identification of structural "gravity zones" where institutional capital is most likely to move from a state of profit into a state of defense.
The Methodology: Data Selection & Weighting
To ensure the output is statistically significant, the data engine focuses exclusively on the "Big 3" liquidity providers: BlackRock (IBIT), Fidelity (FBTC), and Bitwise (BITB). These three funds represent over 80% of total Spot ETF liquidity. A weighted ratio is applied (prioritizing BlackRock) to reflect the reality that a dollar flowing into IBIT has a significantly higher impact on market structure than a dollar in smaller, fragmented funds. This ensures the indicator follows the actual mass of institutional capital.
Recalculating the Shadow: Nominal Price & AUM
A common point of confusion is that Bitcoin ETFs have a completely different nominal price than Bitcoin itself (e.g., an IBIT share may trade at $50 while BTC is at $100,000). To solve this, the script does not look at the dollar price of the shares. Instead, it uses Assets Under Management (AUM) and Relative Performance Mapping . By calculating the percentage growth of the funds' underlying value since inception and projecting that growth onto the Bitcoin price axis, the script "re-scales" the institutional entry levels. This allows us to see exactly where Wall Street is "underwater" on a standard Bitcoin chart.
The Mathematical Foundations: Genesis vs. Anchored
The indicator utilizes two distinct mathematical approaches to triangulate the "Truth" of institutional positioning. These are not arbitrary assumptions, but forward-mapped models verified against professional financial benchmarks.
1. Conservative Floor (Genesis Mode)
• The Logic: This model uses a Cumulative Inflow VWAP . It treats every dollar that has entered the ETFs since Day 1 as part of a single, massive ledger.
• Scientific Justification: This approach maps to the "Fortress Zone" of early, high-conviction capital. Historical AUM performance data suggests that the largest influx of structural capital occurred during the launch phase of 2024. This logic identifies the Ultimate Floor —the level where the entire ETF cohort would flip to a net loss. In late 2025 research (e.g., Glassnode "True Market Mean"), this model consistently aligns with the deepest structural support of the bull cycle.
2. Wall Street Entry (Anchored Mode)
• The Logic: This model utilize a Relative Performance Anchor . It synchronizes the Bitcoin price on Launch Day with the growth performance of the ETF fund shares.
• Scientific Justification: This approach identifies the "Active Participant Basis." It reflects the entry price for the capital that fueled the most recent expansion cycles. It maps directly to the "Active Investors' Realized Price" cited by institutional research firms, identifying the immediate psychological "pain threshold" for the current market majority.
3. Institutional Mean (Hybrid Mode)
• The Logic: A 50/50 mathematical blend of the Conservative Floor and the Wall Street Entry .
• Justification: This is the "Equilibrium Zone." It serves as a neutral baseline by balancing early-stage "Genesis" conviction with late-cycle volatility. It represents the median cost basis of all current institutional holders.
4. The Shadow Corridor (Full Range)
• The Logic: Visualizes the entire spread between the Conservative Floor and the Wall Street Entry.
• Justification: The "Structural Support Cloud." Instead of a single price, it defines a regime . As long as Bitcoin remains above this cloud, the institutional trend remains in an "Expansion Phase." A re-entry into this corridor suggests a transition from a trending market into a value-accumulation phase.
Tactical Playbook: Scenario Logic
The Shadow Corridor (Full Range) visualizes the area between these two models, creating an "Institutional War Zone."
• Active Support Test: When price tests the Wall Street Entry (upper boundary), it indicates the active institutional majority is at breakeven. Expect significant defensive buying (bids) as funds protect their yearly performance reports.
• Deep Value Regime: Trading inside the Corridor is defined as a "Value Regime." This is where institutional accumulation historically absorbs retail capitulation.
• The Premium Trap: When the distance between price and the Corridor exceeds 35-40%, the market is "speculatively overextended," signaling a high probability of mean-reversion.
• Macro Breakdown: A Weekly (1W) candle closing below the Conservative Floor (lower boundary) signals a structural trend shift, indicating the majority of ETF-era capital is officially in a drawdown.
Operational Recommendation Best viewed on the Daily (1D) timeframe for macro structural analysis, providing the most reliable signal for institutional defense zones.
Tags: bitcoin, btc, etf, blackrock, ibit, institutional, cost-basis, vwap, macro, cycle, realized-price, Rob Maths

High/Low Tracker ARDR/ADR V4High and lows in 2 timeframes
16:00 -> 03:55
19:30 -> 02:55
Toggle on/off of
- Auto extending untill 09:25
- Live updating during price action
Configure linestyles, box styles
It is now displaying correctly for both CL and ES

BHUVANA Fib 50/61.8 Stairs with RR Targets Fib 50–61.8 Stairs with RR Targets (debug) automatically tracks the latest swing and draws a 50%–61.8% Fibonacci pullback zone as step-like “stairs.” From that zone it plots a planned trade framework: entry reference, stop/invalidation, and multiple Risk:Reward targets (e.g., 1R/1.5R/2R/3R).
What it’s for
Visualize the “buy/sell pullback” area (50–61.8) in trending moves
Standardize exits with RR targets instead of guessing
Quickly see when the swing/zone updates as structure changes
How to use (simple)
Wait for a clear impulse swing to form.
Let price retrace into the 50–61.8 zone.
Take entries only with your own trigger (reclaim / rejection / BOS).
Use the plotted stop and RR targets for management.
Inputs
Swing detection / lookback
RR multiples and target count
Show/hide stairs, labels, debug visuals
Important
This is a mapping tool, not a standalone signal. If you trade every touch of 50–61.8 without confirmation, you’ll get chopped. Debug version may show extra visuals and can repaint on swing updates. Not financial advice.

Anurag -Precision Options Scalper [Multi-TF] -A professional-grade options day trading system built for SPY, QQQ, and SPX.
CORE FEATURES:
- Multi-timeframe analysis (15m regime → 5m setup → 1m execution)
- Market regime detection using ADX + ATR Z-Score (filters out chop)
- Confidence scoring system (0-100) — only takes high-probability setups
- Auto DTE engine recommends 0DTE vs 1DTE based on conditions
- Suggested strike prices (slightly OTM)
- Built-in position tracking with stop/target levels
- Session filtering (9:30 AM - 4:00 PM ET only)
- End-of-day forced exit warning
SIGNAL LOGIC:
CALL: 15m bullish bias + trending regime + price above VWAP/EMAs + pullback to support + bullish candle + 1m momentum confirmation
PUT: 15m bearish bias + trending regime + price below VWAP/EMAs + rejection from resistance + bearish candle + 1m momentum confirmation
RISK MANAGEMENT:
- ATR-based stops and targets
- Break-even stop movement after partial profit
- Time-based exit if momentum dies
- Max 4 trades per day (configurable)
- Gamma scalp mode for 0DTE (tighter stops/targets)
BEST ON: 5-minute chart | SPY, QQQ, SPX
STYLE: Pullback entries in trending markets
⚠️ For educational purposes. Not financial advice. Manage your own risk.

IV Rank as a Label (Top Right)IV Rank (HV Proxy) – Label
Displays an IV Rank–style metric using Historical Volatility (HV) as a proxy, since TradingView Pine Script does not provide access to true per-strike implied volatility or IV Rank.
The script:
Calculates annualized Historical Volatility (HV) from price returns
Ranks current HV relative to its lookback range (default 252 bars)
Displays the result as a clean, color-coded label in the top-right corner
Color logic:
🟢 Green: Low volatility regime (IV Rank < 20)
🟡 Yellow: Neutral volatility regime (20–50)
🔴 Red: High volatility regime (> 50)
This tool is intended for options context awareness, risk framing, and volatility regime identification, not as a substitute for broker-provided IV Rank.
Best used alongside:
Options chain implied volatility
Delta / extrinsic value
Time-to-expiration analysis
Note: This indicator does not use true implied volatility data.

SB A / A++ ALERT ENGINE (Alerts Only)SB A / A++ Alert Engine
Session-Based Level Rejection Strategy (Automation-Ready)
Overview
The SB A / A++ Alert Engine is a rules-based TradingView indicator designed to identify high-probability institutional-style reversal trades using Stacey Burke–inspired concepts such as previous day levels, session structure, opening ranges, and round numbers.
This tool is alerts-only by design, making it ideal for:
TradingView alerts
Webhook automation
Telegram / Discord signal delivery
External trade execution systems
It does not repaint and evaluates signals on confirmed bar close only.
---
Core Trading Idea
Price frequently reacts at important reference levels during active trading sessions.
This script looks for rejection + confirmation at those levels and grades setups based on confluence and candle quality.
Only A-grade and A++-grade setups are alerted.
---
What the Script Detects
📌 Key Levels (Confluence Engine)
Previous Day High / Low
Initial Balance (Mon–Tue range, active Wed–Fri)
Session Opening Range (first hour of London / NY)
Round Numbers (configurable tick spacing)
Each level touched contributes to confluence — without double-counting the same zone.
---
🕒 Session Control
Signals are only allowed during:
London Session
New York Session
Includes:
Session resets
Max alerts per session
Cooldown between signals
---
🔎 Candle Confirmation
Valid signals require clear rejection behavior, such as:
Bullish / Bearish Engulfing candle
Strong Pin Bar (wick ≥ 2× body)
---
🧠 Trade Grades
A Trade
Valid session
ATR percentile filter passed
≥ 1 level of confluence
Directional rejection
A++ Trade
All A-Trade rules
Strong confirmation candle (engulf or pin)
≥ 2 independent confluence zones
Grades are displayed visually and included in alert payloads.
---
📊 Volatility Filter (ATR Percentile)
Instead of fixed ATR thresholds, the script uses an ATR percentile rank, ensuring trades only trigger when volatility is above normal for that market.
This adapts automatically across:
Forex
Indices
Futures
Crypto
---
Visual Output
▲ Green / Lime triangles → LONG (A / A++)
▼ Orange / Red triangles → SHORT (A / A++)
Color intensity reflects trade grade
Optional session shading (if enabled)
---
Alerts & Automation
All alerts are webhook-ready and structured for automation.
Each alert includes:
Symbol
Timeframe
Direction (LONG / SHORT)
Trade grade (A or A++)
Confluence count
Entry price (close of signal bar)
Designed to integrate with:
Telegram bots
Trade execution bridges
Risk management engines
---
What This Script Is (and Is Not)
✅ IS
A high-quality signal engine
Non-repainting
Automation-friendly
Institutional level-based logic
❌ IS NOT
A scalping indicator
A prediction tool
A “trade every candle” system
This tool favors patience, structure, and quality over frequency.
---
Recommended Usage
Timeframes: M5 – M15
Best markets: FX majors, indices, liquid crypto
Combine with your own execution, risk, and trade management rules
---
⚠️ Disclaimer
This script is for educational and informational purposes only. It does not constitute financial advice. Always test on demo or paper trading before using live capital.

Multiple Time Frame Stoch-RSIThis indicator is designed to show users the values for default stochastic RSI and default RSI settings across multiple time frames.
I have made many bad trades focusing too closely on one particular time frame and indicators that suggest the price will move one way, to be superseded by a higher timeframe pushing price in another direction.
The timeframes are customisable so you can select your own timeframes, but the default timeframes chosen here are part of the BareNaked Crypto or Naked Nation strategy, looking at timeframes in multiples of 3 for lower timeframes.
The idea in its simplest form is that when timeframes like the 3/6/9m are all over sold or over bought (coloured red or green) then it could be a suitable time to place an order. Or at least be more favourable for your trade.
This indicator as with all indicators is designed as a tool to add to whatever arsenal of strategy or tools you are already using and does not constitute financial advice, just be cause 3/6/9m is in red or green does not guarantee that the trade will go your way.
The orange on the timeframes are generally designed to show users where price can reverse so for example if the stochastic 3m is at 10 and in green, but the 9m is at 65 in orange, it could be that a push up is not finished and the 9m drop from oversold to 65 could be reversed due to a low 3m stochastic number and then 9m goes from 65 back up to 100, and vice versa.
The arrows for direction also allow you to quickly deduce the direction of the stochastic RSI, ^ up, V down, and stable -. this should allow you to see if the stochastic has been rising and is beginning to turn around or not.

King Trade 4-hour buy/sell strategyThis is a buy/sell system for 4-hour candlestick charts. For best results, use it on Heiken Ashi candlestick charts.

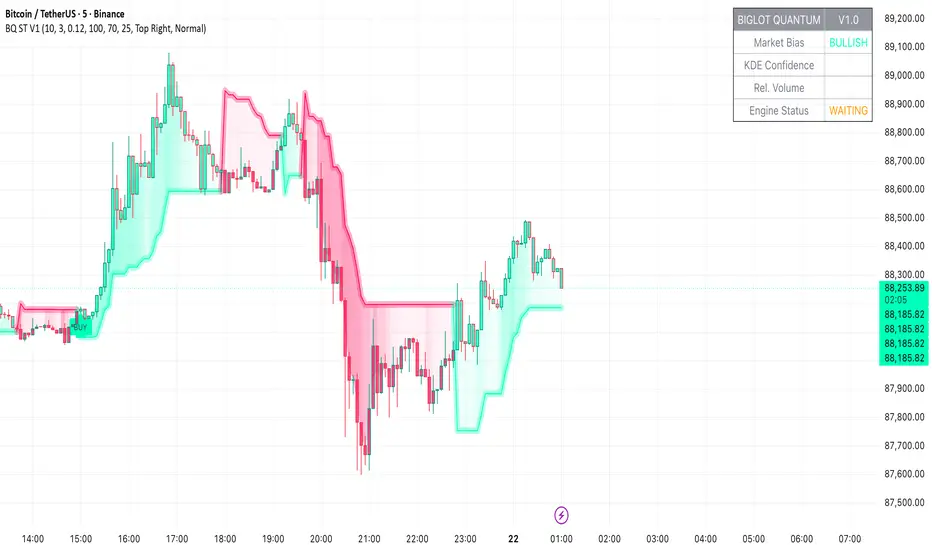
BigLot Quantum SuperTrend V1BigLot Quantum SuperTrend V1 is a trend-following indicator that enhances the traditional SuperTrend by integrating statistical volume analysis.
The script combines an ATR-based SuperTrend engine with Kernel Density Estimation (KDE) applied to relative buy and sell volume. Volume behavior is modeled statistically, allowing the indicator to filter breakout signals and activate only when volume conditions show high probability compared to historical data.
Bullish and bearish signals are generated when price crosses the SuperTrend line and the corresponding volume probability exceeds a user-defined threshold. This approach helps reduce false signals during low-liquidity or sideways market conditions.
The script includes visual trend highlighting, probability-based confidence filtering, and a real-time dashboard displaying trend direction, volume strength, and signal status. It is designed to work across all markets and timeframes without repainting.
RVOL Text This script will give you the Relative volume at the time in a numbered text on your charts.

Day-Week-Month-Hour Separator [TickDaddy]As the title shows.
Separator lines for Hours/Days/Weeks/Months. customize as you please :)

MA150 RespectRatio NoamzThis indicator measures how reliably price respects the 150-day moving average as support.
It computes an empirical probability (Respect Ratio) based on historical interactions with MA150:
– Dynamic touch tolerance based on ATR
– Optional shallow breaks allowed (user-defined)
– Trend filter (MA150 rising + price above)
– Minimum event count for statistical reliability
The output is a probability score (0–1) indicating how often MA150 held as support when tested.
This tool is intended for research and decision support, not as a standalone trading signal.

VOLD RatioThis indicator calculates the ratio between NYSE Up Volume and Down Volume (USI:UVOL / USI:DVOL).
It helps assess market participation and short-term buying vs. selling pressure.
Higher values indicate dominant buying volume, while lower values suggest increasing selling pressure.
Useful as a breadth and confirmation tool alongside index price action.


Session Breakout TrackerThis indicator identifies breakout opportunities when price breaks previous session ranges, tracking 4 distinct breakout chains:
Asia → London (Primary Asia breakout during London session)
London → NY (London breakout during NY session)
NY → Asia (NY breakout during next Asia session)
Asia → NY* (Fallback Asia breakout during NY if Chain 1 had no breakout)
For each breakout, it measures the maximum distance price travels before hitting your defined stop-loss, providing exact pip/point calculations.
Features :
Automatic session detection (Asia: 18:00-03:00, London: 03:00-12:00, NY: 12:00-18:00 NYT)
Complete session range tracking - high/low for each session
Session level plotting with adjustable transparency
User Inputs :
Adjustable pip multiplier (0.0001 for Forex, 0.01 for JPY pairs)
Customizable stop-loss distance in pips
Toggle labels/table/session levels independently
Adjustable session duration for optimizing strategies and back testing

EMA & Stochastic SignalsEma 200 and ema 500 + stochastic crossover. Buys when price is above emas and sells when price is below emas.

Pre-Market + Daily + Weekly REGULAR HOURS 📦 Pre-Market + Daily + Weekly RTH Range Boxes
This indicator automatically plots Pre-Market, Daily, and Weekly range boxes based strictly on US Regular Trading Hours (RTH).
What it does:
Pre-Market Box (04:00–09:30)
Captures the full pre-market high and low, then projects the range forward from the RTH open.
Daily RTH Box (09:30–16:00)
Tracks the previous day’s regular session high and low and plots the range starting at 04:00 AM the next day.
Weekly RTH Box (Mon–Fri, 09:30–16:00)
Accumulates the full weekly RTH range and plots it at 04:00 AM on Monday.

New York Sessions High/Low with Liquidity Purge CriteriaDisplays horizontal lines at the highest high and lowest low of the NY AM (09:30–12:00) and NY PM (13:30–16:00) sessions in New York time.
Lines extend forward until price strongly breaks them by a user-defined threshold (N points), at which point they cease extending - liquidity purged.
Option to show only active lines (unpurged liquidity) - toggle to hide old liquidity pools for a cleaner chart.
Customizable colors, line styles, width, lookback days and purge threshold.

Trend Stress Quant [MarkitTick]💡This indicator combines a liquidity-based stress model with a dynamic linear regression channel to identify potential market exhaustion points and assess trend quality. By merging volume impact analysis with statistical deviation, this tool aims to highlight moments where price action may be overextended relative to the underlying liquidity conditions.
● Originality and Utility
Standard volatility indicators often rely solely on price range (like Bollinger Bands). This script introduces a Stress Engine that normalizes the relationship between Price Range (True Range) and Volume. This helps distinguish between healthy price movements and liquidity-stress events (illiquidity). Furthermore, instead of using a fixed-length channel, this tool offers a Dynamic Mode that anchors the regression channel to recent pivot points, ensuring the statistical analysis aligns with the current market structure rather than an arbitrary timeframe.
● Methodology
The script operates on two distinct mathematical models:
• Illiquidity Stress Engine
The core formula calculates a raw illiquidity metric based on the log-normal distribution of the ratio between True Range and Volume. A Z-Score (standard score) is then derived from this data over a specific lookback period. High Z-Scores indicate that price is moving disproportionately fast relative to the available volume, often a signature of panic selling or euphoric buying (exhaustion).
• Linear Regression Channel
The script calculates an Ordinary Least Squares (OLS) regression line (the line of best fit) to determine the mean price trend.
Standard Deviation Bands are plotted parallel to this mean.
Pearson Correlation Coefficient (R) is calculated to quantify the strength of the linear trend. Values closer to 1 or -1 indicate a strong trend, while values near 0 indicate a chaotic or ranging market.
📑 How to Use
Traders can utilize the visual outputs for mean reversion or trend continuation context:
• Exhaustion Signals (SE / BE Labels)
SE (Seller Exhaustion): Appears when the market is in a downtrend, but the Stress Engine detects a statistical anomaly (High Z-Score) on a down candle. This suggests panic selling may be peaking.
BE (Buyer Exhaustion): Appears when the market is in an uptrend, but the Stress Engine detects high stress on an up candle, suggesting a potential blow-off top.
• Regression Channel
The dashed middle line represents the fair value (mean) of the current trend.
The outer bands represent statistical extremes. Price interacting with the outer bands (default 2 Standard Deviations) while coincident with an Exhaustion Signal provides a high-confluence area of interest.
• Metrics Dashboard
A dashboard displays the current Trend Regime, Exhaustion Status, and Channel Width (volatility percentage).
● Settings
• Exhaustion Model
Trend Filter Length: Sets the baseline EMA to determine if the market is bullish or bearish.
Stress Threshold (Sigma): The Z-Score required to trigger an exhaustion signal (default is 2.0).
• Channel Configuration
Dynamic Pivot Mode: If enabled, automatically calculates the channel length based on recent pivots. If disabled, uses the Fixed Length.
Standard Deviations: Controls the width of the inner and outer channel bands.
📖This guide explains how to interpret and utilize signals for trading:
The script is designed primarily for Mean Reversion and Exhaustion trading strategies.
● The Core Strategy: Volatility Exhaustion
The script uses a "Stress Engine" to identify when price movement is statistically overextended relative to the available liquidity (Volume).
• Setup A: The "Seller Exhaustion" (Bullish Bounce)
Look for this setup during a downtrend to catch a temporary bottom or a reversal.
Trend Condition: The dashboard shows Bearish (Price is below the trend filter).
Trigger: The label SE (Seller Exhaustion) appears below a candle.
Why? This indicates that selling pressure was intense but likely panic-driven (High Z-Score/Stress) and may be drying up.
Confluence: Ideally, this signal appears when the price is touching or piercing the Lower Channel Band (dotted or solid lines).
Action: Traders often use this as a signal to close Short positions or enter a speculative Long (counter-trend) targeting the middle line.
• Setup B: The "Buyer Exhaustion" (Bearish Pullback)
Look for this setup during an uptrend to catch a local top.
Trend Condition: The dashboard shows Bullish .
Trigger: The label BE (Buyer Exhaustion) appears above a candle.
Why? This indicates euphoric buying on low liquidity or extreme volatility that is statistically unsustainable.
Confluence: Look for price rejection at the Upper Channel Band.
Action: Traders often use this to close Long positions or enter a Short targeting the mean.
● The Filter: Trend & Correlation
The script includes a Linear Regression Channel that quantifies the quality of the trend.
• Channel Slope
If the channel is angling steeply up or down, the trend is strong.
• Pearson R (Correlation)
The script calculates the Pearson R coefficient.
Weak Correlation: If the channel turns Gray/Neutral (or the fill becomes weak), it means the correlation is below the threshold (default 0.5).
Trading Rule: Avoid trading exhaustion signals when the channel is Gray/Neutral, as the market is likely chopping sideways with no clear direction.
● Risk Management & Targets
• Stop Loss
Since this is a volatility tool, a common technique is to place stops just outside the Outer Deviation Band (the widest line). If price expands beyond the outer band with no exhaustion signal, the trend may be entering a "runaway" phase.
• Take Profit
Target 1: The Middle Regression Line (The dashed center line). Prices tend to revert to this mean after an exhaustion event.
Target 2: The opposite channel band (e.g., if you bought at the bottom, hold until the top).
● Summary of Dashboard Metrics
The table on your chart provides a quick snapshot:
Trend Regime: Tells you if you should fundamentally look for Shorts (Bearish) or Longs (Bullish).
Seller/Buyer Status: Alerts you if the current bar is EXHAUSTED or Normal .
Channel Width %: Indicates volatility. If the width is very low (percentage is small), a breakout might be imminent (squeezing). If high, be careful of chop.
⚙️ Indicator settings
• Signal Parameters
Exhaustion & Stress Model: Controls signal sensitivity.
Trend Filter: Decides if the market is Bullish or Bearish.
Stress Threshold (Sigma): Higher values (e.g., 2.5) make the script stricter, showing fewer but potentially stronger signals.
• Channel Configuration
Dynamic Pivot Mode: If ON, the channel length auto-adjusts to recent market pivots. If OFF, it uses the Fixed Length you set.
Channel Bands: Adjusts the channel width.
Outer Deviation: The boundary for "extreme" moves. Price hitting this often signals a reversal.
• Quality Filter
Filter Weak Correlations: If enabled, the channel turns gray during choppy/sideways markets to warn you not to trust trend signals.
• Visuals
Display Options: Toggles the "Stats" dashboard and adjusts volatility coloring.
● Disclaimer
All provided scripts and indicators are strictly for educational exploration and must not be interpreted as financial advice or a recommendation to execute trades. I expressly disclaim all liability for any financial losses or damages that may result, directly or indirectly, from the reliance on or application of these tools. Market participation carries inherent risk where past performance never guarantees future returns, leaving all investment decisions and due diligence solely at your own discretion.


High/Low ARDR-ADR-WDRR-DDR V1Tracks the high and Low in 4 different tIme Frames
ARDR-ADR-WDRR-DDR
-You can set your own time frames
-Display lines or boxes
-Each line can have its own label
-Set own colors and linestyles
-Each box can also have their own lines at 75%, 50% and 25% of the box if that's needed
-Toggle wich session to display
-Toggle to auto extend untill Extended time
-Toggle to live update lines/boxes during live priceaction or to display the lines / boxes after the End Time
DDR lines have no history, so after 15:55 the DDR lines disappear and gets drawn again the next day starting at 04:00.
Happy Trading!!
