עצירה והיפוך פרבולית (PSAR)

PRISMpSAR derived oscillator with its set of RSI & StochRSI and MAJestic (Momentum, Acceleration, Jerk) Oscillators Set
pSAR and MAJ oscillators can be disabled and hidden.
~ * ~ * ~ * ~ * ~ * ~ * ~ * ~ * ~ * ~ * ~ * ~ * ~ * ~ * ~ * ~ * ~ * ~ * ~ * ~ * ~
Note:
In no way is this intended as a financial/investment/trading advice. You are responsible for your own investment decisions and trades.
Please exercise your own judgement for your own trades base on your own risk-aversion level and goals as an investor or a trader. The use of OTHER indicators and analysis in conjunction (tailored to your own style of investing/trading) will help improve confidence of your analysis, for you to determine your own trade decisions.
~ * ~ * ~ * ~ * ~ * ~ * ~ * ~ * ~ * ~ * ~ * ~ * ~ * ~ * ~ * ~ * ~ * ~ * ~ * ~ * ~
Please check out my other indicators sets and series, e.g.
LIVIDITIUM (dynamic levels),
AEONDRIFT (multi-levels standard deviation bands),
FUSIONGAPS (MA based oscillators),
MAJESTIC (Momentum/Acceleration/Jerk Oscillators),
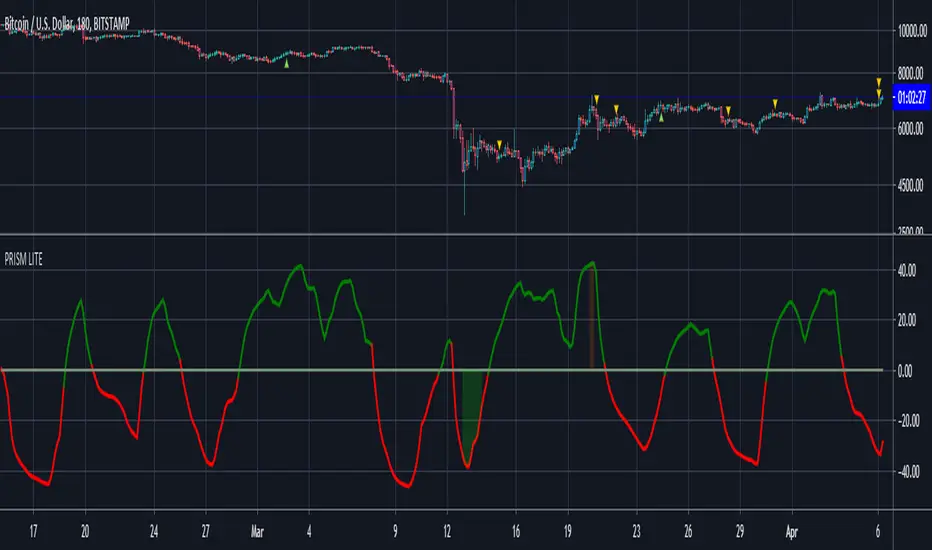
PRISM (pSAR based oscillator, with RSI/StochRSI as well as Momentum/Acceleration/Jerk indicators),
PDF (parabolic SAR /w HighLow Trends Indicator/Bar-color-marking + Dynamic Fib Retrace and Extension Level)
and more to come.
Constructive feedback and suggestions are welcome.
If you like any of my set of indicators, and it has benefited you in some ways, please consider tipping a little to my HRT fund. =D
cybernetwork @ EOS
37DzRVwodp5UZBYjCKvVoZ5bDdDqhr7798 @ BTC
MPr8Zhmpsx2uh3F5R4WD98MRJJpwuLBhA3 @ LTC
1Je6c1vvSCW7V2vA6RYDt6CEvqGYgT44F4 @ BCH
AS259bXGthuj4VZ1QPzD39W3ut4fQV5giC @ NEO
rDonew8fRDkZFv7dZYe5w3L1vJSE51zFAx @ Ripple XRP
0xc0161d27201914FC0bAe5e350a193c8658fc4742 @ ETH
GAX6UDAJ52OGZW4FVVG3WLGIOJLGG2C7CTO5ZDUK2P6M6QMYBJMSJTDL @ Stellar XLM
xrb_16s8cj8eoangfa96shsnkir3wctdzy76ajui4zexek6xmqssweu85rdjxrt4 @ Nano
~ JuniAiko
(=^~^=)v~
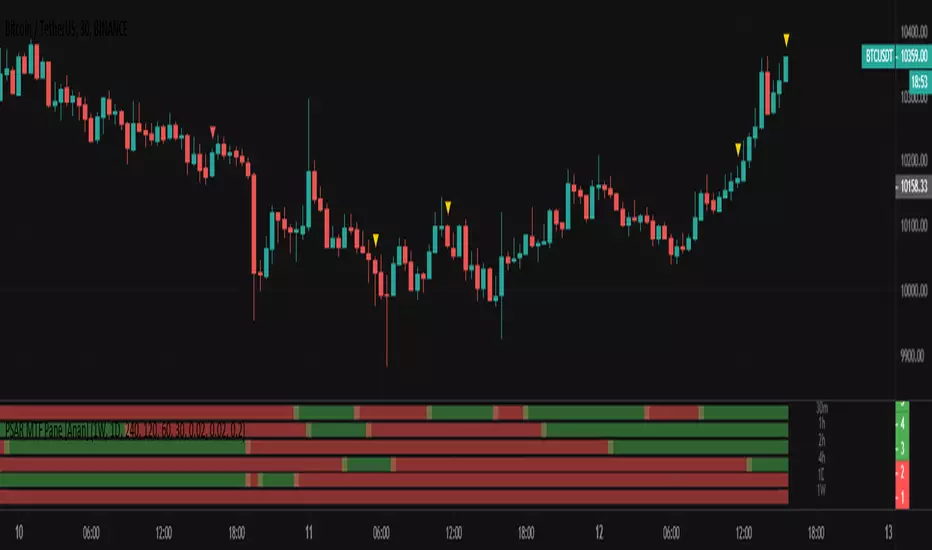
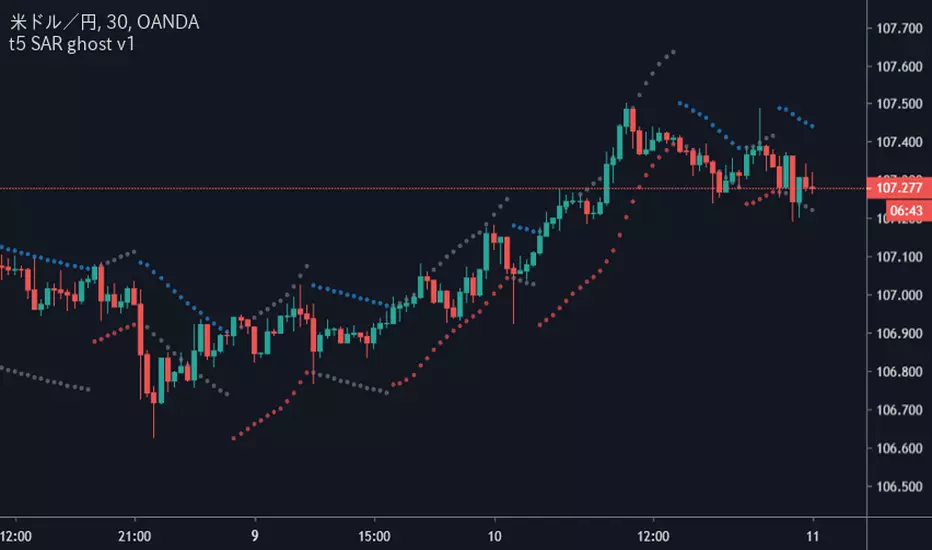
PSAR MTF Pane [Anan]Hello Friends,
My lovely pane now for built-in Parabolic SAR
Green : Bullish Parabolic SAR
Red : Bearish Parabolic SAR
No Green/No Red : The turning point
PDF {pSAR /w HiLo Trends + Fib Retrace/Extension Levels}parabolic SAR /w HighLow Trends Indicator/Bar-color-marking + Dynamic Fib Retrace and Extension Level
~ * ~ * ~ * ~ * ~ * ~ * ~ * ~ * ~ * ~ * ~ * ~ * ~ * ~ * ~ * ~ * ~ * ~ * ~ * ~ * ~
Note:
In no way is this intended as a financial/investment/trading advice. You are responsible for your own investment decisions and trades.
Please exercise your own judgement for your own trades base on your own risk-aversion level and goals as an investor or a trader. The use of OTHER indicators and analysis in conjunction (tailored to your own style of investing/trading) will help improve confidence of your analysis, for you to determine your own trade decisions.
~ * ~ * ~ * ~ * ~ * ~ * ~ * ~ * ~ * ~ * ~ * ~ * ~ * ~ * ~ * ~ * ~ * ~ * ~ * ~ * ~
Please check out my other indicators sets and series, e.g.
LIVIDITIUM (dynamic levels),
AEONDRIFT (standard deviation bands),
FUSIONGAPS (MA based oscillators),
MAJESTIC (Momentum/Acceleration/Jerk Oscillators),
PRISM (pSAR based oscillator, with RSI/StochRSI as well as Momentum/Acceleration/Jerk indicators),
and more to come.
Constructive feedback and suggestions are welcome.
~ JuniAiko
(=^~^=)v~

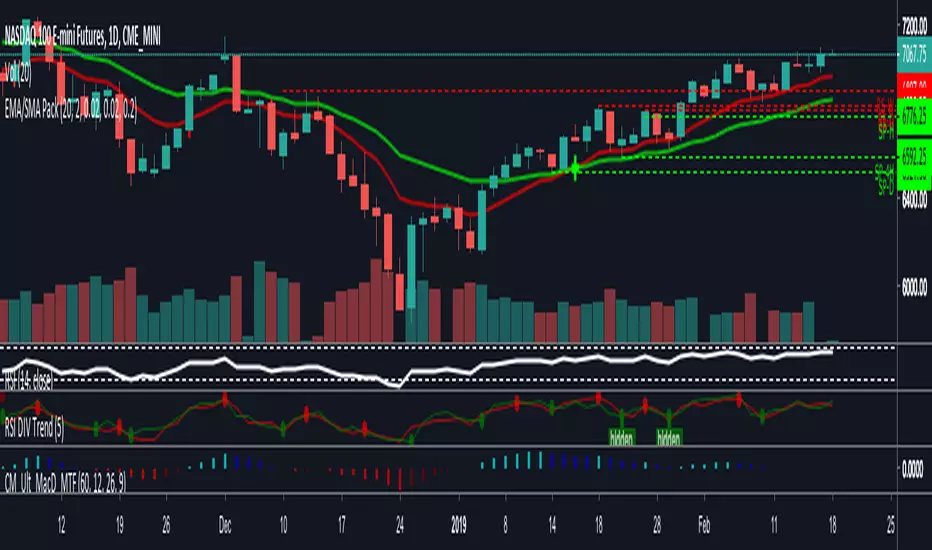
Selective Script Set by 2tmI'd mixed several Scripts for Free Accounting Users.
The includes are these.
- 7 MAs
- 3 Bollinger Bands
- 3 Parabolic SARs
- Ichimoku Cloud
- Pivot Points
- HTF Candles
-------------------------------------------------------------
6가지 지표를 묶은 종합세트입니다.
7개의 MA, 3개의 BB, 3개의 Par SAR, 일목균형, 피봇포인트, 그리고 제가 쓰는 하이어타임 프레임 캔들입니다.
MA는 EMA, SMA, WMA, VWMA 중에서 선택가능합니다.
BB는 볼린저 밴드의 창시자 볼린저가 직접 제시한 셋업대로 설정했습니다.
Par SAR는 민감도를 기준으로 세개의 BB를 설정했는데, 개인적으론 두번째 Par SAR를 선호합니다.
일목균형은 기본세팅 그대로이며 앞으로 업데이트를 해 셋업을 바꿀수도 있습니다.
피봇포인트는 트레디셔널, 우디, 피보나치, 카마릴라 네가지만 반영했고, 개인적인 선호는 피보나치입니다.
하이어타임프레임 캔들은 캔들 생성과정을 이해하면 유용합니다.

Triple Parabolic SAR with Trend by 2tmThis script bundles three Parabolic SARs.
I set sensitivity to three types.
I use each as a short-term, mid-term, and long-term.
If you have your own setup, you can use it in the options.

Lucid SARI wrote this script after having listened to Hyperwave with Sawcruhteez and Tyler Jenks of Lucid Investments Strategies LLC on July 3, 2019. They felt that the existing built-in Parabolic SAR indicator was not doing its calculations properly, and they hoped that someone might help them correct this. So I tried my hand at it, learning Pine Script as I went. I worked on it through the early morning hours and finished it by 4 am on July 4, 2019. I've added a few bits of code since, adding the rule regarding the SAR not advancing beyond the high (low) of the prior two candles during an uptrend (downtrend), but the core script is as it was.
This code is open source under the MIT license. If you have any improvements or corrections to suggest, please send me a pull request via the github repository github.com
For more details on the initial script, see
Sawcruhteez from Lucid Investment Strategies wrote the following description of the Parabolic SAR, where the quotes are from Section II of J. Welles Wilder, Jr.'s book New Concepts in Technical Trading Systems (1978)
--------------------------------------------------------------------------------------------------------------------------
Parabolic SAR
"The Parabolic Time / Price System derives its name from the fact that when charted, the
pattern formed by the stops resembles a parabola, or if you will, a French Curve. The system
allows room for the market to react for the first few days after a trade is initiated and then the
stop begins to move up more rapidly. The stop is not only a function of price but also a function
of time .
"The stop never backs up. It moves an incremental amount each day, only in the direction which
the trade has been initiated."
"The stop is also a function of price because the distance the stop moves up is relative to the
favorable distance the price has moved... specifically, the most favorable price reached since the
trade was initiated."
A. The calculation for a bullish Parabolic SAR is:
Tomorrow’s SAR = Today’s SAR + AF(EP - Today’s SAR)
"Acceleration Factor (AF) is one of a progression of numbers beginning at 0.02 and ending at
0.20. The AF is increased by 0.02 each period that a new high is made" (if long) or new low is
made (if short).
EP is the "Extreme Price Point for the trade made so far. If Long , EP is the extreme high price for
the trade; if Short , EP is the extreme low price for the trade.”
Most websites will provide the above calculation for the Parabolic SAR but almost all of them
leave out this crucial detail:
B. "Never move the SAR into the previous day’s range or today’s range
"1. If Long , never move the SAR for tomorrow above the previous day’s low or
today’s low . If the SAR is calculated to be above the previous day’s low or
today’s low, then use the lower low between today and the previous day as
the new SAR. Make the next days calculations based upon this SAR.
"2. If Short , never move the SAR for tomorrow below the previous day’s high or
today’s high . If the SAR is calculated to be below the previous days’ high or
today’s high, then use the higher high between today and the previous day
as the new SAR. Make the next days calculations based upon this SAR."
When a Bullish SAR is broken then it gets placed at the SIP (significant point) of the prior trend.
In otherwords it is placed above the current candle and at the price that was the SIP.
The inverse is true for the first Bullish SAR.
"This system is a true reversal system; that is, every stop point is also a reverse point." If breaking
through a bearish SAR (one above price) that simultaneously signals to close a short and go
long.

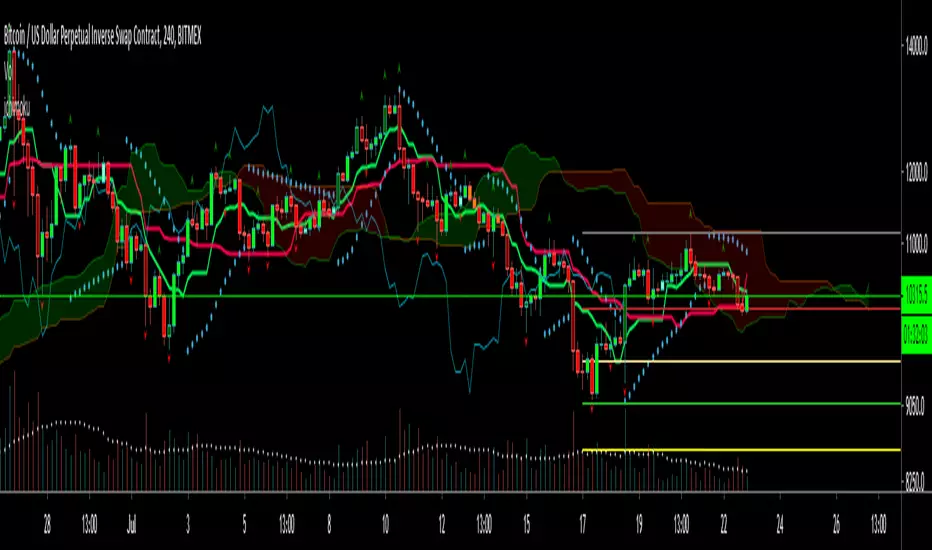
Parabolic SAR [Jwammo12]This is a different (dare I say, corrected?) version of the Parabolic SAR that doesn't use the current active close in its calculation. This changes the current SAR to only change when the extrema (high or low) changes.
the chart shows the difference between the built in SAR and the one I have modified.

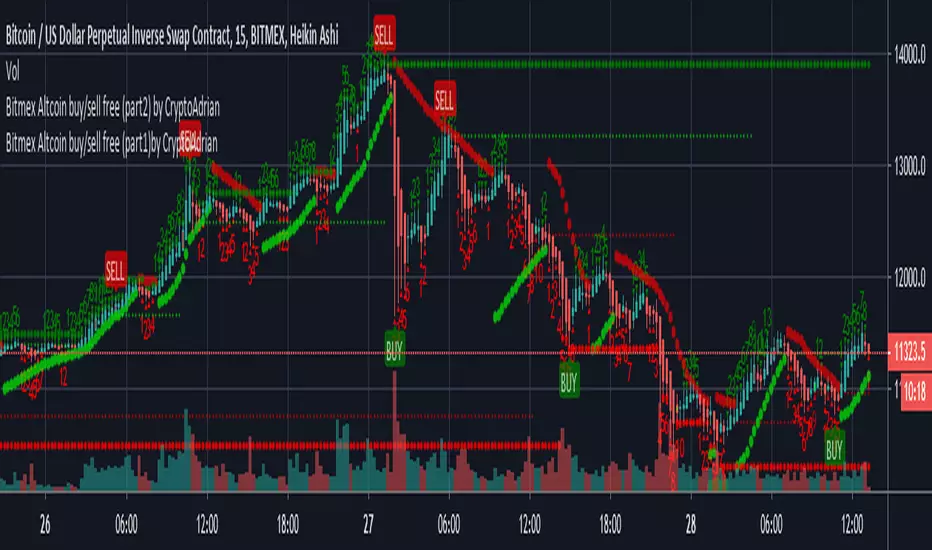
Bitmex Altcoin buy/sell free (part1) by CryptoAdrianThis script has two parts Bitmex Altcoin buy/sell free (part1) by CryptoAdrian and Bitmex Altcoin buy/sell free (part2) by CryptoAdrian
Combination of two will give you better results with clarification.
(soon will be published as one script)
For better results observe it for some time. If you didn't get how to use it PM me I will brief you :)
Hope you will like this. For any detail or doubts you can PM me on TV. I will try to reach you out ASAP .
Part 1
Part 2
Part 1 + Part 2
Please add this script to your fav so incase you find it difficult to find it can be seen in your fav and you will get it.
Thank You and happy trading :)
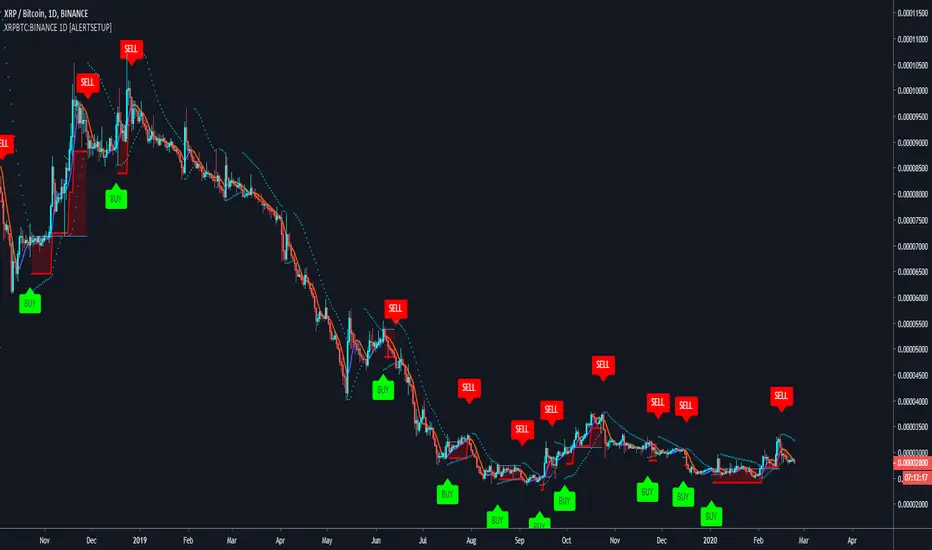
Buy & Sell XRPBTC:BINANCE 1D Trading BotWith this indicator you can create Buy and Sell alerts to automate your trading.
Optimised for BINANCE:XRPBTC in a 1D timeframe.
> > > READ HOW IT WORKS < < <
The goal of trading XRP against BTC is to increase your amount of BTC. XRP is in the top 5 Coins of all time.
Built upon my generic indicator Cyatophilum Altcoins Trader , this Strategy creates buy and sell signals to can be used for manual or automated trading.
This strategy using a combination of Parabolic SAR and Tilson T3 Line , which is a strong tool to buy at the right time . An integrated 10% trailing stop loss will reduce the risk!
Sell and save your founds instead of simply holding over time.
Results below are calculated using 100% equity from a 10 000$ capital and a 0.05% commission fee on each trade.
> > > READ HOW TO USE < < <
> Get access to the Cyatophilum Indicators <
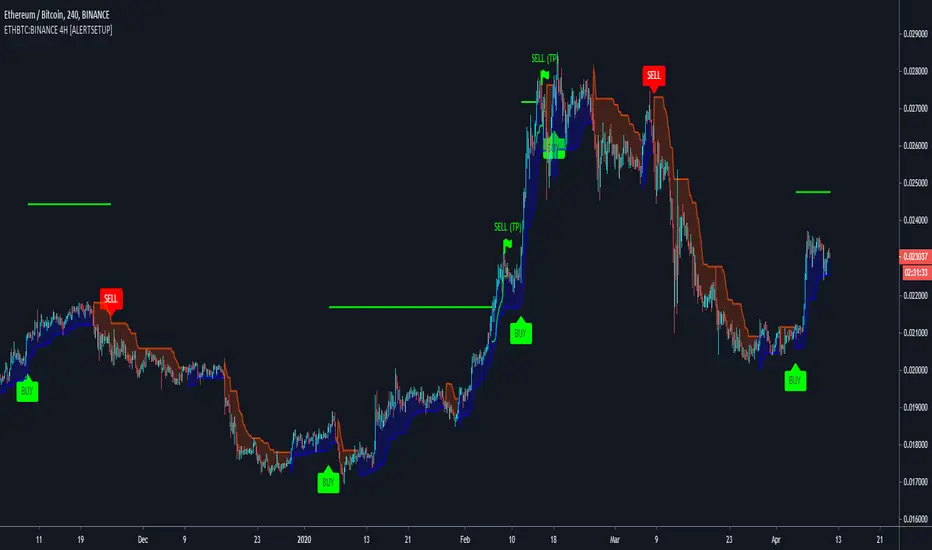
Buy & Sell - ETHBTC:BINANCE 4H Trading BotWith this indicator you can create Buy and Sell alerts to automate your trading.
Optimised for BINANCE:ETHBTC in a 4H timeframe.
> > > READ HOW IT WORKS < < <
The goal of trading ETH against BTC is to increase your amount of BTC. ETH is in the top 5 Coins of all time and its bull rallies are really fast and volatile so it's very important not to miss them!
Built upon my generic indicator Cyatophilum Altcoins Trader , this Strategy creates buy and sell signals to can be used for manual or automated trading.
The year 2019 started with the end of a bull run, and the script was able to catch 29% of profits. Then in Februrary, we saw another rally, but this one dropped fast and the script caught 4% of profits. Until then, two opportunities of trade triggered but ended up as a loss, as the bear market continued. In total, it made 33% of profit and 9.5% of loss . The fact that a bear market has be going on for +3 months is a good thing for what will happen next.
I think we all remember how 2018 was for ETH. It had the most insane rally of all time, another one in April-May then 6 months of bear market. Oh! by the way, did I say the script has an integrated trailing stop loss starting at 4%? Those are the green dots below the price.
I used TradingView's Strategy Tester with historical data starting from 2017-08. Results are calculted using 100% equity from a 10 000$ capital and a 0.05% commission fee on each trade.
See the results below.
> > > READ HOW TO USE < < <
> Get access to the Cyatophilum Indicators <
Buy & Sell - TRXBTC:BINANCE 4H Automated StrategyWith this indicator you can create Buy and Sell alerts to automate your trading.
Optimised for BINANCE:TRXBTC in a 4H timeframe.
> > > READ HOW IT WORKS < < <
> > > HOW TO USE < < <
> Get access to the Cyatophilum Indicators <

Cyatophilum Altcoins Trader [ALERTSETUP]A generic Indicator built on Parabolic Stop And Reverse
Optimised for trading altcoins. Up to 8 automated alerts.
> > > READ HOW TO USE < < <
Get access to the Cyatophilum Indicators !

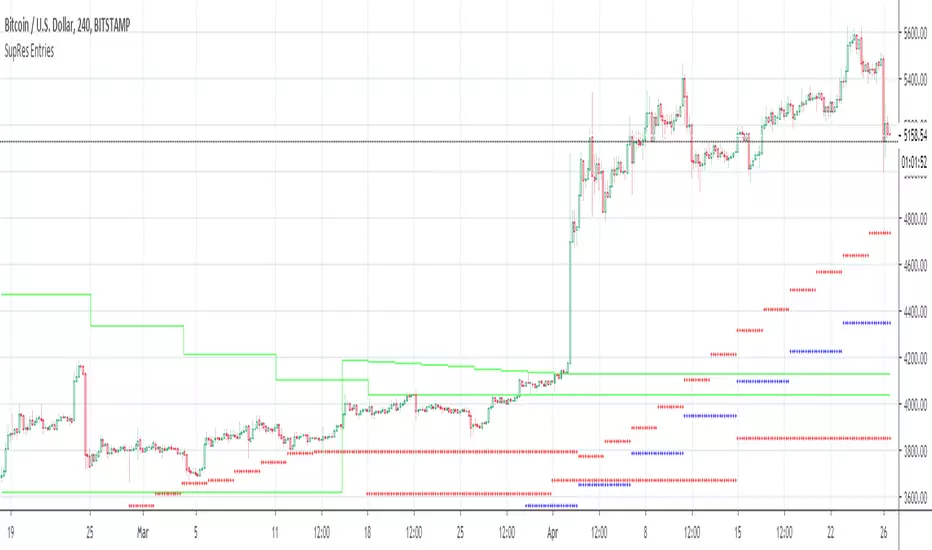
SupRes EntriesFinal component of our private modular strategy, including multiple entry TFs, fixed SL with dedicated TF, progressive SL (TSL) with dedicated TF, and BE criteria with dedicated TF.
V19: Release
PSAR Support FilterSimilar to our private High/Low Support Filter, replacing highs/lows with SAR values.
V10: Release

Multiple Timeframe Parabolic SARCombines the parabolic SAR (Stop And Reverse) strategy over multiple time scales for the given ticker; showing each as a unique color. The time scales are also averaged together.

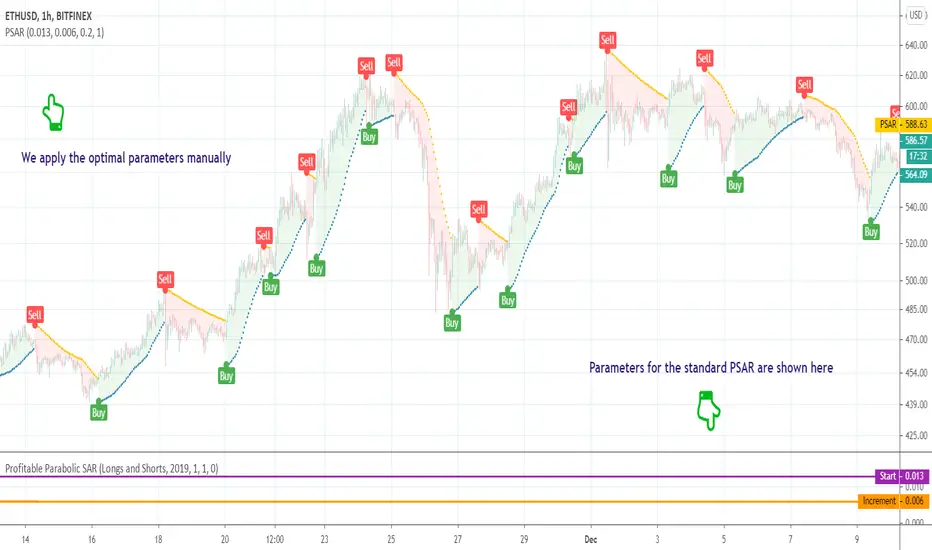
Profitable Parabolic SARHello friends,
This script is a powerful, non-repainting optimizer for the classic Parabolic Stop and Reverse (PSAR) — one of J. Welles Wilder's most respected trend-following systems. It automatically finds and applies the most profitable PSAR settings for each instrument and timeframe, eliminating the need for manual parameter tuning.
🛠 How It Works
The indicator evaluates over 500 combinations of PSAR parameters using a decision tree–based algorithm under the hood .
Each configuration is backtested across the instrument's full price history, and when a more profitable setup is identified, the indicator seamlessly switches to those values in real time — while maintaining the original PSAR logic.
The Maximum parameter remains fixed since its impact on overall profitability is minimal compared to Start and Increment.
This self-adjusting approach removes the guesswork of parameter optimization and keeps the PSAR dynamically tuned to changing market regimes.
💡 Integrated Versions Explained
This all-in-one tool merges 3 complementary indicators:
• Profitable PSAR — A parameter optimizer that runs in a separate window below your main chart. It doesn't generate buy/sell signals directly but analyzes your specific asset and timeframe to find optimal settings. These are displayed as two lines (purple and orange), with optional labels showing the actual parameter values. Once identified, you can apply these optimal values manually to the standard PSAR.
• Self-Adjusting PSAR — A real-time overlay version that looks and behaves like the standard PSAR but automatically adjusts its parameters on the fly. It requires no manual configuration and can be paired with the Profitable PSAR to monitor which settings are currently active.
• Compact Self-Adjusting PSAR — A minimalist oscillator version that reflects the same adaptive logic through simple binary outputs: -1 for Sell and 1 for Buy. This variant is ideal for filtering or signal integration into other systems.
Together, they form a unified adaptive system that gives users both automation and interpretability — the best of both worlds.
🔥 Key Features
Adaptive optimization powered by a decision tree–based algorithm
Real-time switching to more profitable parameter configurations
Direction filter (Longs | Shorts | Longs & Shorts)
Optional analysis start date for focused historical testing
Commission customization for realistic performance modeling
Visual highlighting of parameter changes
Optional buy/sell labels and compact trend signal display
If you'd like access or have any questions, feel free to reach out to me directly via DM.
👋 Good luck and happy trading!
סקריפט בתשלום
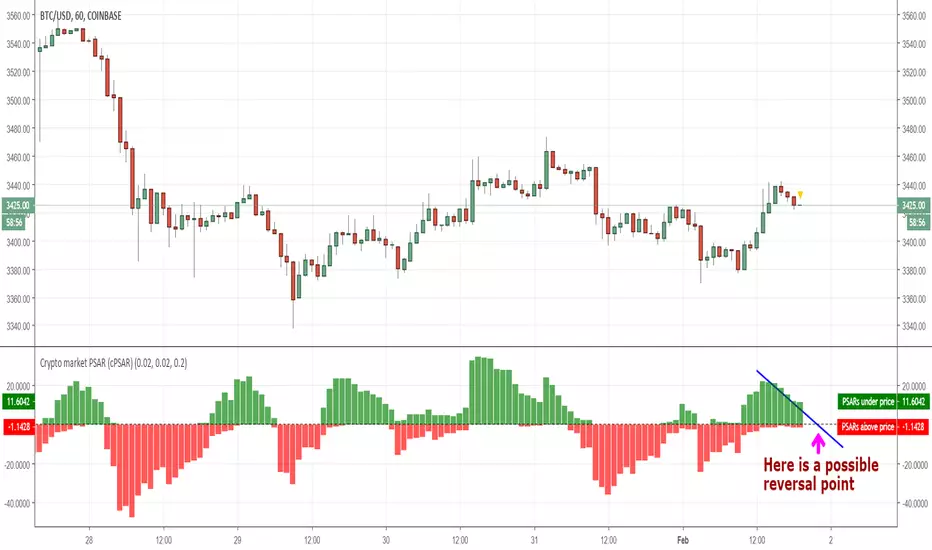
Crypto market PSAR (cPSAR)This indicator calculates the PSARs of the most liquid cryptocurrencies (as percent differences from the prices) and sums them together.
The PSARs under the closes, which act as support, are summed separately and shown in green. The PSARs over the closes (acting as resistance) are summed separately and shown in red.
The result is an indicator which can be interpreted somewhat like the RSI (but keep in mind that PSAR is a lagging indicator unlike the RSI which is a leading indicator). By interpreting this correctly you can - SOMETIMES - predict the short-term turns of the entire crypto market.
Many traders use the prices shown by PSAR (Parabolic Stop And Reverse) to set stop loss prices and/or to take profit and reverse their positions. This is why, on reversal of the PSARs (= when one of the red or green values becomes visibly larger than the other), a strong turning of the market can, sometimes, occur.