ATR Distance from 50 SMA By DanBobDanA simple indicator that measures the distance between current price and the 50 SMA
The average momentum swing trade might run 7 times the ATR before pulling back
Therefore, its recommended to not buy a stock that is beyond 4 times its ATR to the 50 SMA
This script will quickly and easily calculate the 50 SMA to ATR distance for you
שירותי Pine

EAB: WatermarkEAB: Watermark displays a fully customizable watermark and symbol information panel directly on the chart using table objects.
The indicator allows you to add custom text (watermark), symbol details, timeframe and date, with flexible control over position, size, colors and borders. Each element can be enabled or disabled independently, ensuring a clean and distraction-free chart layout.
Features
• Custom watermark text displayed anywhere on the chart.
• Optional symbol information panel with text, ticker, timeframe and date.
• Independent controls for visibility, position, text size, colors and borders.
• Dynamic table sizing to avoid empty space when elements are disabled.
• Designed for a clean, professional chart appearance.
Notes
• This is a visual and informational tool only.
• No trading signals or alerts are generated.
mucip sat stratejisiThis strategy performs scaled short entries across multiple timeframes.
Position additions are executed using small capital allocations (1–2% per entry) to manage risk efficiently.
It is primarily optimized for major cryptocurrencies.
The strategy is designed for futures markets and operates with leverage in the 10–15x range.

pD Zones [MMT]pD Zones plots a clean set of intraday high‑of‑day (HOD) and low‑of‑day (LOD) zones that automatically extend forward, flip color on mitigation, and archive as historical levels for context. It is designed to give intraday traders a simple visual map of premium/discount zones derived from a chosen calculation timeframe.
Overview
Objective : Highlight the current day’s HOD/LOD wick zones as actionable intraday support and resistance.
Core logic runs on a user‑selectable source timeframe (default 15m), then projects those zones onto any chart you are trading.
Zones extend into the future, react to price via mitigation logic, and then optionally roll into a dimmed historical layer.
Zone logic
Each session, the script tracks the extreme high and low plus their wick limits (open/close‑based) on the source timeframe to form two intraday zones.
When a new day starts, the finalized prior‑day zones are “locked in” and the current day begins tracking a fresh HOD/LOD pair.
Only one HOD and one LOD zone are created per day, reducing clutter and keeping focus on the most relevant levels.
Mitigation & color flips
Active HOD zones behave as resistance: a decisive break above the top of the box flips it to a bullish (supportive) color profile, while a move back below can re‑flip it.
Active LOD zones behave as support: a break below the bottom of the box flips it to a bearish profile, and a sustained reclaim can re‑flip it as well.
Once mitigated and carried into a new day, zones are restyled with a softer historical color so they remain visible but unobtrusive.
Alerts
When price breaks a HOD zone to the upside, the script can trigger an alert message noting that HOD resistance has been broken and showing the exact level.
When price breaks a LOD zone to the downside, an alert notes that LOD support has been broken, again with the precise price printed.
These alerts are meant for intraday confirmation of structure shifts at key daily extremes, rather than frequent scalper signals.
Inputs & customization
- Calculation Timeframe: choose which timeframe defines the daily HOD/LOD zones (e.g., 5m, 15m, 1h), independent from the chart.
- Visual Settings: customize support/resistance fill colors and border color to integrate with existing layouts.
- Logic Settings:
Max Active Zones: cap how many live zones remain on the chart at once to control noise.
Max Historical Zones: keep only the most recent historical levels or show all past days.
Zone Extension Offset (Bars): control how aggressively boxes project into the future.
- Mitigation Settings: choose the historical zone color to distinguish active levels from archived ones at a glance.

sullaojo 3mHere is the English translation for the alert setup instructions:
**How to Set Up Alerts (After Adding the Code)**
1. Click the **Add to chart** button to apply the indicator to your graph.
2. Click the **Alarm Clock icon (Alerts)** on the top right toolbar of TradingView, or press `Alt + A`.
3. In the **Condition** field:
* Select the indicator named **"MA Crossover Buy Alert..."**
* Select **"แจ้งเตือนซื้อ (Buy Alert)"** to receive only buy signals.
4. In the **Trigger** (or Options) section: Select **Once per bar close**.
*(This is recommended per the textbook to confirm that the closing price actually crossed the line, avoiding false signals during intraday volatility.)*
5. Check **Notify on App** (for mobile) or **Show pop-up** as desired, then click **Create**.
Now, when the moving averages cross according to the textbook's conditions, the system will send you an alert immediately!

Flux Portfolio Visualizer | GL0WDASHFlux Portfolio Visualizer | GL0WDASH
Flux Portfolio Visualizer lets you simulate and track the performance of a multi-asset portfolio directly on the chart.
Choose up to 10 assets, assign custom allocation weights, and set a start date to generate a real-time equity curve based on historical price data.
The script performs one-time proportional allocation at the start date and then tracks equity forward without rebalancing, giving you a realistic view of how your portfolio would have evolved over time. It also includes a maximum equity drawdown tracker and an optional level line for reference.
Features:
• Allocate to up to 10 assets with custom weight percentages
• Specify initial capital and simulation start date
• Real-time equity curve based on confirmed bars
• Maximum equity drawdown tracking + table display
• Optional horizontal reference line
• Designed for long-horizon allocation experiments
Great for:
• Passive portfolio stress-testing
• Comparing allocation strategies
• Evaluating long-term crypto/asset mixes
• Visualizing risk via max drawdowns
This tool does not execute trades or rebalance—its purpose is pure visualization, giving traders clarity about how portfolios behave under different allocation assumptions.
If you expand or modify the indicator, please credit the original author.

Asia/London/NY Session Slope LinesTITLE: Asia/London/NY Session Slope Lines
Track momentum across all three major trading sessions with automated slope lines showing pips per bar movement.
📊 VISUALIZE SESSION MOMENTUM AT A GLANCE
This powerful indicator automatically draws slope lines for all three major forex trading sessions (Asia, London, and New York), giving you instant insight into directional bias and momentum for each session.
✨ KEY FEATURES:
• Three Session Coverage - Asia, London, and New York sessions tracked simultaneously
• Pips Per Bar Calculation - See exact momentum as "pips moved per bar" for easy comparison
• Customizable Styling - Different colors, line styles, and widths for each session
• Auto-Detection - Automatically identifies session boundaries and draws lines
• Clean Labels - Each session displays its slope value directly on the chart
• Session Markers - Optional triangles show exact start/end of each session
📈 HOW IT WORKS:
The indicator calculates the slope by measuring:
1. Price movement during the entire session (in pips)
2. Number of bars in that session
3. Result: Pips per bar (momentum strength)
Example: If Asia session moved +30 pips over 60 bars = +0.50 pips/bar slope
🎨 VISUAL CLARITY:
• Asia Session: Solid lines (Green/Red by default)
• London Session: Dashed lines (Blue/Orange by default)
• New York Session: Dotted lines (Lime/Fuchsia by default)
• Positive slopes = Bullish momentum
• Negative slopes = Bearish momentum
🔧 FULLY CUSTOMIZABLE:
• Adjust session times for any timezone
• Change colors for positive/negative slopes per session
• Toggle session boundary markers on/off
• Modify line width and style independently
💡 PERFECT FOR:
✓ Session traders who focus on specific market hours
✓ Identifying which session has the strongest momentum
✓ Spotting trend continuation or reversal between sessions
✓ Comparing volatility across different trading sessions
✓ Finding the best session for your trading strategy
⚙️ WORKS WITH:
• All forex pairs (EUR/USD, GBP/USD, USD/JPY, etc.)
• Any timeframe (works best on 5m-1H charts)
• Automatically adjusts pip calculation for JPY pairs
🚀 QUICK SETUP:
1. Add indicator to chart
2. Customize session times if needed (Settings → Input tab)
3. Adjust colors and styles (Settings → Style tab)
4. Start trading with clear session momentum insight!
No complex configuration needed - works perfectly with default settings!
🚀 QUICK START GUIDE - Asia/London/NY Session Slope Lines
──────────────────────────────────────────────────────────────
STEP 1: ADD TO CHART
──────────────────────────────────────────────────────────────
1. Open TradingView
2. Select any forex pair (e.g., EUR/USD)
3. Click "Indicators" at top of chart
4. Search: "Asia/London/NY Session Slope Lines"
5. Click to add to chart
──────────────────────────────────────────────────────────────
STEP 2: UNDERSTAND WHAT YOU SEE
──────────────────────────────────────────────────────────────
You'll see THREE different slope lines per day:
📍 ASIA SESSION (Solid Line)
• Default: 00:00 - 09:00 (Exchange time)
• Green = Bullish | Red = Bearish
• Label shows: "Asia +0.85 pips/bar"
📍 LONDON SESSION (Dashed Line)
• Default: 03:00 - 12:00 (Exchange time)
• Blue = Bullish | Orange = Bearish
• Label shows: "London -1.23 pips/bar"
📍 NEW YORK SESSION (Dotted Line)
• Default: 09:30 - 16:00 (Exchange time)
• Lime = Bullish | Fuchsia = Bearish
• Label shows: "NY +2.14 pips/bar"
──────────────────────────────────────────────────────────────
STEP 3: HOW TO READ THE SLOPES
──────────────────────────────────────────────────────────────
The number tells you MOMENTUM STRENGTH:
+0.10 to +0.50 pips/bar = Weak uptrend
+0.50 to +1.50 pips/bar = Moderate uptrend
+1.50+ pips/bar = Strong uptrend
-0.10 to -0.50 pips/bar = Weak downtrend
-0.50 to -1.50 pips/bar = Moderate downtrend
-1.50+ pips/bar = Strong downtrend
──────────────────────────────────────────────────────────────
STEP 4: TRADING STRATEGIES
──────────────────────────────────────────────────────────────
✅ CONTINUATION PLAY:
If Asia = +1.2 pips/bar AND London = +0.8 pips/bar
→ Look for LONG entries during NY session
✅ REVERSAL PLAY:
If Asia = +2.5 pips/bar (strong) AND London = -0.3 pips/bar
→ Momentum shifted, watch for reversal
✅ STRONGEST SESSION:
Compare all three slopes - trade during the session with highest absolute value
NY = +3.2 pips/bar > London = +1.1 > Asia = +0.4
→ NY session has strongest momentum
──────────────────────────────────────────────────────────────
STEP 5: CUSTOMIZE (OPTIONAL)
──────────────────────────────────────────────────────────────
Click the gear icon ⚙️ next to indicator name:
🕐 ADJUST SESSION TIMES:
Settings → Asia Session → Change hours
(Use YOUR timezone or exchange timezone)
🎨 CHANGE COLORS:
Settings → Asia/London/NY Style → Pick colors
👁️ HIDE MARKERS:
Settings → Display Options → Uncheck "Show Session Markers"
──────────────────────────────────────────────────────────────
STEP 6: BEST PRACTICES
──────────────────────────────────────────────────────────────
📊 Use on 5-minute to 1-hour charts
(Too high timeframe = not enough bars per session)
💱 Works best on major forex pairs
(EUR/USD, GBP/USD, USD/JPY, etc.)
🕐 Verify session times match your trading timezone
(Default is exchange timezone)
📈 Combine with support/resistance levels
(Strong slope + key level = high probability setup)

NQ Lunch High Low First Sweep StrategyThis script identifies the FIRST liquidity sweep of the Lunch session high or low
after the Lunch session has ended, based on ICT / Killzone concepts.
Logic summary:
• Tracks Lunch session High and Low (New York time)
• After Lunch session closes, monitors the market on 5-minute timeframe
• Triggers ONLY on the first sweep:
– Price wicks beyond Lunch High and closes back below → SHORT signal
– Price wicks beyond Lunch Low and closes back above → LONG signal
• Generates an alert at the exact bar where entry is expected
• Designed specifically for Nasdaq (NQ) futures
• One trade per day – no overtrading
Notes:
• Intended for 5-minute charts only
• Uses New York session timing
• This script does NOT manage exits (TP/SL) – entry logic only
• Best used as a confluence tool, not a standalone system
Educational & discretionary use only.

Moon Phases & Declinations - Chronos Capital [BETA]High-Precision Lunar Cycles: Moon Phases & Declinations (Swiss Ephemeris)
Overview
This indicator provides institutional-grade astronomical data directly on your chart. Unlike standard scripts that use basic sine-wave approximations, this tool implements the **Swiss Ephemeris algorithm**, the gold standard for high-precision celestial calculations.
By tracking the Moon’s phases and its **Maximum/Minimum Declinations**, traders can identify potential "turning points" or "energy shifts" in market volatility often associated with lunar cycles.
---
Key Features
Ultra-High Precision: Calculations are accurate to within *seconds* of time, ensuring that the visual plot aligns perfectly with astronomical reality.
Moon Phase Tracking: Distinct markers for New Moon, Full Moon, and Quarters.
Lunar Declination Peaks: Automatically identifies when the moon reaches its *Maximum North* and *Maximum South* points (Lunar Extremes).
Customizable Visuals: Toggle between background highlights, vertical lines, or plot signals to suit your trading style.
---
Technical Accuracy
This script is built using a ported version of the Swiss Ephemeris
Positional Accuracy: Within 0.1 arcseconds.
Time Accuracy: Within **~1-2 seconds** of official JPL data.
Algorithm: Integration of the *ELP2000-85* lunar theory for maximum reliability over decades of historical data.
---
### **How to Use**
1. **Reversal Zones:** Watch for the Moon’s *Max/Min Declination* points, which often coincide with local tops or bottoms in trending markets.
2. **Volatility Shifts:** Use the *New Moon* and *Full Moon* markers to anticipate periods of increased or decreased market liquidity and volume.
3. **Confluence:** Best used in combination with your existing price action or momentum indicators to add a "time-based" filter to your entries.
*Disclaimer: This tool is for educational and analytical purposes only. Lunar cycles are a study of time-based correlation, not a guaranteed financial signal.*

SU Trend Filter Box-15min-SOLSU Trend Filter Box-15min-SOL,Within this strategy, you can configure various box range criteria, freely combine them, select the number of filters to activate, and it supports 12 different box filtering methods.

Adaptive Z-Score Oscillator [QuantAlgo]🟢 Overview
The Adaptive Z-Score Oscillator transforms price action into statistical significance measurements by calculating how many standard deviations the current price deviates from its moving average baseline, then dynamically adjusting threshold levels based on historical distribution patterns. Unlike traditional oscillators that rely on fixed overbought/oversold levels, this indicator employs percentile-based adaptive thresholds that automatically calibrate to changing market volatility regimes and statistical characteristics. By offering both adaptive and fixed threshold modes alongside multiple moving average types and customizable smoothing, the indicator provides traders and investors with a robust framework for identifying extreme price deviations, mean reversion opportunities, and underlying trend conditions through the visualization of price behavior within a statistical distribution context.
🟢 How It Works
The indicator begins by establishing a dynamic baseline using a user-selected moving average type applied to closing prices over the specified length period, then calculates the standard deviation to measure price dispersion:
basis = ma(close, length, maType)
stdev = ta.stdev(close, length)
The core Z-Score calculation quantifies how many standard deviations the current price sits above or below the moving average basis, creating a normalized oscillator that facilitates cross-asset and cross-timeframe comparisons:
zScore = stdev != 0 ? (close - basis) / stdev : 0
smoothedZ = ma(zScore, smooth, maType)
The adaptive threshold mechanism employs percentile calculations over a historical lookback period to determine statistically significant extreme zones. Rather than using fixed levels like ±2.0, the indicator identifies where a specified percentage of historical Z-Score readings have fallen, automatically adjusting to market regime changes:
upperThreshold = adaptive ? ta.percentile_linear_interpolation(smoothedZ, percentilePeriod, upperPercentile) : fixedUpper
lowerThreshold = adaptive ? ta.percentile_linear_interpolation(smoothedZ, percentilePeriod, lowerPercentile) : fixedLower
The visualization architecture creates a four-tier coloring system that distinguishes between extreme conditions (beyond the adaptive thresholds) and moderate conditions (between the midpoint and threshold levels), providing visual gradation of statistical significance through opacity variations and immediate recognition of distribution extremes.
🟢 How to Use This Indicator
▶ Overbought and Oversold Identification:
The indicator identifies potential overbought conditions when the smoothed Z-Score crosses above the upper threshold, indicating that price has deviated to a statistically extreme level above its mean. Conversely, oversold conditions emerge when the Z-Score crosses below the lower threshold, signaling statistically significant downward deviation. In adaptive mode (default), these thresholds automatically adjust to the asset's historical behavior, i.e., during high volatility periods, the thresholds expand to accommodate wider price swings, while during low volatility regimes, they contract to capture smaller deviations as significant. This dynamic calibration reduce false signals that plague fixed-level oscillators when market character shifts between volatile and ranging conditions.
▶ Mean Reversion Trading Applications:
The Z-Score framework excels at identifying mean reversion opportunities by highlighting when price has stretched too far from its statistical equilibrium. When the oscillator reaches extreme bearish levels (below the lower threshold with deep red coloring), it suggests price has become statistically oversold and may snap back toward the mean, presenting potential long entry opportunities for mean reversion traders. Symmetrically, extreme bullish readings (above the upper threshold with bright green coloring) indicate potential short opportunities or long exit points as price becomes statistically overbought. The moderate zones (lighter colors between midpoint and threshold) serve as early warning areas where traders can prepare for potential reversals, while exits from extreme zones (crossing back inside the thresholds) often provide confirmation that mean reversion is underway.
▶ Trend and Distribution Analysis:
Beyond discrete overbought/oversold signals, the histogram's color pattern and shape reveal the underlying trend structure and distribution characteristics. Sustained periods where the Z-Score oscillates primarily in positive territory (green bars) indicate a bullish trend where price consistently trades above its moving average baseline, even if not reaching extreme levels. Conversely, predominant negative readings (red bars) suggest bearish trend conditions. The distribution shape itself provides insight into market behavior, e.g., a narrow, centered distribution clustering near zero indicates tight ranging conditions with price respecting the mean, while a wide distribution with frequent extreme readings reveals volatile trending or choppy conditions. Asymmetric distributions skewed heavily toward one side demonstrate persistent directional bias, whereas balanced distributions suggest equilibrium between bulls and bears.
▶ Built-in Alerts:
Seven alert conditions enable automated monitoring of statistical extremes and trend transitions. Enter Overbought and Enter Oversold alerts trigger when the Z-Score crosses into extreme zones, providing early warnings of potential reversal setups. Exit Overbought and Exit Oversold alerts signal when price begins reverting from extremes, offering confirmation that mean reversion has initiated. Zero Cross Up and Zero Cross Down alerts identify transitions through the neutral line, indicating shifts between above-mean and below-mean price action that can signal trend changes. The Extreme Zone Entry alert fires on any extreme threshold penetration regardless of direction, allowing unified monitoring of both overbought and oversold opportunities.
▶ Color Customization:
Six visual themes (Classic, Aqua, Cosmic, Ember, Neon, plus Custom) accommodate different chart backgrounds and aesthetic preferences, ensuring optimal contrast and readability across trading platforms. The bar transparency control (0-90%) allows fine-tuning of visual prominence, with minimal transparency creating bold, attention-grabbing bars for primary analysis, while higher transparency values produce subtle background context when using the oscillator alongside other indicators. The extreme and moderate zone coloring system uses automatic opacity variation to create instant visual hierarchy, with darkest colors highlight the most statistically significant deviations demanding immediate attention, while lighter shades mark developing conditions that warrant monitoring but may not yet justify action. Optional candle coloring extends the Z-Score color scheme directly to the price candles on the main chart, enabling traders to instantly recognize statistical extremes and trend conditions without needing to reference the oscillator panel, creating a unified visual experience where both price action and statistical analysis share the same color language.

Entry / TP / SL Alert Bands (Simple & Stable)
Get an alert before you reach your take profit or stop loss. Set as a percentage over the distance to your stop loss and take profit and improve your Money Management

JAM ALGO Signals
"Remove the filters to view signals, then customize the parameters to your preference and enjoy using the indicator!" ✅
JAM ALGO Signals
Description:
🚀 Advanced Trading Signals with Risk Management & Alerts
This indicator is a complete all-in-one tool for traders seeking precise entries and exits with built-in risk management and real-time statistics. It combines RSI and EMA-based analysis, projected Take Profit (TP) and Stop Loss (SL) levels, customizable filters, and premium alerts directly on your TradingView chart.
✨ Key Features:
Entry Signals 🔹
Buy & Sell signals based on price action and RSI conditions.
Trend confirmation via EMA (200 and optional 50-period filters).
Visual signals: Labels, Arrows, Triangles, or Text.
Risk Management (RR) ⚖️
Define Stop Loss (SL) and multiple Take Profit levels (TP1, TP2, TP3) based on risk ratio (R).
Configurable projection bars to visualize target levels.
Colored zones for TP & SL, with optional borders for clarity.
Premium Alerts 🔔
Alerts for BUY / SELL signals, TP1 / TP2 / TP3, and SL hits.
Instant notifications when levels are reached.
Advanced Filters 🛡️
EMA50 Trend Filter: confirms short-term trend.
RSI Direction Filter: ensures momentum alignment.
Volatility Filter (ATR14 > Range): ensures enough market movement.
Candle Size Filter: avoids entries on too small candles.
SL Overlap Filter: prevents trades overlapping existing SL levels.
Real-Time Statistics 📊
Total trades, wins (TP1), and losses (SL).
Winrate (%), cumulative profit, and average RR ratio.
Optimizes strategy tracking directly on the chart.
Customizable Visuals 🎨
TP & SL line colors and styles (solid, dashed, dotted).
Fully adjustable signal labels (color, size, type).
Configurable stats table with background & text colors.
🔥 Advantages:
Complete tool for day trading and swing trading.
Clear visualization of critical risk/reward levels.
Automatic alerts for fast reaction without constant monitoring.
Integrated statistics for performance evaluation and strategy improvement.
Recommended for:
Traders using price action, intraday strategies, scalping, or swing trading, who want advanced risk management with visual signals and performance analytics on TradingView.

Backtest any Indicator [Target Mode] StrategyUniversal Backtester Strategy with Sequential Logic
This strategy serves as a highly versatile, universal backtesting engine designed to test virtually any indicator-based trading system without requiring custom code for every new idea. It transforms standard indicator comparisons into a robust trading strategy with advanced features like sequential entry steps, dynamic target modes, and automated webhook alerts.
The core philosophy of this script is flexibility. Whether you are testing simple crossovers (e.g., MA Cross) or complex multi-stage setups (e.g., RSI overbought followed by a MACD flip), this tool allows you to configure logic via the settings panel and immediately see backtested results with professional-grade risk management.
Core Logic: Source vs. Target Mode
The fundamental building block of this strategy is the "Comparator" engine. Instead of hard-coding specific indicators, the script allows users to define logic slots (L1-L5 for Longs, S1-S5 for Shorts).
Each slot operates on a flexible comparison logic:
Source: The primary indicator you are testing (e.g., Close Price, RSI, Volume).
Operator: The condition to check (Equal/Cross, Greater Than, Less Than).
Target Mode:
Value Mode: Compares the Source against a fixed number (e.g., RSI > 70).
Source Mode: Compares the Source against another dynamic indicator (e.g., Close > SMA 200).
This "Target Mode" switch allows the strategy to adapt to almost any technical analysis concept, from oscillator levels to moving average trends.
Advanced Entry System: Sequential Steps (1-5)
Unlike standard backtesters that usually require all conditions to happen simultaneously (AND logic), this strategy implements a State Machine for sequential execution. Each of the 5 entry slots (L1-L5 / S1-S5) is assigned a "Step" number.
The logic flows as follows:
Stage 1: The strategy waits for all conditions assigned to "Step 1" to be true.
Latch & Wait: Once Step 1 is met, the strategy "remembers" this and advances to Stage 2. It waits for a subsequent bar to satisfy Step 2 conditions.
Trigger: The actual trade entry is only executed once the highest assigned step is completed.
Example Use Case:
Step 1: Price closes below the Lower Bollinger Band (Dip).
Step 2: RSI crosses back above 30 (Confirmation).
Execution: Buy Signal triggers on the Step 2 confirmation candle.
This creates a realistic "Setup -> Trigger" workflow common in professional trading, preventing premature entries.
Exit Logic & Risk Management
The strategy employs a dual-layer exit system to maximize profit retention and protect capital.
1. Signal-Based Exits (OR Logic) There are 5 configurable exit slots (LX1-LX5 / SX1-SX5). Unlike entries, these operate on "OR" logic. If any enabled exit condition is met (e.g., RSI becomes overbought OR Price crosses below EMA), the position is closed immediately.
2. Hard Stop & Take Profit
Fixed %: Users can set a hard percentage-based Stop Loss and Take Profit.
Trailing Stop: A toggleable "Trailing?" feature allows the Stop Loss to dynamically trail the price.
Longs: The SL moves up as the price makes new highs.
Shorts: The SL moves down as the price makes new lows.
Automated Alerts & Webhooks
This script is built with automation in mind. It includes a dedicated makeJson() function that constructs a JSON payload compatible with most trading bots (e.g., 3Commas, TradersPost, Tealstreet).
Alert Modes Supported: | Alert Type | Description | | :--- | :--- | | Order Fills Only | Triggers standard TradingView strategy alerts when the broker emulator fills an order. | | Alert() Function | Triggers specific JSON payloads defined in the code ("action": "buy", "ticker": "MNQ", etc.). |
The script automatically calculates the alert quantity based on your equity percentage settings, ensuring the payload matches your backtest sizing.
Dashboard & Visuals
To aid in rapid analysis, the strategy includes visual tools directly on the chart:
Performance Table: A dashboard (top-right) displays real-time stats including Net Profit, Win Rate, Profit Factor, and Max Drawdown.
Trade Markers: Custom labels (goLong, exLong) show exactly where trades opened and closed, including the trade number and profit percentage.
SL/TP Visualization: Dynamic step-lines (Orange for SL, Lime for TP) show exactly where your protection levels are sitting, helping you visually verify if your stops are too tight or too loose.

CD + NX (with CD Bottom Alert)It combines custom bands with optional buy & sell signals, making it easier to spot potential entry and exit opportunities across multiple timeframes.
梯子NX指标,显示长短周期趋势
the buy & sell signals is no repaint or using the future functionality.
cd指标,无未来函数 repaint的抄底卖出指标
after buying, I will provide a PDF and more information for how to use this one.
添加抄底警报,详细用法/打法付费后会有详细教程

Deneme Elmas Formasyonu 2.0Elmas Formation 2.0 is a proprietary, invite-only market analysis indicator designed to identify high-quality momentum and trend alignment across multiple internal layers. Advanced parameter controls (Dia / Mond / EON) are available only in the Pro version.
Trial users see a protected visualization while the core engine remains fully active.

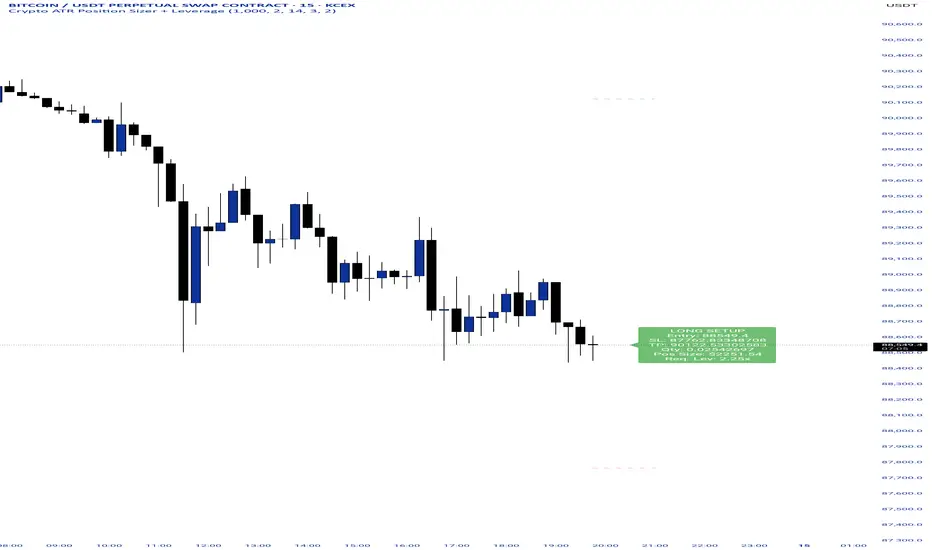
Crypto ATR Position Sizer + LeverageThis indicator is a "heads-up display" for crypto traders who need real time risk management without manually calculating position sizes. It uses Average True Range (ATR) to dynamically place Stop Losses based on current market volatility and automatically calculates the exact position size needed to respect your risk percentage.
Key Features:
Dynamic Risk Management: Stop Loss and Take Profit levels adjust automatically based on market volatility (ATR).
Auto-Position Sizing: Calculates the exact Quantity (in coins) and Position Value (in $) to ensure you never risk more than your defined percentage (e.g., 1% or 2%).
Leverage Calculator: Instantly sees the "Required Leverage" needed to execute the trade size relative to your account balance.
Crypto Precision: Displays up to 8 decimal places, making it compatible with both Bitcoin and low-sat altcoins.
Toggable Direction: Switch between Long and Short biases instantly via the settings menu.
How to Use:
Add the indicator to your chart.
Open Settings and input your Account Balance and Risk %.
Choose your direction (Long or Short) using the checkboxes.
The label will display your Entry, SL, TP, Coin Quantity, and Required Leverage in real-time.
Renko Average Bricks This indicator calculates the average RENKO brick streaks. Streaks=consecutive bricks of the same color. EX. G= 1 streak of 1. GGG = 1 streak of 3. RR 1 streak of 2. Single bricks count. There is the option for look back period which can be changed but Defaults to 50. Calculates the last 50 completed green streaks and then averages them. Same with red streaks. Only closed bricks count.
Very Simple and can be used for targets, ect.
Cheers

Buy / Sell Signals With Take Profits (Non-Repaint)This indicator generates automatic BUY/SELL flip signals based on trend direction, volatility status, and ATR dynamics.
Labels are placed based on actual High/Low and do not shift.
Features
✔ Dynamic ATR Multipliers
✔ Volatility Stretch (calm market → narrow, aggressive → wide)
✔ Trend Memory (25-bar direction memory)
✔ Automatic TP1–TP5 (%1 – %5) calculation
✔ Desktop & Mobile compatible TP Panel
✔ Bull/Bear Flip labels
✔ TradingView alert support
Suitable Markets
Forex, Crypto, Stocks, Indices, Gold, Oil
Works on all timeframes (5min – 1min – 4min – Daily).
⚠ Important Note
This tool is not investment advice.
It does not provide any buy–sell recommendations.
All trading decisions are yours; risk management is entirely the user's responsibility.

Position CalculatorAn on chart indicator that helps you calculate position sizes, risk/reward ratios, and potential profit/loss for your trades.

ALFA BUY IndikatorThis indicator is an improved version of the Mucip + Yağız indicator. I have been using it smoothly for the past 3 months.
I use it on futures markets for the three major coins such as BNB/USDT, BTC/USDT, and ETH/USDT.
My usage logic is as follows: on average, it generates around 2 signals per coin per day.
For each trade, I enter positions using 4–5% of my total capital.
I use 25x leverage on ETH and BNB, and 50x leverage on BTC.
My take-profit levels are 0.25% for BTC and 0.5% for the others, which results in approximately 10–12% profit per trade.
Overall, the average daily capital growth is around 2–3%.
Note: I use a trading bot for executions, because the indicator is designed for 2-minute charts, and it is almost impossible to catch the signals manually.
So far, everything has been working flawlessly, and it performs best on 2-minute timeframes.

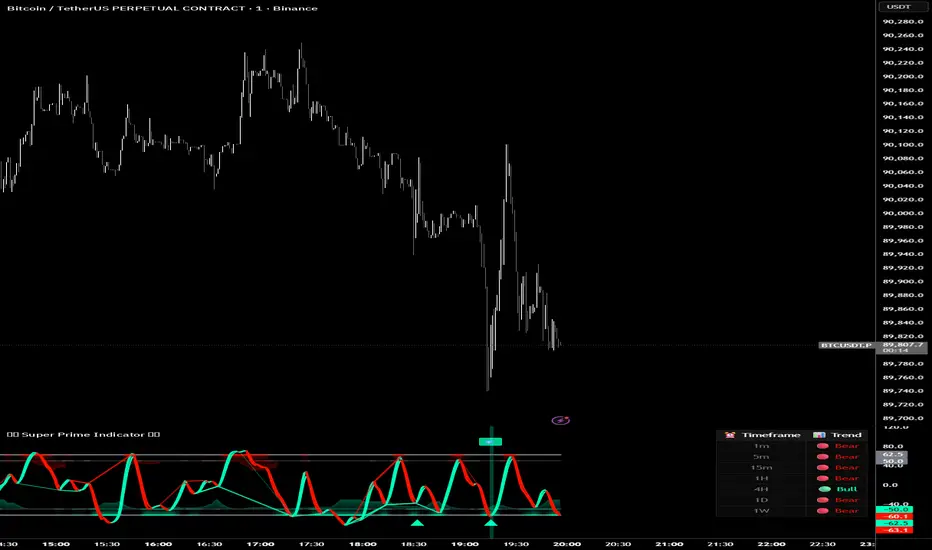
Super Prime Indicator [TraderCloud]⭐🧠 Super Prime Indicator 🧠⭐
ML-Enhanced SMI + Whale Hunter Pro
Super Prime Indicator is an advanced, all-in-one market intelligence tool that combines machine-learning-enhanced SMI, Whale Hunter Pro logic, multi-timeframe trend analysis, and probabilistic market modeling into a single, highly visual oscillator.
Designed for professional crypto traders, this indicator focuses on identifying institutional activity, high-probability reversals, and trend continuation zones with precision.
🔹 Core Components
🧠 Machine Learning SMI (KNN-Enhanced)
Traditional SMI upgraded with K-Nearest Neighbors (KNN) learning
Adaptive overbought / oversold levels based on historical behavior
Feature-based distance analysis (momentum, volatility, slope, etc.)
Optional Kalman, Double EMA, or ALMA filtering
🐋 Whale Hunter Pro System
RSI divergence detection across multiple pivot scales
KDE (Kernel Density Estimation) probability modeling
Institutional bias detection using Open Interest (OI) and CVD filters
Strict / Moderate / Aggressive signal modes
Whale buy/sell zones with visual background highlights
📊 Multi-Timeframe Trend Dashboard
Real-time trend alignment across
1m / 5m / 15m / 1H / 4H / 1D / 1W
Clear bullish / bearish status table for top-down analysis
📈 Advanced Divergence Engine
Regular & hidden divergence detection
Short, medium, and long-term pivot sets
Dynamic divergence line plotting with strength-based visuals
📐 Bayesian Probability Model
Probabilistic market direction estimation
Uses Bollinger Bands & SMA state sequences
Normalized directional probability output for risk assessment
🎯 Trading Use Cases
Identify smart money accumulation & distribution
Spot high-probability reversals before price confirmation
Confirm trend continuation with multi-TF alignment
Filter false signals using OI & CVD confirmation
Combine momentum, structure, and probability in one view
🎨 Visual & UX Features
Neon / color-blind friendly palettes
Gradient-based momentum zones
Clean oscillator design with minimal chart clutter
Whale emoji signals for instant recognition
RSI Info WindowRSI Info Window is a minimalist overlay utility that displays the current RSI value and a simple market state label (Overbought, Oversold, or Neutral) directly on the chart. The goal is to provide quick RSI context without using a separate oscillator pane, helping keep the chart clean for price-action, SMC, and structure-based trading.
How it works
Calculates RSI using the selected RSI Length (default 14).
Compares RSI to the Overbought and Oversold thresholds (default 70/30).
Displays a small label on the most recent candle showing:
RSI value
Current state: Overbought / Oversold / Neutral
The label updates in real time as the latest candle forms.
Inputs
RSI Length – Controls RSI sensitivity (default 14)
Overbought Level – RSI threshold for overbought (default 70)
Oversold Level – RSI threshold for oversold (default 30)
How to use
Overbought: RSI above the overbought level — may indicate momentum is extended; watch for continuation vs exhaustion based on your system.
Oversold: RSI below the oversold level — may indicate downside extension; watch for reversal conditions and structure confirmation.
Neutral: RSI between thresholds — often indicates balanced conditions or consolidation.
This indicator is designed as a compact reference tool, not a complete trading system.
Notes
The overlay label is anchored to the most recent candle and refreshes on the last bar.
Intended to save screen space vs. a full RSI subpanel.
Disclaimer
This script is for educational and informational purposes only and does not constitute financial advice. Always use risk management and confirm signals with your broader trading plan.
