ZigZagCoreZigZagCore
ZigZagCore is a generic ZigZag engine that works with any user-defined threshold (ATR-based, volatility-based, fixed ticks, etc.).
API
import ReflexSignals/ZigZagCore/ as zz
var zz.ZzState state = zz.zz_new()
float thr = ... // your threshold in price units
state := zz.zz_update(state, thr)
zz_update(state, thr)
Parameters:
state (ZzState)
thr (float)
ZzState
Fields:
dir (series int)
highSinceLow (series float)
lowSinceHigh (series float)
lastHighLevel (series float)
lastLowLevel (series float)
lastHighIndex (series int)
lastLowIndex (series int)
highSinceLowIndex (series int)
lowSinceHighIndex (series int)
isNewHigh (series bool)
isNewLow (series bool)
Directional State
dir = 1 → market is in an upswing
dir = -1 → market is in a downswing
dir = na → initial undecided state
Live Swing Tracking (Unconfirmed Leg)
Continuously updated swing extremes:
highSinceLow — highest price since the last confirmed low
lowSinceHigh — lowest price since the last confirmed high
Their corresponding bar indices
These fields describe the current active swing leg, which updates every bar until a pivot is confirmed.
Pivot Detection
A pivot confirms only when price moves beyond the prior swing extreme by more than threshold. When this occurs, the library sets:
isNewHigh = true (on the detection bar only) and updates lastHighLevel, lastHighIndex
isNewLow = true and updates lastLowLevel, lastLowIndex
Pivot

LibPvotLibrary "LibPvot"
This is a library for advanced technical analysis, specializing
in two core areas: the detection of price-oscillator
divergences and the analysis of market structure. It provides
a back-end engine for signal detection and a toolkit for
indicator plotting.
Key Features:
1. **Complete Divergence Suite (Class A, B, C):** The engine detects
all three major types of divergences, providing a full spectrum of
analytical signals:
- **Regular (A):** For potential trend reversals.
- **Hidden (B):** For potential trend continuations.
- **Exaggerated (C):** For identifying weakness at double tops/bottoms.
2. **Advanced Signal Filtering:** The detection logic uses a
percentage-based price tolerance (`prcTol`). This feature
enables the practical detection of Exaggerated divergences
(which rarely occur at the exact same price) and creates a
"dead zone" to filter insignificant noise from triggering
Regular divergences.
3. **Pivot Synchronization:** A bar tolerance (`barTol`) is used
to reliably match price and oscillator pivots that do not
align perfectly on the same bar, preventing missed signals.
4. **Signal Invalidation Logic:** Features two built-in invalidation
rules:
- An optional `invalidate` parameter automatically terminates
active divergences if the price or the oscillator breaks
the level of the confirming pivot.
- The engine also discards 'half-pivots' (e.g., a price pivot)
if a corresponding oscillator pivot does not appear within
the `barTol` window.
5. **Stateful Plotting Helpers:** Provides helper functions
(`bullDivPos` and `bearDivPos`) that abstract away the
state management issues of visualizing persistent signals.
They generate gap-free, accurately anchored data series
ready to be used in `plotshape` functions, simplifying
indicator-side code.
6. **Rich Data Output:** The core detection functions (`bullDiv`, `bearDiv`)
return a comprehensive 9-field data tuple. This includes the
boolean flags for each divergence type and the precise
coordinates (price, oscillator value, bar index) of both the
starting and the confirming pivots.
7. **Market Structure & Trend Analysis:** Includes a
`marketStructure` function to automatically identify pivot
highs/lows, classify their relationship (HH, LH, LL, HL),
detect structure breaks, and determine the current trend
state (Up, Down, Neutral) based on pivot sequences.
---
**DISCLAIMER**
This library is provided "AS IS" and for informational and
educational purposes only. It does not constitute financial,
investment, or trading advice.
The author assumes no liability for any errors, inaccuracies,
or omissions in the code. Using this library to build
trading indicators or strategies is entirely at your own risk.
As a developer using this library, you are solely responsible
for the rigorous testing, validation, and performance of any
scripts you create based on these functions. The author shall
not be held liable for any financial losses incurred directly
or indirectly from the use of this library or any scripts
derived from it.
bullDiv(priceSrc, oscSrc, leftLen, rightLen, depth, barTol, prcTol, persist, invalidate)
Detects bullish divergences (Regular, Hidden, Exaggerated) based on pivot lows.
Parameters:
priceSrc (float) : series float Price series to check for pivots (e.g., `low`).
oscSrc (float) : series float Oscillator series to check for pivots.
leftLen (int) : series int Number of bars to the left of a pivot (default 5).
rightLen (int) : series int Number of bars to the right of a pivot (default 5).
depth (int) : series int Maximum number of stored pivot pairs to check against (default 2).
barTol (int) : series int Maximum bar distance allowed between the price pivot and the oscillator pivot (default 3).
prcTol (float) : series float The percentage tolerance for comparing pivot prices. Used to detect Exaggerated
divergences and filter out market noise (default 0.05%).
persist (bool) : series bool If `true` (default), the divergence flag stays active for the entire duration of the signal.
If `false`, it returns a single-bar pulse on detection.
invalidate (bool) : series bool If `true` (default), terminates an active divergence if price or oscillator break
below the confirming pivot low.
Returns: A tuple containing comprehensive data for a detected bullish divergence.
regBull series bool `true` if a Regular bullish divergence (Class A) is active.
hidBull series bool `true` if a Hidden bullish divergence (Class B) is active.
exgBull series bool `true` if an Exaggerated bullish divergence (Class C) is active.
initPivotPrc series float Price value of the initial (older) pivot low.
initPivotOsz series float Oscillator value of the initial pivot low.
initPivotBar series int Bar index of the initial pivot low.
lastPivotPrc series float Price value of the last (confirming) pivot low.
lastPivotOsz series float Oscillator value of the last pivot low.
lastPivotBar series int Bar index of the last pivot low.
bearDiv(priceSrc, oscSrc, leftLen, rightLen, depth, barTol, prcTol, persist, invalidate)
Detects bearish divergences (Regular, Hidden, Exaggerated) based on pivot highs.
Parameters:
priceSrc (float) : series float Price series to check for pivots (e.g., `high`).
oscSrc (float) : series float Oscillator series to check for pivots.
leftLen (int) : series int Number of bars to the left of a pivot (default 5).
rightLen (int) : series int Number of bars to the right of a pivot (default 5).
depth (int) : series int Maximum number of stored pivot pairs to check against (default 2).
barTol (int) : series int Maximum bar distance allowed between the price pivot and the oscillator pivot (default 3).
prcTol (float) : series float The percentage tolerance for comparing pivot prices. Used to detect Exaggerated
divergences and filter out market noise (default 0.05%).
persist (bool) : series bool If `true` (default), the divergence flag stays active for the entire duration of the signal.
If `false`, it returns a single-bar pulse on detection.
invalidate (bool) : series bool If `true` (default), terminates an active divergence if price or oscillator break
above the confirming pivot high.
Returns: A tuple containing comprehensive data for a detected bearish divergence.
regBear series bool `true` if a Regular bearish divergence (Class A) is active.
hidBear series bool `true` if a Hidden bearish divergence (Class B) is active.
exgBear series bool `true` if an Exaggerated bearish divergence (Class C) is active.
initPivotPrc series float Price value of the initial (older) pivot high.
initPivotOsz series float Oscillator value of the initial pivot high.
initPivotBar series int Bar index of the initial pivot high.
lastPivotPrc series float Price value of the last (confirming) pivot high.
lastPivotOsz series float Oscillator value of the last pivot high.
lastPivotBar series int Bar index of the last pivot high.
bullDivPos(regBull, hidBull, exgBull, rightLen, yPos)
Calculates the plottable data series for bullish divergences. It manages
the complex state of a persistent signal's plotting window to ensure
gap-free and accurately anchored visualization.
Parameters:
regBull (bool) : series bool The regular bullish divergence flag from `bullDiv`.
hidBull (bool) : series bool The hidden bullish divergence flag from `bullDiv`.
exgBull (bool) : series bool The exaggerated bullish divergence flag from `bullDiv`.
rightLen (int) : series int The same `rightLen` value used in `bullDiv` for correct timing.
yPos (float) : series float The series providing the base Y-coordinate for the shapes (e.g., `low`).
Returns: A tuple of three `series float` for plotting bullish divergences.
regBullPosY series float Contains the static anchor Y-value for Regular divergences where a shape should be plotted; `na` otherwise.
hidBullPosY series float Contains the static anchor Y-value for Hidden divergences where a shape should be plotted; `na` otherwise.
exgBullPosY series float Contains the static anchor Y-value for Exaggerated divergences where a shape should be plotted; `na` otherwise.
bearDivPos(regBear, hidBear, exgBear, rightLen, yPos)
Calculates the plottable data series for bearish divergences. It manages
the complex state of a persistent signal's plotting window to ensure
gap-free and accurately anchored visualization.
Parameters:
regBear (bool) : series bool The regular bearish divergence flag from `bearDiv`.
hidBear (bool) : series bool The hidden bearish divergence flag from `bearDiv`.
exgBear (bool) : series bool The exaggerated bearish divergence flag from `bearDiv`.
rightLen (int) : series int The same `rightLen` value used in `bearDiv` for correct timing.
yPos (float) : series float The series providing the base Y-coordinate for the shapes (e.g., `high`).
Returns: A tuple of three `series float` for plotting bearish divergences.
regBearPosY series float Contains the static anchor Y-value for Regular divergences where a shape should be plotted; `na` otherwise.
hidBearPosY series float Contains the static anchor Y-value for Hidden divergences where a shape should be plotted; `na` otherwise.
exgBearPosY series float Contains the static anchor Y-value for Exaggerated divergences where a shape should be plotted; `na` otherwise.
marketStructure(highSrc, lowSrc, leftLen, rightLen, srcTol)
Analyzes the market structure by identifying pivot points, classifying
their sequence (e.g., Higher Highs, Lower Lows), and determining the
prevailing trend state.
Parameters:
highSrc (float) : series float Price series for pivot high detection (e.g., `high`).
lowSrc (float) : series float Price series for pivot low detection (e.g., `low`).
leftLen (int) : series int Number of bars to the left of a pivot (default 5).
rightLen (int) : series int Number of bars to the right of a pivot (default 5).
srcTol (float) : series float Percentage tolerance to consider two pivots as 'equal' (default 0.05%).
Returns: A tuple containing detailed market structure information.
pivType series PivType The type of the most recently formed pivot (e.g., `hh`, `ll`).
lastPivHi series float The price level of the last confirmed pivot high.
lastPivLo series float The price level of the last confirmed pivot low.
lastPiv series float The price level of the last confirmed pivot (either high or low).
pivHiBroken series bool `true` if the price has broken above the last pivot high.
pivLoBroken series bool `true` if the price has broken below the last pivot low.
trendState series TrendState The current trend state (`up`, `down`, or `neutral`).

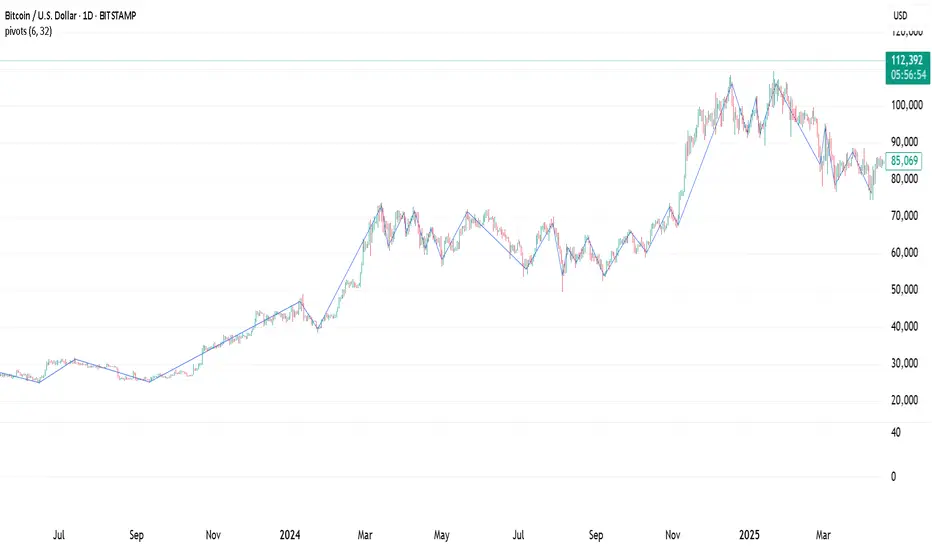
Pivot Points. High & Lows By Reversal PercentageLibrary "Pivot Points. High & Lows By Reversal Percentage" by Jal9000
This Pine Script library provides a robust function for identifying and tracking pivot points (reversal points) in price data, suitable for integration into custom trading indicators and strategies.
🛠️ Main Features:
- ✅ Identifies pivot highs and lows based on configurable price movement thresholds.
- ✅ Lightweight. No candle backtracing used. Much less computation heavy.
- ✅ Supports multiple calls (with different values) within a single script.
- ✅ Compatible with request.security for multi-timeframe analysis.
- ✅ Returns both confirmed and temporary pivots for flexible integration.
- ✅ Pinescript V5 and V6 compliant code.
Purpose:
The pivots library enables Pine Script developers to easily add pivot point detection to their scripts. It identifies significant price reversals by evaluating price movements against a minimum range threshold ( min_range_pct ) and confirming reversals based on a percentage ( reversal_pct ) of the prior trend’s magnitude. The library supports multiple simultaneous calls with different settings, making it ideal for multi-timeframe strategies.
How It Works:
The library’s f_calculatePivot function tracks price movements to detect pivot points:
Minimum Range Threshold : A potential pivot is considered if the price moves beyond the min_range_pct percentage of the current high (for a high pivot) or low (for a low pivot), ensuring sufficient movement.
Reversal Confirmation : A pivot is confirmed if the price reverses from the potential pivot by at least the reversal_pct percentage of the distance between the last confirmed pivot and the current potential pivot, measuring the retracement relative to the prior trend’s magnitude.
The function alternates between tracking highs (in an uptrend) and lows (in a downtrend), updating the trend when a pivot is confirmed.
State management uses an array of pivot_state objects, allowing independent calculations for different timeframes and min_range_pct values within the same script.
## Technical Reference
Functions:
f_calculatePivot(series float _high, series float _low, float _min_range_pct, float _reversal_pct) →
- Parameters:
_high : The high price series (e.g., high or math.max(open, close) ).
_low : The low price series (e.g., low or math.min(open, close) ).
_min_range_pct : The minimum percentage price movement to consider a potential pivot.
_reversal_pct : The percentage of the prior trend’s distance required to confirm a pivot.
- Returns:
A tuple containing:
isNewPivot : Boolean indicating if a new pivot was confirmed.
last_confirmed_pivot : The most recent confirmed pivot (type pivot ).
temp_pivot : The current temporary pivot (type pivot ).
Pivot type:
idx (series int) : Bar index of the pivot.
typ (series int) : Type of pivot ( PIVOT_HIGH or PIVOT_LOW ).
prc (series float) : Price of the pivot.
tme (series int) : Timestamp of the pivot.
Constants (internal):
TREND_LONG , TREND_SHORT : Trend direction indicators (1, -1).
PIVOT_HIGH , PIVOT_LOW : Pivot type indicators (1, -1).
✨ Example of Use:
//@version=5
indicator("Pivot Example", overlay=true)
import jal9000/pivots/1 as pivots
// Inputs
min_range_pct = input.float(20.0, 'Min Range %')
reversal_pct = input.float(30.0, 'Reversal %')
ignore_wick = input.bool(true, 'Ignore wick')
h = ignore_wick ? math.max(open, close) : high
l = ignore_wick ? math.min(open, close) : low
// Call the function with high, low, and input parameters
= pivots.f_calculatePivot(h, l, min_range_pct, reversal_pct)
// Variable to store previous confirmed pivot outside the function
var pivots.pivot prev_confirmed_pivot = na
// Draw the line if a new pivot is confirmed and previous pivot exists
if is_new_pivot
if not na(prev_confirmed_pivot) and not na(new_confirmed_pivot)
line.new(x1 = prev_confirmed_pivot.idx, y1 = prev_confirmed_pivot.prc, x2 = new_confirmed_pivot.idx, y2 = new_confirmed_pivot.prc, color = color.blue, width = 1)
prev_confirmed_pivot := new_confirmed_pivot
## Release Notes
v1
- Initial release of the pivots library with f_calculatePivot function for detecting pivot points and supporting multiple configurations and timeframes.
v2
- Code is Pinescript V6 ready. Remains identified as V5, but changing the version number is the only thing that is required to be v6.
SITFX_FuturesSpec_v17SITFX_FuturesSpec_v17 – Universal Futures Contract Library
Full-scale futures contract specification library for Pine Script v6. Covers CME, CBOT, NYMEX, COMEX, CFE, Eurex, ICE, and more – including minis, micros, metals, energies, FX, and bonds.
Key Features:
✅ Instrument‑agnostic: ES/MES, NQ/MNQ, YM/MYM, RTY/M2K, metals, energies, FX, bonds
✅ Full contract data: Tick size, tick value, point value, margins
✅ Continuation‑safe: Single‑line logic, no arrays or continuation errors
✅ Foundation for SITFX tools: Gann, Fibs, structure, and risk modules
Usage example:
import SITFX_FuturesSpec_v17/1 as fs
spec = fs.get(syminfo.root)
label.new(bar_index, high, str.format("{0}: Tick={1}, Value=${2}", spec.name, spec.tickSize, spec.tickValue))

BarUtils: Get Bar Index from DateLibrary "BarUtils"
getBarIndexFromDate(targetTimestamp)
Parameters:
targetTimestamp (int)
**Description**:
This utility provides a reliable way to calculate the `bar_index` of a specific calendar date, regardless of chart resolution. It's especially useful for anchoring scripts to historical events, labeling macroeconomic moments, or marking custom time-based signals that must remain consistent across timeframes.
Unlike hardcoded `bar_index - N` approaches, this function dynamically estimates the number of bars between a given `timestamp()` and the current bar using the actual time-per-bar (`time - time `). It works correctly on intraday, daily, weekly, and monthly charts.
### 💡 **Function Provided**:
import TradeTitan120/BarUtils/1
* `getBarIndexFromDate(int targetTimestamp)`
→ Returns the estimated `bar_index` that aligns with a given timestamp
### ✅ **Use Cases**:
* Marking past events like FOMC meetings, market crashes, or personal signals
* Backtesting entry/exit conditions from specific calendar dates
* Anchoring visual elements (shapes, lines, labels) across resolutions
This tool is simple, fast, and built for accuracy. Use it to enhance multi-timeframe compatibility in any script.
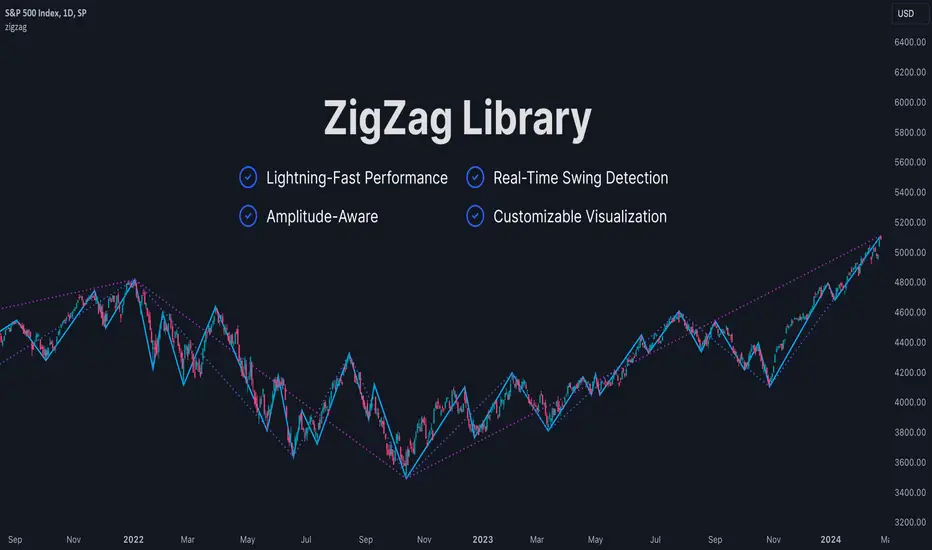
ZigZag LibraryThis is yet another ZigZag library.
🔵 Key Features
1. Lightning-Fast Performance : Optimized code ensures minimal lag and swift chart updates.
2. Real-Time Swing Detection : No more waiting for swings to finalize! This library continuously identifies the latest swing formation.
3. Amplitude-Aware : Discover significant swings earlier, even if they haven't reached the standard bar length.
4. Customizable Visualization : Draw ZigZag on-demand using polylines for a tailored analysis experience.
Stay tuned for more features as this library is being continuously enhanced. For the latest updates, please refer to the release information.
🔵 API
// Import this library. Remember to check the latest version of this library and replace the version number below.
import algotraderdev/zigzag/1 as zz
// Initialize the ZigZag instance.
var zz.ZigZag zig = zz.ZigZag.new().init(
zz.Settings.new(
swingLen = 5,
lineColor = color.blue,
lineStyle = line.style_solid,
lineWidth = 1))
// Analyze the ZigZag using the latest bar's data.
zig.tick()
// Draw the ZigZag.
if barstate.islast
zig.draw()
series_collectionLibrary "series_collection"
A personal collection of commonly used series types like moving averages that are supported directly by
the pinescript library ('ALMA', 'DEMA', 'EMA', 'HMA', 'RMA', 'SMA', 'SWMA', 'VWMA', 'WMA'), highest and lowest source,
median and pivots. One single function (with overloads) that can be configured easily by the user input and can be
used as a core piece of functionality for many user cases. This library was created to abstract away and re-use this
commonly used functionality in my "Two MA Signal Indicator" script and the "Template Trailing Strategy" script. Both
of them use the "two_ma_logic" for defining entry and exit signals. While this piece of work does not contain any
novel mathematical expressions and just adds a convinient (and configurable) way to do things, I hope that might add
value to other scripts as well and future projects.
cust_series(length, seriesType, source)
cust_series - Calculate the custom series of the given source for the given length and type
Parameters:
length (simple int) : - The length of the custom series
seriesType (simple string) : - The type of the custom series
source (float) : - The source of the values
Returns: - The resulting value of the calculations of the custom series
cust_series(length, seriesType, source)
cust_series - Calculate the custom series of the given source for the given length and type
Parameters:
length (simple float) : - The length of the custom series (ceiled)
seriesType (simple string) : - The type of the custom series
source (float) : - The source of the values
Returns: - The resulting value of the calculations of the custom series

lib_zigLibrary "lib_zig"
Object oriented implementation of ZigZag
method tostring(this, date_format)
Namespace types: Zigzag
Parameters:
this (Zigzag)
date_format (simple string)
method update(this)
Namespace types: Zigzag
Parameters:
this (Zigzag)
method draw(this, colors)
Namespace types: Zigzag
Parameters:
this (Zigzag)
colors (PivotColors type from robbatt/lib_pivot/19)
Zigzag
Fields:
max_pivots (series__integer)
hldata (|robbatt/lib_pivot/19;HLData|#OBJ)
pivots (array__|robbatt/lib_pivot/19;Pivot|#OBJ)
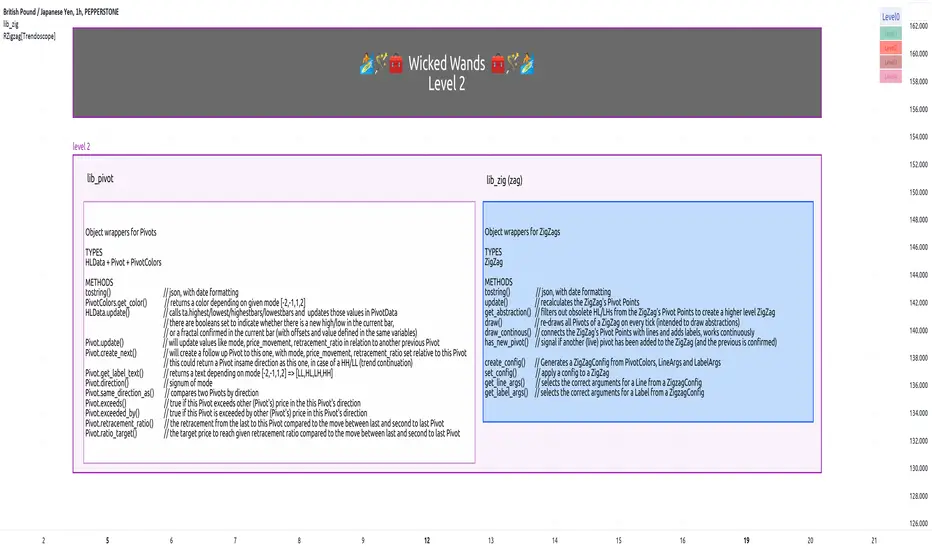
lib_pivotLibrary "lib_pivot"
Object oriented implementation of Pivot methods.
method tostring(this)
Converts HLData to a json string representation
Namespace types: HLData
Parameters:
this (HLData) : HLData
Returns: string representation of Pivot
method tostring(this, date_format)
Namespace types: Pivot
Parameters:
this (Pivot)
date_format (simple string)
method tostring(this, date_format)
Namespace types: Pivot
Parameters:
this (Pivot )
date_format (simple string)
method get_color(this, mode)
Namespace types: PivotColors
Parameters:
this (PivotColors)
mode (int)
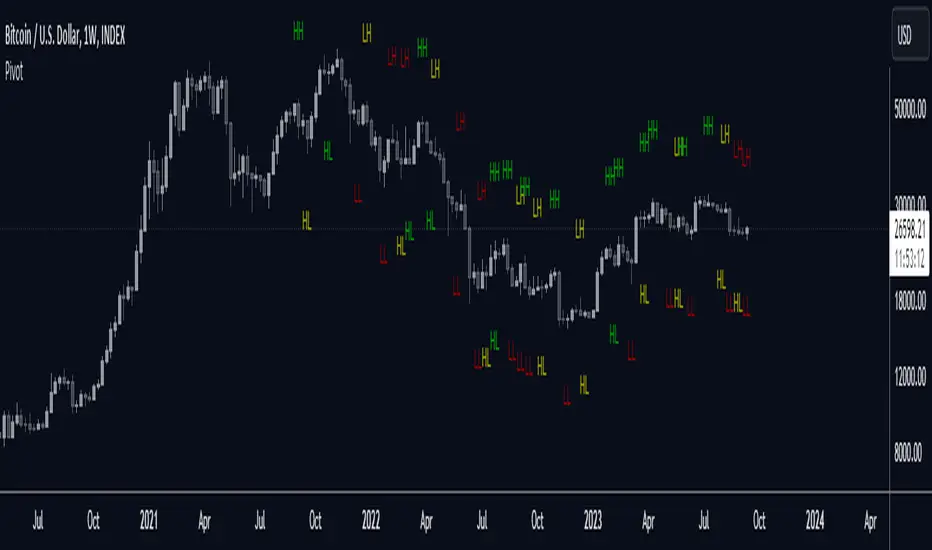
method get_label_text(this)
Namespace types: Pivot
Parameters:
this (Pivot)
method direction(this)
Namespace types: Pivot
Parameters:
this (Pivot)
method same_direction_as(this, other)
Namespace types: Pivot
Parameters:
this (Pivot)
other (Pivot)
method exceeds(this, price)
Namespace types: Pivot
Parameters:
this (Pivot)
price (float)
method exceeds(this, other)
Namespace types: Pivot
Parameters:
this (Pivot)
other (Pivot)
method exceeded_by(this, price)
Namespace types: Pivot
Parameters:
this (Pivot)
price (float)
method exceeded_by(this, other)
Namespace types: Pivot
Parameters:
this (Pivot)
other (Pivot)
method retracement_ratio(this, lastPivot, sec_lastPivot)
Namespace types: Pivot
Parameters:
this (Pivot)
lastPivot (Pivot)
sec_lastPivot (Pivot)
ratio_target(sec_lastPivot, lastPivot, target_ratio)
Parameters:
sec_lastPivot (Pivot)
lastPivot (Pivot)
target_ratio (float)
method update(this, ref_highest, ref_lowest)
Namespace types: HLData
Parameters:
this (HLData)
ref_highest (float)
ref_lowest (float)
method update(this, bar_time, bar_idx, price, prev)
Namespace types: Pivot
Parameters:
this (Pivot)
bar_time (int)
bar_idx (int)
price (float)
prev (Pivot)
method create_next(this, bar_time, bar_idx, price)
Namespace types: Pivot
Parameters:
this (Pivot)
bar_time (int)
bar_idx (int)
price (float)
HLData
HLData wraps the data received from ta.highest, ta.highestbars, ta.lowest, ta.lowestbars, as well as the reference sources
Fields:
length (series int) : lookback length for pivot points
highest_offset (series int) : offset to highest value bar
lowest_offset (series int) : offset to lowest value bar
highest (series float) : highest value within lookback bars
lowest (series float) : lowest value within lookback bars
new_highest (series bool) : update() will set this true if the current candle forms a new highest high at the last (current) bar of set period (length)
new_lowest (series bool) : update() will set this true if the current candle forms a new lowest low at the last (current) bar of set period (length)
new_highest_fractal (series bool) : update() will set this true if the current candle forms a new fractal high at the center of set period (length)
new_lowest_fractal (series bool) : update() will set this true if the current candle forms a new fractal low at the center of set period (length)
PivotColors
Pivot colors for different modes
Fields:
hh (series color) : Color for Pivot mode 2 (HH)
lh (series color) : Color for Pivot mode 1 (LH)
hl (series color) : Color for Pivot mode -1 (HL)
ll (series color) : Color for Pivot mode -2 (LL)
Pivot
Pivot additional pivot data around basic Point
Fields:
point (Point type from robbatt/lib_plot_objects/5)
mode (series int) : can be -2/-1/1/2 for LL/HL/LH/HH
price_movement (series float) : The price difference between this and the previous pivot point in the opposite direction
retracement_ratio (series float) : The ratio between this price_movement and the previous
prev (Pivot)

lib_trackingLibrary "lib_tracking"
tracking highest and lowest with anchor point to track over dynamic periods, e.g. to track a Session HH/LL live and get the bar/time of the LTF wick that matches the HTF HH/LL
// DESIGN DECISION
// why anchored replacements for ta.highest / ta.highestbars / ta.lowest / ta.lowestbars:
// 1. they require a fixed length/lookback which makes it easier to calculate, but
// 2. this prevents us from tracking the HH/LL of a changing timeframe, e.g. live tracking the HH/LL of a running session or unfinished higher timeframe
// 3. tracking with anchor/start/reset flag allows to persist values until the next start/reset, so no other external storage is required
track_highest(value, reset, track_this_bar)
Parameters:
value (float)
reset (bool) : boolean flag to restart tracking from this point (a.k.a anchor)
track_this_bar (bool) : allows enabling and disabling of tracking, e.g. before a session starts or after it ends, values can be kept until next reset.
track_lowest(value, reset, track_this_bar)
Parameters:
value (float)
reset (bool) : boolean flag to restart tracking from this point (a.k.a anchor)
track_this_bar (bool) : allows enabling and disabling of tracking, e.g. before a session starts or after it ends, values can be kept until next reset.
track_hl_htf(htf, value_high, value_low)
Parameters:
htf (string) : the higher timeframe in pinescript string notation
value_high (float)
value_low (float)
Returns:

PivotLibrary "Pivot"
This library helps you store and manage pivots.
bias(isHigh, isHigher, prevWasHigher)
Helper function to calculate bias.
Parameters:
isHigh (bool) : (bool) Wether the pivot is a pivot high or not.
isHigher (bool) : (bool) Wether the pivot is a higher pivot or not.
@return (bool) The bias (true = bullish, false = bearish, na = neutral).
prevWasHigher (bool)
biasToString(bias)
Parameters:
bias (bool)
biasToColor(bias, theme)
Parameters:
bias (bool)
theme (Theme)
nameString(isHigh, isHigher)
Parameters:
isHigh (bool)
isHigher (bool)
abbrString(isHigh, isHigher)
Parameters:
isHigh (bool)
isHigher (bool)
tooltipString(y, isHigh, isHigher, bias, theme)
Parameters:
y (float)
isHigh (bool)
isHigher (bool)
bias (bool)
theme (Theme)
createLabel(x, y, isHigh, isHigher, prevWasHigher, settings)
Parameters:
x (int)
y (float)
isHigh (bool)
isHigher (bool)
prevWasHigher (bool)
settings (Settings)
new(x, y, isHigh, isHigher, settings)
Parameters:
x (int)
y (float)
isHigh (bool)
isHigher (bool)
settings (Settings)
newArray(size, initialValue)
Parameters:
size (int)
initialValue (Pivot)
method getFirst(this)
Namespace types: Pivot
Parameters:
this (Pivot )
method getLast(this, isHigh)
Namespace types: Pivot
Parameters:
this (Pivot )
isHigh (bool)
method getLastHigh(this)
Namespace types: Pivot
Parameters:
this (Pivot )
method getLastLow(this)
Namespace types: Pivot
Parameters:
this (Pivot )
method getPrev(this, numBack, isHigh)
Namespace types: Pivot
Parameters:
this (Pivot )
numBack (int)
isHigh (bool)
method getPrevHigh(this, numBack)
Namespace types: Pivot
Parameters:
this (Pivot )
numBack (int)
method getPrevLow(this, numBack)
Namespace types: Pivot
Parameters:
this (Pivot )
numBack (int)
method getText(this)
Namespace types: Pivot
Parameters:
this (Pivot)
method setX(this, value)
Namespace types: Pivot
Parameters:
this (Pivot)
value (int)
method setY(this, value)
Namespace types: Pivot
Parameters:
this (Pivot)
value (float)
method setXY(this, x, y)
Namespace types: Pivot
Parameters:
this (Pivot)
x (int)
y (float)
method setBias(this, value)
Namespace types: Pivot
Parameters:
this (Pivot)
value (int)
method setColor(this, value)
Namespace types: Pivot
Parameters:
this (Pivot)
value (color)
method setText(this, value)
Namespace types: Pivot
Parameters:
this (Pivot)
value (string)
method add(this, pivot)
Namespace types: Pivot
Parameters:
this (Pivot )
pivot (Pivot)
method updateLast(this, y, settings)
Namespace types: Pivot
Parameters:
this (Pivot )
y (float)
settings (Settings)
method update(this, y, isHigh, settings)
Namespace types: Pivot
Parameters:
this (Pivot )
y (float)
isHigh (bool)
settings (Settings)
Pivot
Stores Pivot data.
Fields:
x (series int)
y (series float)
isHigh (series bool)
isHigher (series bool)
bias (series bool)
lb (series label)
Theme
Attributes for customizable look and feel.
Fields:
size (series string)
colorDefault (series color)
colorNeutral (series color)
colorBullish (series color)
colorBearish (series color)
colored (series bool)
showTooltips (series bool)
showTooltipName (series bool)
showTooltipValue (series bool)
showTooltipBias (series bool)
Settings
All settings for the pivot.
Fields:
theme (Theme)
fontilabLibrary "fontilab"
Provides function's indicators for pivot - trend - resistance.
pivots(src, lenght, isHigh) Detecting pivot points (and returning price + bar index.
Parameters:
src : The chart we analyse.
lenght : Used for the calcul.
isHigh : lookging for high if true, low otherwise.
Returns: The bar index and the price of the pivot.
calcDevThreshold(tresholdMultiplier, closePrice) Calculate deviation threshold for identifying major swings.
Parameters:
tresholdMultiplier : Usefull to equilibrate the calculate.
closePrice : Close price of the chart wanted.
Returns: The deviation threshold.
calcDev(basePrice, price) Custom function for calculating price deviation for validating large moves.
Parameters:
basePrice : The reference price.
price : The price tested.
Returns: The deviation.
pivotFoundWithLines(dev, isHigh, index, price, dev_threshold, isHighLast, pLast, iLast, lineLast) Detecting pivots that meet our deviation criteria.
Parameters:
dev : The deviation wanted.
isHigh : The type of pivot tested (high or low).
index : The Index of the pivot tested.
price : The chart price wanted.
dev_threshold : The deviation treshold.
isHighLast : The type of last pivot.
pLast : The pivot price last.
iLast : Index of the last pivot.
lineLast : The lst line.
Returns: The Line and bool is pivot High.
getDeviationPivots(thresholdMultiplier, depth, lineLast, isHighLast, iLast, pLast, deleteLines, closePrice, highPrice, lowPrice) Get pivot that meet our deviation criteria.
Parameters:
thresholdMultiplier : The treshold multiplier.
depth : The depth to calculate pivot.
lineLast : The last line.
isHighLast : The type of last pivot
iLast : Index of the last pivot.
pLast : The pivot price last.
deleteLines : If the line are draw or not.
closePrice : The chart close price.
highPrice : The chart high price.
lowPrice : The chart low price.
Returns: All pivot the informations.
getElIntArrayFromEnd() Get the last element of an int array.
getElFloatArrayFromEnd() Get the last element of an float array.
getElBoolArrayFromEnd() Get the last element of a bool array.
isTrendContinuation(isTrendUp, arrayBounds, lastPrice, precision) Check if last price is between bounds array.
Parameters:
isTrendUp : Is actual trend up.
arrayBounds : The trend array.
lastPrice : The pivot Price that just be found.
precision : The percent we add to actual bounds to validate a move.
Returns: na if price is between bounds, true if continuation, false if not.
getTrendPivots(trendBarIndexes, trendPrices, trendPricesIsHigh, interBarIndexes, interPrices, interPricesIsHigh, isTrendHesitate, isTrendUp, trendPrecision, pLast, iLast, isHighLast) Function to update array and trend related to pivot trend interpretation.
Parameters:
trendBarIndexes : The array trend bar index.
trendPrices : The array trend price.
trendPricesIsHigh : The array trend is high.
interBarIndexes : The array inter bar index.
interPrices : The array inter price.
interPricesIsHigh : The array inter ishigh.
isTrendHesitate : The actual status of is trend hesitate.
isTrendUp : The actual status of is trend up.
trendPrecision : The var precision to add in "iscontinuation" function.
pLast : The last pivot price.
iLast : The last pivot bar index.
isHighLast : The last pivot "isHigh".
Returns: trend & inter arrays, is trend hesitate, is trend up.
drawBoundLines(startIndex, startPrice, endIndex, endPrice, breakingPivotIndex, breakingPivotPrice, isTrendUp) Draw bounds and breaking line of the trend.
Parameters:
startIndex : Index of the first bound line.
startPrice : Price of first bound line.
endIndex : Index of second bound line.
endPrice : price of second bound line.
breakingPivotIndex : The breaking line index.
breakingPivotPrice : The breaking line price.
isTrendUp : The actual status of the trend.
Returns: The lines bounds and breaking line.

PivotThis library was designed to create three different datasets using Bill Williams fractals. The goal is to spot trends in reversal data and ultimately use these datasets to help predict future price reversals.
First, the pivot() function is used to initialize and populate three separate arrays (high pivot , low pivot , all pivots ). Since each high/low price depends on the bar_index, the bar_index, pivot direction(high/low), and high/low values are compressed into a string to maintain the data's integrity ("__"). Once each string array is populated and organized by bar_index, all three are returned inside a tuple. The return value must be deconstructed H,L,A =pivot() for each array's values to be accessed using getPivot() . This boilerplate allows for data to be accessed more efficiently in a recursive environment. getPivot() was designed to be used inside of a for or while block to populate matrices for further analyses. Again, getPivot() return values must be exposed through deconstruction. x,d,y =getPivot(). See code for more details.
pivot(int XLR) initializes and populates arrays
Parameters
XLR - number of bars to the left and right that must be lower for a high to be considered a pivotHigh, or vice versa. This number will drastically change the size and scope of the returned datasets. smaller values will produce much larger datasets, which might model short term price activity well. In contrast, larger values will produce smaller datasets which might model longer term price activity well.
Returns - tuple [string ]
getPivot(string arrayID, int index) accesses array data
Parameters
arrayID - the variable name for one of the three arrays returned by pivot().
index - the index of the provided array, with 0 being the most recent pivot point. can be set to " i " in a loop to access values recursively
Returns - tuple

OscillatorPivotsLibrary "OscillatorPivots"
Measures pivots in an oscillator and flags if they are above a configurable size. Uses absolute size rather than just highest/lowest in a candle range.
f_osc_Pivots()
Uses the total change in the Y axis, instead of a simple Williams pivot over a defined number of bars. In other words, it measures the size of the actual pivot, not just whether it happens to be the highest/lowest value in a range.
Measures the absolute, cumulative change both before and after the pivot, to avoid flagging mere kinks in trends.
The advantage is that absolute pivot size is, in some cases, precisely what we care about. A disadvantage is that it can take an arbitrary, perhaps long, time to confirm.
You can configure the threshold size of the pivot so that it finds large or small pivots.
Always returns a pivot high after a pivot low, then another pivot high and so on, in order. It never returns a high followed by a high, which simple indicators based on the ta.pivot() function can do.
@param chart_H_1 This must always be set to 1, unless you are using my HighTimeframeTiming library, in which case set it to the output of the function for a _HTF_H of 1.
@param chart_H_2 This must always be set to 2, unless you are using my HighTimeframeTiming library, in which case set it to the output of the function for a _HTF_H of 2.
@param _osc This is the oscillator float value.
@param _oscPivotSize This is the user setting for what counts as a big enough change to be a pivot.
@returns Information about the pivot that is likely to be useful in further calculations:
confirmPeak, confirmDip - whether the pivot was confirmed this bar
peakBarsBack, dipBarsBack - how many bars ago the actual peak or dip was
peakPrice, dipPrice - the value of the oscillator at the peak/dip
It also returns some internal variables, which are plotted in this library only for an understanding of how the function works.
debug_peakStartLevel, debug_dipStartLevel - The level of the currently active peak/dip

Pivots libraryLibrary "Pivots"
TODO: add library description here
pivots(_type, _open, _high, _low, _clsoe) Calculates the pivot point and returns its value.
Parameters:
_type : Specifies the type of pivot point.
_open : The open price
_high : The high price
_low : The low price
_clsoe : The close price
Returns: Returns the value of the calculated pivot point as a tuple.
cpr(_high, _low, _clsoe) Calculate the Central Pivot Range
Parameters:
_high : The high price
_low : The low price
_clsoe : The close price
Returns: Returns the values as a tuple.
htf_ohlc(_htf) Calculate the HTF values
Parameters:
_htf : Resolution
Returns: Returns the values as a tuple.
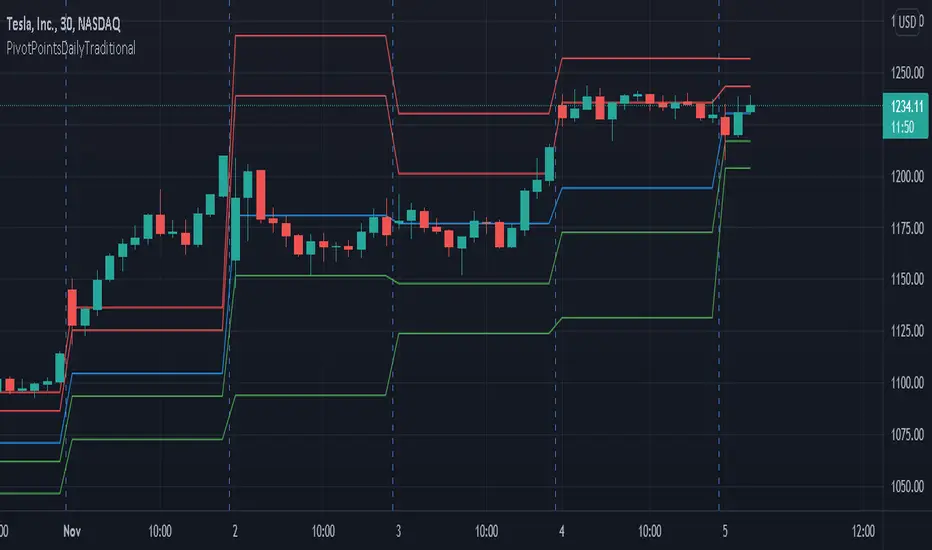
PivotPointsDailyTraditionalLibrary "PivotPointsDailyTraditional"
Provides the traditional daily pivot values and a pivot vacinity function.
P(level, daysPrior) Returns the P value.
Parameters:
level : The level to caclulate.
daysPrior : The number of days in the past to do the calculation.
R(level, daysPrior) Calculates the R value for a given pivot level.
Parameters:
level : The level to caclulate.
daysPrior : The number of days in the past to do the calculation.
S(level, daysPrior) Calculates the S value for a given pivot level.
Parameters:
level : The level to caclulate.
daysPrior : The number of days in the past to do the calculation.
vacinity(value, daysPrior, maxLevel) Returns a value representing where the provided value is in relation to each pivot level.
Parameters:
value : The value to compare against.
daysPrior : The number of days in the past to do the calculation.
maxLevel : The maximum number of pivot levels to include.