Pivot

price Degree on gann master chartThis indicator calculates price degree on gann' s master chart. it will plot degree of open (red stepline), close(green stepline), high(white cross), low(red cross).
I request, only people who know how to use gann master chart and degrees of price use this. no one made this indicator till now. It is highly potential tool for gann gann fans.
happy trading!
comment if you like.
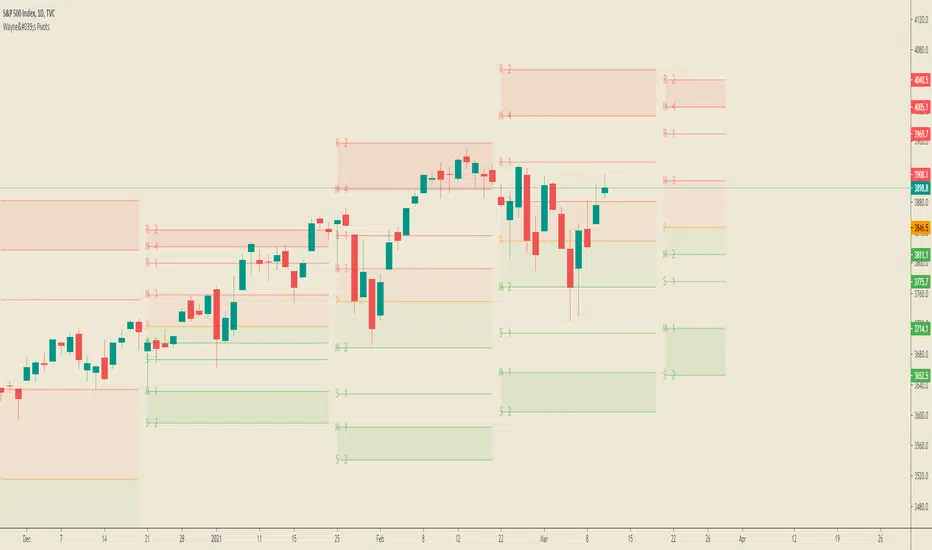
Pivot Points with Monthly and Weekly optionsA pivot point indicator that has possibility to see even the monthly or the weekly pivot points .
Pivot points are very powerful if used in correct way.
most of the time the price can be rejected from the pivot point or if the price break it it will be a nice entry if retest the pivot
R2/S2 are a very strong pivots to break but of course you need a certain distance between the pivot

RVC-Trade-With-Pivot-LevelsHow to Use PIVOT Levels for Trading
Always remember ->: *Trade with trend*
About script:
1. Daily and Weekly close above Pivot Level.
-- Sentiment is highly positive. Pivot Level acts as strong support.
2. Daily Close above Pivot and Weekly Close Below Pivot
-- Sentiment is positive.Weekly Pivot Level may act as strong resistance.
3. Daily close below Pivot and weekly close above Pivot
-- Sentiment is negative but weekly Pivot Level can acts as strong support.
4. Daily and Weekly Close below Pivot Level
-- Sentiment is highly Negative. Pivot Level acts as strong resistance.
BUY/SELL -- ENTRY
BUY ABOVE 23.6% UPWARD
IF Trend is positive and price cross and sustains above 23.6%(R1) upside, then it will be entry from BUY perspective.
If R1 is entry, R2/R3/R4/R5 ... will be targets.
SELL Below 23.6% Downward
IF Trend is negative and price cross and sustains below 23.6%(S1) downside, then it will be entry from SELL perspective.
If S1 is Sell side entry, S2/S3/S4/S5 will be targets.
Before taking ENTRY on BUY or SELL Side, please know your risk levels, Stop Loss and trade EXECUTION process.
Finally:
My view is my view and remains with me only. Once you accept it and trade it, it becomes your view. So credit or blame all yours.:)

Montly Pivot Points indicatorA pivot point indicator that has possibility to see even the monthly or the weekly pivot points.
Pivot points are very powerful if used in correct way.
most of the time the price can be rejected from the pivot point or if the price break it it will be a nice entry if retest the pivot
R2/S2 are a very strong pivots to break but of course you need a certain distance between the pivot.

Smoothed Pivot Reversal Alerts [QuantNomad]This is study with alerts for my "Smoothed Pivot Reversal Strategy". Strategy script is open to the public so you can use it freely.
When creating alerts - choose "Once Per Bar Close"
It's a pro indicator, you can have access to it for a small fee. Link to my PRO indicators you can find in my signature.

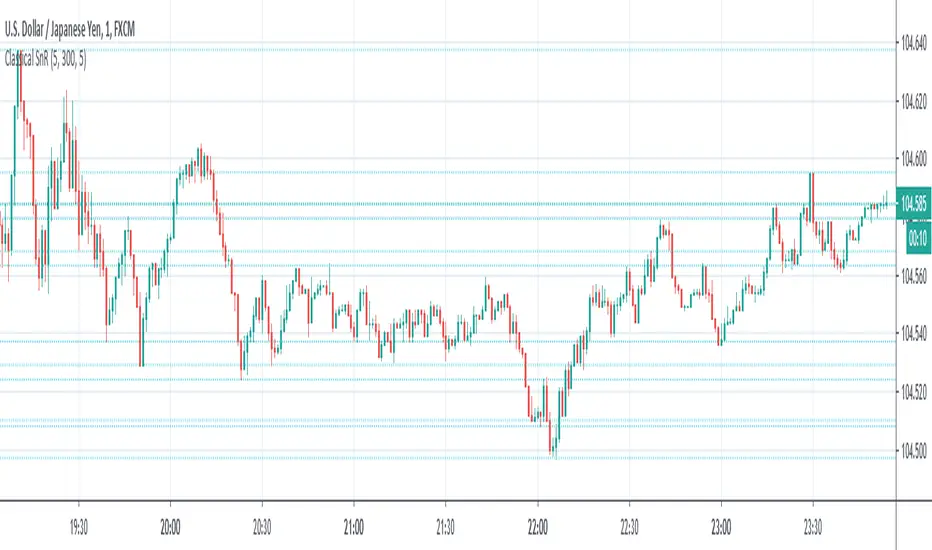
Classical Supports & ResistancesThis indicator shows classical resistance and support levels which retraced the chart lately. Notice that the condensed lines laying close together are showing an area of support and/or resistance.
But after all, it was a tedious work creating this indicator because like I've already said, pine script is a very odd and weak language which does not have many ordinary features like useful loops, simple line drawing and even reasonable variable casting!
So I was forced to use its built-in pivothigh() and pivotlow() functions without any handy documentation. I assume that even these functions don't work as expected, and because of that, I embedded "Sensitivity" and "Lookback Time" options in the indicator as a workaround.
Feel free to use it and send me your comments/solutions.
Pivot LinesThis indicator provides possible short, medium, and long-term support and resistance levels based on recent highs and lows. The furthest the level is, the thicker its line is, making it easy to spot stronger levels where 2 lines overlap. It can be configured to use open/close values instead of high/low for tighter levels.
Default settings:
- Short Period: 20
- Medium Period: 50
- Long Period: 100
This script also provides alerts for when the price crosses over/under a given level or pulls back.
Note: It sometimes displays supports above the price and resistances below it, I still have to figure out why (and fix it if possible), but it's still useful.

GODMODE PivotsGODMODE PIVOTS
******************************************************
Note : Read below before you use on live trading accounts and test on paper trading until you get used to of it
*** This script does not provide end to end signals like buy here and sell there ***
* I personally use this trading system for my trades so i have converted all of it into one script
* I got used to with these ema's and been using it from long time ago
* Take trades on your own risk
*******************************************************
# Script Signals :
* Pivot points for take profits
* UT ( up trend indication )
* DT ( down trend indication )
* Small triangles ( red ,green for continuation )
* Bar colors ( for overbought and oversold )
* 3 EMA's ( for support and resistance )
# how to use :
++++ made to use on 30 min and 1 hr time frame only ++++
* Ema's for support and resistance
* long after "UT" green signal
* short after "DT" red signal
* "Piv" labels (pivot points) for take profits
Piv red = take profits on longs
Piv green = take profits on shorts
* Small triangles shows continuation signals
green for up trend
red for downtrend
* Bar colors shows over sold and overbought price
Green and blue is for oversold price
Red and Orange is for overbought price
When these bar colors occurs i consider closing full position
* Use Ema's for stop placements
**look at the chart for reference
Dm for access
Thanks

DanielTools Pivot with momentum [ DN_PivotM ]This indicator shows pivot with momentum and signals which tell you when trend changed.
especially you could use pivot term like 1D(a day), 1W(a week), 720(12 hours), same with time period which trading view.
このインジケーターはピボットとモメンタムを描きます。またトレンドが変化した際にシグナルを描くこともできます。

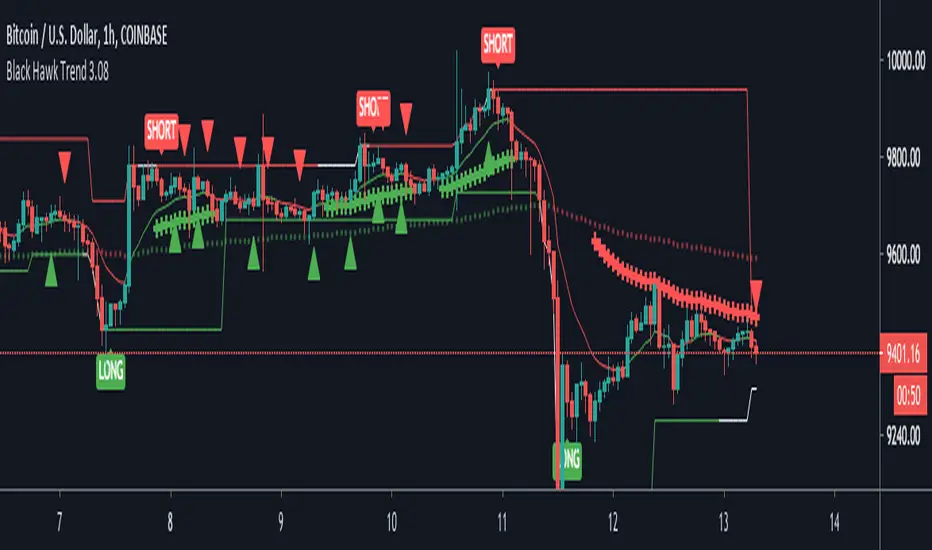
Black Hawk Trend 3The Black Hawk Trend indicator uses data from sources (such as EMAs, RSI, Stochs) to derive a trend direction. This indicator contains a pivot line that turns green when there is a buy position (lower bar) and it turns red when there is an active sell position (upper bar).
When there is a buy/sell signal, this does not mean buy immediately at this point, but rather look for a potential entry.
This indicator has the ability to treat buy and sells separately (Default: 2 account method) or it can use them in tandem (1 account method).
There is a toggle in the settings to modify the code for Bitcoin vs Forex (& Stocks).
When there is a strong trend, a red/green “+” sign shows up; this typically means take caution when trying to take a position countertrend.
There are also red/green triangles that signify a potential area to add to a position.
#Disclaimer:
1. I am not a financial advisor.
2. I do not guarantee this script will provide consistent profits or that anyone can make money with it.
Use the link below to obtain access to this indicator.
Fractals | Swing Points | Highs & Lows | Custom PeriodsSimple script which marks out key swing highs & lows.
One of the only indicators I have on the chart most days
- perfect for naked charting
- quickly helps you to visually identify key areas of interest
An extension of Bill Williams fractals
- aka short term swing points
Allows you to filter for only the most prominent swing points
- you can even overlay multiple swingpoint filters in different colours (as per example chart)
The number ( Fractal Periods) is simply:
- the number of less prominent points either side of your swing high/low
- example shown on the chart
Otherwise make a fist
- look at your 5 knuckles
- swing high is your middle knuckle
- 2 lower points either side
Bill Williams Original Fractal:
Fractal Periods = 2
Your Fractal Period for Filtering:
3, 4, 5, 30, 365, etc
Allows you to find swing points down to:
Fractal Periods = 1
Simple, easy, shared to enjoy =)

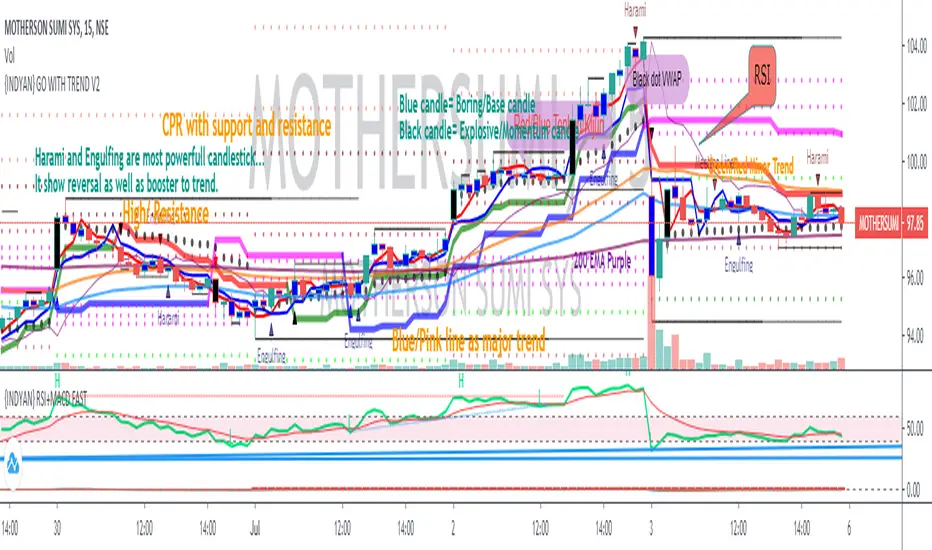
{INDYAN} GO WITH TREND V2This indicator has almost everything for intraday trading . There are two supertrends one with higher time frame and one at lower time frame, Due to which we can recognize reversal. If higher time frame supertrend is showing uptrend and minor is showing downtrend then better to avoid taking any trade in between. Both trend should be in same direction.
Tenkan and kijun is there to verify the trend authencity, check where the tenkan and kijun crossover is there or not at the time of reversal signal given by supertrends. It will boost trading chances.
Also VWAP is placed to know the current situation, If price is below VWAP go for sort if all other things match as above said.
HEMA LEMA is a EMA band and i found that it act as support and resistance, If price breaks channel with volume and sustain above/below for 2 candle close (TIMEFRAME AS SYMBOL).
Also placed FAST EMA to recognize the fast moving trend.
Pivot with CPR is there to trade on basis of CPR and Pivot.
For demand and supply traders, they can use blue and black candle for marking up zones. Blue is boring/base candle and Black is explosive candle.
I hope it will help my trader friends to recognize the trend and reversal.
Let me know if anything more we need to include or remove to make it better for everyone.
Happy Trading... Love INDYAN
#intraday
#hema-lema
#pivot
#cpr
#supertrend_reversal
#demandzone
#supplyzone
#tenkansen
#kijunsen
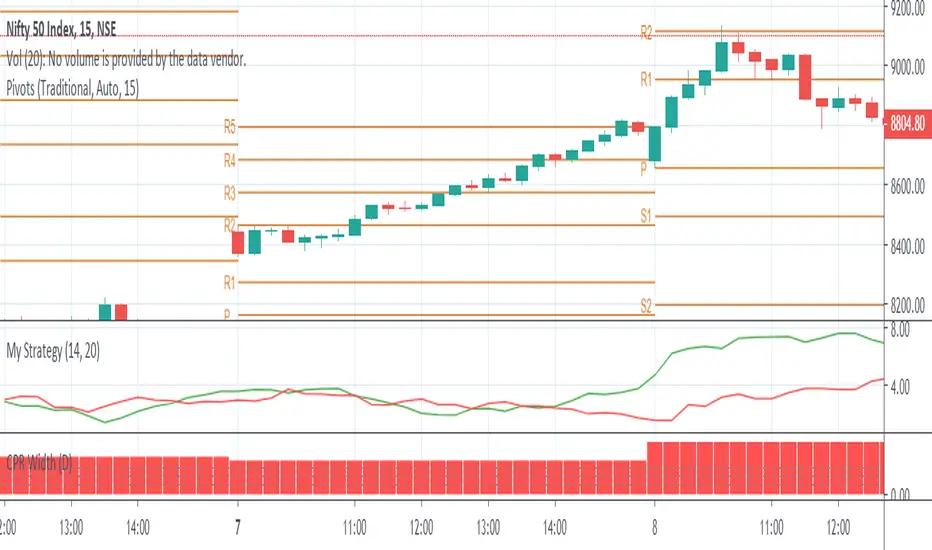
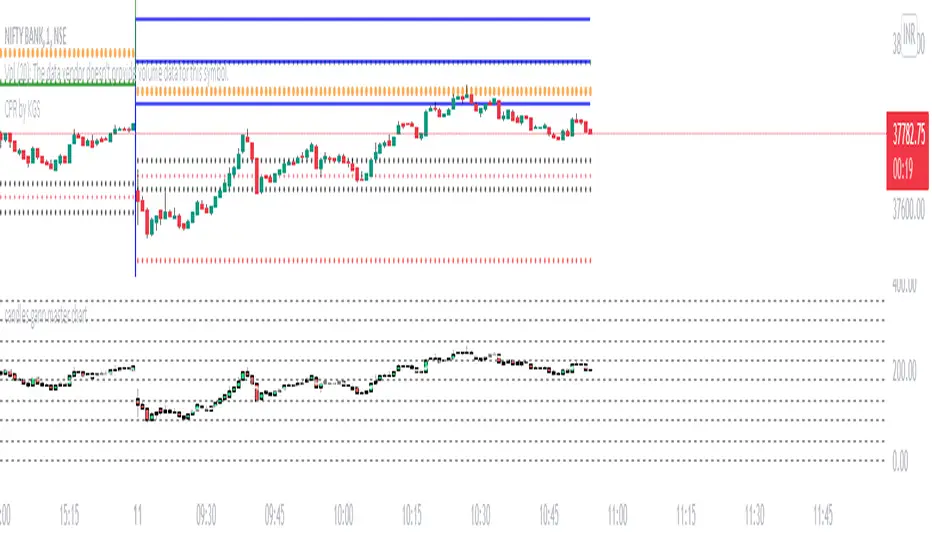
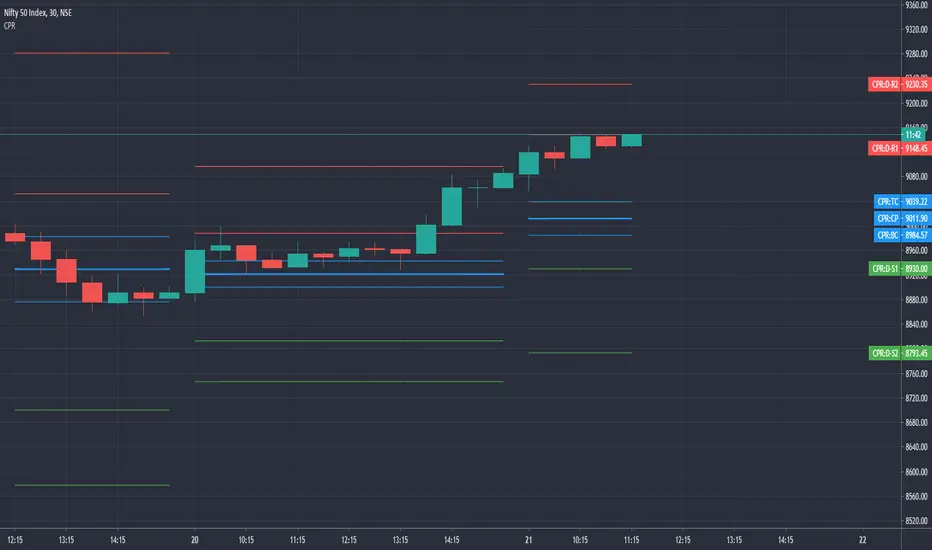
CPR by GuruprasadMeduriThis script will allow to add CPR with Standard Pivot ad 9 levels of support and 9 levels of resistance lines. It has CPR, 3 levels of Day-wise pivots, 3 levels of Weekly pivots and 3 Levels of Monthly Pivots. All the Support and resistance levels can be enabled / disabled from settings. It will allow to select multiple combinations of support and resistance levels across 3 levels at any of the 3 time-frames individually and combined.
These number of combinations will allow user to visualize the charts with desired pivot support & resistance levels on all or any of the 3 time frames.
For Ease of access, listed few points on how the script works..
- CPR and day-wise level 1 & 2 (S1, R1, S2 R2) enabled by default and can be changed from settings
- Day-wise Level 3 (S3 & L3) can be enabled from settings
- Weekly 3 levels and Monthly 3 levels can be enabled from settings
- CPR & pivot levels colored in blue lines
- All support levels colored in Green
- All resistance levels Colored in Red
- Day-wise pivot, support & resistance are straight lines
- Weekly pivot, support & resistance are cross (+) lines
- Weekly pivot, support & resistance are circle (o) lines
- Any combinations can be selected from stettings-> Inputs & style
// - This is an iterative development. Will add more features due course of time. Suggestions are always welcomed!!
PRP - Pivot Reversal + PSAR Alerts [QuantNomad]This is study with alerts for my "PRP - Pivot Reversal + PSAR Strategy".
When creating alerts - choose "Once Per Bar Close"
It's a pro indicator, you can have access to it for a small fee. Link to my PRO indicators you can find in my signature.

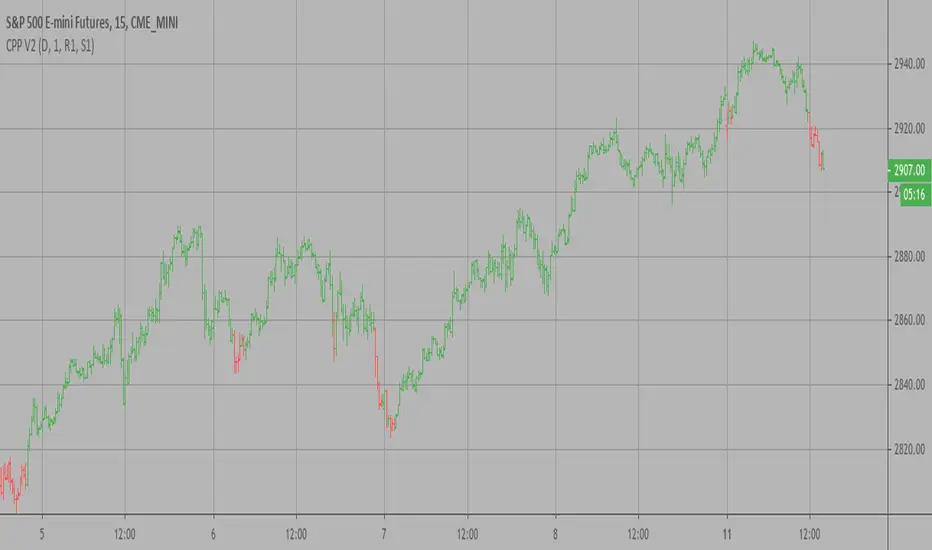
Camarilla Pivot Points V2 Strategy Camarilla pivot point formula is the refined form of existing classic pivot point formula.
The Camarilla method was developed by Nick Stott who was a very successful bond trader.
What makes it better is the use of Fibonacci numbers in calculation of levels.
Camarilla equations are used to calculate intraday support and resistance levels using
the previous days volatility spread. Camarilla equations take previous day’s high, low and
close as input and generates 8 levels of intraday support and resistance based on pivot points.
There are 4 levels above pivot point and 4 levels below pivot points. The most important levels
are L3 L4 and H3 H4. H3 and L3 are the levels to go against the trend with stop loss around H4 or L4 .
While L4 and H4 are considered as breakout levels when these levels are breached its time to
trade with the trend.
WARNING:
- For purpose educate only
- This script to change bars colors.
Zig Zag High LowZig Zag script that uses local minimums and maximums as pivot points. It can be used as a source for pattern recognition.

Future PivotNormaly Pivot is calculate from the last candle.
Future Pivot is calculate from the running candle.
The Future Pivot Indicator is usefull at the end of a period (11pm, Sundays, and end of the month)
Have Fun
Please do not Copy&Paste, use this Link
Have Fun


Fibonacci Pivot PointsI have included the main support and resistance pivot point levels for the Fibonacci Pivot Points. I changed the bar colors to reflect buy and sell points so if a bar is green then that means to buy it and if it is red then sell it
Let me know if you would like to see me do any other indicators!

IndianPivotBossPEMAPivot EMA with color codes indication the possible direction of the market.
Also added prefix to the name of the indicator for easy identification of my indicators.
Upward sloping bands indicate uptrend and Downward sloping band indicates downtrend.
Upward sloping and downward sloping are differentiated using color codes for easy visual identification.

Rokcet BB GeneratorHello Traders!
The indicator uses RSI levels and normal floor trader pivots to find exit and entry points.
In the indicator options you can choose the indicator from pull-down menu.
How it works?
- Checks if two consecutive candles are bullish/bearish.
- Looks for RSI oversold /overbought conditions.
- Initates a buy /sellorder .
- Stop loss can be places under the low/high of the candle before the trigger candle for long and short orders respectively.
- targets can be daily pivot points
P.S. Use it on a 5 min candle chart for best results.