DCA Price LevelsThe indicator is used to set price targets in the chart on the basis of waste.
Whenever the price falls from the current DCA price to minus 30 percent, a new price target is set.
There are a total of 10 price targets, so a drop of up to minus 71 percent is covered by the default setting.
The number of price targets can be set individually, up to a maximum of 10, and the percentages can also be changed.
ניהול פורטפוליו

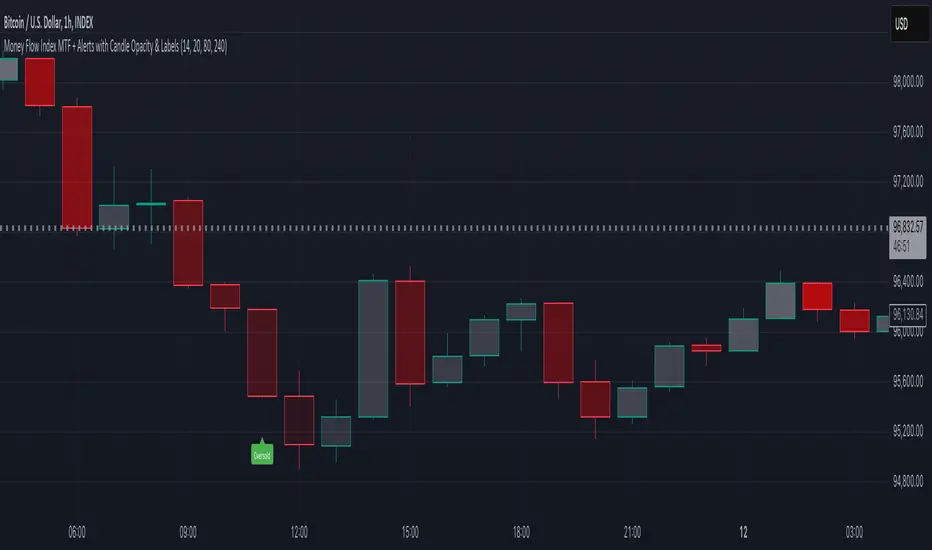
Money Flow Index MTF + Alerts with Candle Opacity & LabelsHow to Use the Money Flow Index MTF + Alerts with Candle Opacity & Labels Indicator
Overview:
This indicator is designed to help you gauge the buying and selling pressure in a market by using the Money Flow Index (MFI). Unlike many momentum oscillators, the MFI incorporates both price and volume, providing a unique perspective on market activity. It is particularly useful when you want to visually assess potential overbought or oversold conditions.
Indicator Components:
Money Flow Index (MFI) Calculation:
The indicator computes the MFI using a user-defined look-back period (default is 14 bars). The MFI is scaled between 0 and 100, where values above 80 typically indicate overbought conditions and values below 20 suggest oversold conditions.
Multi-Timeframe (MTF) Capability:
You can choose to calculate the MFI using either the current chart’s timeframe or a custom timeframe (for example, a 4-hour chart). This flexibility allows you to compare longer-term money flow trends against your primary trading timeframe.
Candle Opacity Based on MFI:
The opacity of the candles on your chart is dynamically adjusted based on the current MFI reading. When the MFI is high (near 100), candles become more opaque; when the MFI is low (near 0), candles appear more transparent. This visual cue can help you quickly spot changes in market momentum.
Visual Labels for Overbought/Oversold Conditions:
When the MFI crosses into the overbought territory, a red label reading “Overbought” is displayed above the high of the bar. Similarly, when it crosses into the oversold territory, a green label reading “Oversold” is placed below the low of the bar. These labels provide an immediate visual alert to potential reversal points or areas of caution.
Alert Conditions:
The script also includes alert conditions for both overbought and oversold signals. You can set up TradingView alerts so that you are notified in real time when the indicator detects these conditions.
Theory Behind the Money Flow Index (MFI):
The Money Flow Index is a momentum oscillator that uses both price and volume to signal the strength behind price moves.
Overbought Conditions: When the MFI is above 80, it suggests that buying pressure is very strong and the asset might be due for a pullback or consolidation.
Oversold Conditions: Conversely, when the MFI falls below 20, selling pressure is high and the asset might be oversold, potentially priming it for a bounce.
Keep in mind that in strong trending markets, overbought or oversold readings can persist for extended periods, so the MFI should be used in conjunction with other technical analysis tools.
Position Management Guidance:
While the indicator is useful for spotting potential overbought and oversold conditions, it is not designed to serve as an automatic signal to completely close a position. Instead, you might consider using it as a guide for pyramiding—gradually adding to your position over several days rather than exiting all at once. This approach allows you to better manage risk by:
Scaling In or Out Gradually: Instead of making one large position change, you can add or reduce your position in increments as market conditions evolve.
Diversifying Risk: Pyramiding helps you avoid the pitfalls of trying to time the market perfectly on a single trade exit or entry.
How to Get Started:
Apply the Indicator:
Add the indicator to your TradingView chart. Adjust the input settings (length, oversold/overbought levels, and resolution) as needed for your trading style and the market you’re analyzing.
Watch the Candles:
Observe the dynamic opacity of your candles. A sudden change in opacity can be a sign that the underlying money flow is shifting.
Monitor the Labels:
Pay attention to the “Overbought” or “Oversold” labels that appear. Use these cues in combination with your broader analysis to decide if it might be a good time to add to or gradually exit your position.
Set Up Alerts:
Configure TradingView alerts based on the indicator’s alert conditions so that you are notified when the MFI reaches extreme levels.
Use as Part of a Broader Strategy:
Remember, no single indicator should dictate your entire trading decision. Combine MFI signals with other technical analysis, risk management rules, and market insights to guide your trades.
Price Action Trend and Margin EquityThe Price Action Trend and Margin Equity indicator is a multifunctional market analysis tool that combines elements of money management and price pattern analysis. The indicator helps traders identify key price action patterns and determine optimal entry, exit and stop loss levels based on the current trend.
The main components of the indicator:
Money Management:
Allows the trader to set risk management parameters such as the percentage of possible loss on the position, the use of fixed leverage and the total capital.
Calculates the required leverage level to achieve a specified percentage of loss.
Price Action:
Correctly identifies various price patterns such as Pin Bar, Engulfing Bar, PPR Bar and Inside Bar.
Displays these patterns on the chart with the ability to customize candle colors and display styles.
Allows the trader to customize take profit and stop loss points to display them on the chart.
The ability to display patterns only in the direction of the trend.
Trend: (some code taken from ChartPrime)
Uses a trend cloud to visualize the current market direction.
The trend cloud is displayed on the chart and helps traders determine whether the market is in an uptrend or a downtrend.
Alert:
Allows you to set an alert that will be triggered when the pattern is formed.
Example of use:
Let's say a trader uses the indicator to trade the crypto market. He sets the money management parameters, setting the maximum loss per position to 5% and using a fixed leverage of 1:100. The indicator automatically calculates the required position size to meet these parameters ($: on the label). Or displays the leverage (X: on the label) to achieve the required risk.
The trader receives an alert when a Pin Bar is formed. The indicator displays the entry, exit, and stop loss levels based on this pattern. The trader opens a position for the recommended amount in the direction indicated by the indicator and sets the stop loss and take profit at the recommended levels.
General Settings:
Position Loss Percentage: Sets the maximum loss percentage you are willing to take on a single position.
Use Fixed Leverage: Enables or disables the use of fixed leverage.
Fixed Leverage: Sets the fixed leverage level.
Total Equity: Specifies the total equity you are using for trading. (Required for calculation when using fixed leverage)
Turn Patterns On/Off: You can turn on or off the display of various price patterns such as Pin Bar, Outside Bar (Engulfing), Inside Bar, and PPR Bar.
Pattern Colors: Sets the colors for displaying each pattern on the chart.
Candle Color: Allows you to set a neutral color for candles that do not match the price action.
Show Lines: Allows you to turn on or off the display of labels and lines.
Line Length: Sets the length of the stop, entry, and take profit lines.
Label color: One color for all labels (configured below) or the color of the labels in the color of the candle pattern.
Pin entry: Select the entry point for the pin bar: candle head, bar close, or 50% of the candle.
Coefficients for stop and take lines.
Use trend for price action: When enabled, will show price action signals only in the direction of the trend.
Display trend cloud: Enables or disables the display of the trend cloud.
Cloud calculation period: Sets the period for which the maximum and minimum values for the cloud are calculated. The longer the period, the smoother the cloud will be.
Cloud colors: Sets the colors for uptrends and downtrends, as well as the transparency of the cloud.
The logic of the indicator:
Pin Bar is a candle with a long upper or lower shadow and a short body.
Logic: If the length of one shadow is twice the body and the opposite shadow of the candle, it is considered a Pin Bar.
An Inside Bar is a candle that is completely engulfed by the previous candle.
Logic: If the high and low of the current candle are inside the previous candle, it is an Inside Bar.
An Outside Bar or Engulfing is a candle that completely engulfs the previous candle.
Logic: If the high and low of the current candle are outside the previous candle and close outside the previous candle, it is an Outside Bar.
A PPR Bar is a candle that closes above or below the previous candle.
Logic: If the current candle closes above the high of the previous candle or below its low, it is a PPR Bar.
Stop Loss Levels: Calculated based on the specified ratios. If set to 1.0, it shows the correct stop for the pattern by pushing away from the entry point.
Take Profit Levels: Calculated based on the specified ratios.
Create a Label: The label is created at the stop loss level and contains information about the potential leverage and loss.
The formula for calculating the $ value is:
=(Total Capital x (Maximum Loss Percentage on Position/100)) / (Difference between Entry Level and Stop Loss Level × Ratio that sets the stop loss level relative to the length of the candlestick shadow × Fixed Leverage Value) .
Labels contain the following information:
The percentage of price change from the recommended entry point to the stop loss level.
Required Leverage (X: ): The amount of leverage required to achieve the specified loss percentage. (Or a fixed value if selected).
Required Capital ($: ): The amount of capital required to open a position with the specified leverage and loss percentage (only displayed when using fixed leverage).
The trend cloud identifies the maximum and minimum price values for the specified period.
The cloud value is set depending on whether the current price is equal to the high or low values.
If the current closing price is equal to the high value, the cloud is set at the low value, and vice versa.
RU
Индикатор "Price Action Trend and Margin Equity" представляет собой многофункциональный инструмент для анализа рынка, объединяющий в себе элементы управления капиталом и анализа ценовых паттернов. Индикатор помогает трейдерам идентифицировать ключевые прайс экшн паттерны и определять оптимальные уровни входа, выхода и стоп-лосс на основе текущего тренда.
Основные компоненты индикатора:
Управление капиталом:
Позволяет трейдеру задавать параметры управления рисками, такие как процент возможного убытка по позиции, использование фиксированного плеча и общий капитал.
Рассчитывает необходимый уровень плеча для достижения заданного процента убытка.
Price Action:
Правильно идентифицирует различные ценовые паттерны, такие как Pin Bar, Поглащение Бар, PPR Bar и Внутренний Бар.
Отображает эти паттерны на графике с возможностью настройки цветов свечей и стилей отображения.
Позволяет трейдеру настраивать точки тейк профита и стоп лосса для отображения их на графике.
Возможность отображения паттернов только в натправлении тренда.
Trend: (часть кода взята у ChartPrime)
Использует облако тренда для визуализации текущего направления рынка.
Облако тренда отображается на графике и помогает трейдерам определить, находится ли рынок в восходящем или нисходящем тренде.
Оповещение:
Дает возможность установить оповещение которое будет срабатывать при формировании паттерна.
Пример применения:
Предположим, трейдер использует индикатор для торговли на крипто рынке. Он настраивает параметры управления капиталом, устанавливая максимальный убыток по позиции в 5% и используя фиксированное плечо 1:100. Индикатор автоматически рассчитывает необходимый объем позиции для соблюдения этих параметров ($: на лейбле). Или отображает плечо (Х: на лейбле) для достижения необходимого риска.
Трейдер получает оповещение о формировании Pin Bar. Индикатор отображает уровни входа, выхода и стоп-лосс, основанные на этом паттерне. Трейдер открывает позицию на рекомендуемую сумму в направлении, указанном индикатором, и устанавливает стоп-лосс и тейк-профит на рекомендованных уровнях.
Общие настройки:
Процент убытка по позиции: Устанавливает максимальный процент убытка, который вы готовы понести по одной позиции.
Использовать фиксированное плечо: Включает или отключает использование фиксированного плеча.
Уровень фиксированного плеча: Задает уровень фиксированного плеча.
Общий капитал: Указывает общий капитал, который вы используете для торговли. (Необходим для расчета при использовании фиксированного плеча)
Включение/отключение паттернов: Вы можете включить или отключить отображение различных ценовых паттернов, таких как Pin Bar, Outside Bar (Поглощение), Inside Bar и PPR Bar.
Цвета паттернов: Задает цвета для отображения каждого паттерна на графике.
Цвет свечей: Позволяет задать нейтральный цвет для свечей неподходящих под прйс экшн.
Показывать линии: Позволяет включить или отключить отображение лейблов и линий.
Длинна линий: Настройка длинны линий стопа, линии входа и тейк профита.
Цвет лейбла: Один цвет для всех лейблов (настраивается ниже) или цвет лейблов в цвет паттерна свечи.
Вход в пин: Выбор точки входа для пин бара: голова свечи, точка закрытия бара или 50% свечи.
Коэффиценты для стоп и тейк линий.
Использовать тренд для прайс экшна: При включении будет показывать прайс экшн сигналы только в направлении тренда.
Отображение облака тренда: Включает или отключает отображение облака тренда.
Период расчета облака: Устанавливает период, за который рассчитываются максимальные и минимальные значения для облака. Чем больше период, тем более сглаженным будет облако.
Цвета облака: Задает цвета для восходящего и нисходящего трендов, а также прозрачность облака.
Логика работы индикатора:
Pin Bar — это свеча с длинной верхней или нижней тенью и коротким телом.
Логика: Если длина одной тени вдвое больше тела и противоположной тени свечи, считается, что это Pin Bar.
Inside Bar — это свеча, полностью поглощенная предыдущей свечой.
Логика: Если максимум и минимум текущей свечи находятся внутри предыдущей свечи, это Inside Bar.
Outside Bar или Поглощение — это свеча, которая полностью поглощает предыдущую свечу.
Логика: Если максимум и минимум текущей свечи выходят за пределы предыдущей свечи и закрывается за пределами предыдущей свечи, это Outside Bar.
PPR Bar — это свеча, которая закрывается выше или ниже предыдущей свечи.
Логика: Если текущая свеча закрывается выше максимума предыдущей свечи или ниже ее минимума, это PPR Bar.
Уровни стоп-лосс: Рассчитываются на основе заданных коэффициентов. При значении 1.0 показывает правильный стоп для паттерна отталкиваясь от точки входа.
Уровки тейк-профита: Рассчитываются на основе заданных коэффициентов.
Создание метки: Метка создается на уровне стоп-лосс и содержит информацию о потенциальном плече и убытке.
Формула для вычисления значения $:
=(Общий капитал x (Максимальный процент убытка по позиции/100)) / (Разница между уровнем входа и уровнем стоп-лосс × Коэффициент, задающий уровень стоп-лосс относительно длины тени свечи × Значение фиксированного плеча).
Метки содержат следующую информацию:
Процент изменения цены от рекомендованной точки входа до уровня стоп-лосс.
Необходимое плечо (Х: ): Уровень плеча, необходимый для достижения заданного процента убытка. (Или фиксированное значение если оно выбрано).
Необходимый капитал ($: ): Сумма капитала, необходимая для открытия позиции с заданным плечом и процентом убытка (отображается только при использовании фиксированного плеча).
Облако тренда определяет максимальные и минимальные значения цены за указанный период.
Значение облака устанавливается в зависимости от того, совпадает ли текущая цена с максимальными или минимальными значениями.
Если текущая цена закрытия равна максимальному значению, облако устанавливается на уровне минимального значения, и наоборот.

Broad Market MOEX non normalazeBroad Market MOEX - Relative Strength Indicator for MOEX Stocks
This indicator allows you to compare the price dynamics of major Moscow Exchange stocks relative to the selected asset during the trading session.
Features:
• Tracks 10 key MOEX stocks: Sberbank, Rosneft, Lukoil, Gazprom Neft, NOVATEK, Nornickel, Polyus, Tatneft, Surgutneftegas, Severstal
• Shows the percentage price change of each stock relative to the base price at the start of trading (default 9:00 MSK)
• Allows you to customize the base time for reference
• Clearly displays the strength and weakness of individual stocks relative to each other
• Helps identify leaders and laggards during the trading session
How to use:
1. Add the indicator to any MOEX stock chart
2. Adjust the base time if needed (default 9:00)
3. Monitor the relative dynamics of stocks
4. Use for:
- Finding strong/weak stocks
- Identifying sector rotation
- Intraday trading
- Correlation analysis
Color coding of lines helps easily identify each stock on the chart.
The indicator is useful for intraday traders and anyone monitoring the relative strength of stocks on the Moscow Exchange.

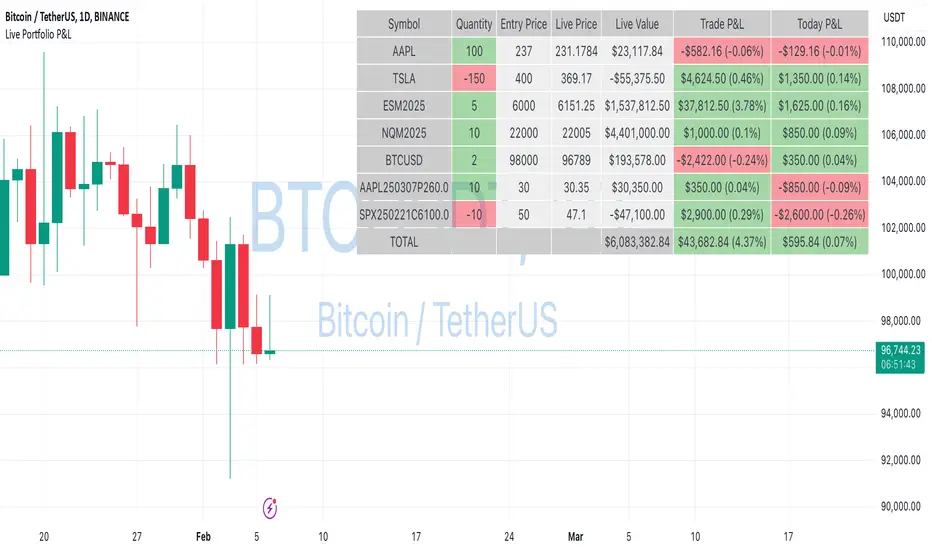
Live Portfolio P<his script calculates live P&L (Profit & Loss) for up to 40 instruments — stocks, ETFs, options, futures, and Forex pairs supported by TradingView. Instead of juggling numerous inputs, you paste your portfolio in CSV format into a single text field, and the script handles the rest. It parses each position and displays a comprehensive table showing the symbol, current price, position value, total P&L, and today’s P&L—all updated in real time.
Key Features
CSV Portfolio Input – Effortlessly import all your positions at once without filling in multiple fields. You can export the position from your broker, save it in the required format, and paste it into this script.
Supports Various Asset Classes – Works with any instrument that TradingView provides data for, including futures, options, and Forex.
Up to 40 Instruments – Track a broad and diverse set of holdings in one place.
Real-Time Updates – Get immediate feedback on live price changes, total value, and current P&L.
Today’s P&L – Monitor your daily performance to gauge short-term trends.
CSV is consumed in the following format:
Symbol (supported TradingView instruments)
Entry Price
Quantity (negative for short position)
Lot Size (for futures/options, it might not be one)
For example:
AAPL,237,100,1
TSLA,400,-150,1
ESM2025,6000,5,50
Planned Enhancements
Multi-Currency Support – Automatically convert and display your positions’ values in different currencies.
Advanced Metrics – Get deeper insights with calculations for drawdown, Sharpe ratio, and more.
Risk Management Tools – Set stop-loss and take-profit levels and receive alerts when thresholds are hit.
Option Greeks & Margin Calculations – Manage complex option strategies and track margin requirements.
Questions for You
What additional features would you like to see?
Are there any specific metrics or analytics you’d find especially valuable?
How might this script fit into your current trading workflow?
Feel free to share your thoughts and suggestions. Your feedback will help shape future updates and make this tool even more helpful for traders like you!
Disclaimer
Please remember that past performance may not be indicative of future results.
Due to various factors, including changing market conditions, the strategy may no longer perform as well as in historical backtesting.
This post and the script don’t provide any financial advice.
Position Tracker 1.0Position Tracker 1.0 allows users to input their position using USD, quantity, or a DCA approach while setting take profit (TP) and stop loss (SL) levels based on either fixed dollar values or percentages. The indicator provides optional markers for TP/SL crossings and an entry label showing key trade details. A live tracker can be enabled for real-time P&L updates, and all visual elements are customizable for clarity and preference.
Instructions for Position Tracker 1.0
1. Input Method & Position Details:
* Choose between USD, Quantity, or DCA.
* Enter your entry price, entry time, investment amount, or quantity as needed.
2. TP & SL Setup:
* For each TP (up to 5) and the SL, select whether to use a fixed dollar target or a percentage
target relative to your entry price.
* Enter the corresponding price (if using Dollar) or percentage (if using Percentage).
* For TPs, specify the percentage of your position to sell when the level is hit.
3. Marker & Display Options:
* Toggle the TP and SL crossing markers on or off.
* Adjust which details (Price, Diff, Sell for TP; Price, Diff, Loss for SL) are shown on the labels.
* The entry label always shows the Avg. Cost and can optionally include the quantity, invested
amount, and live tracker (real-time P&L).
4. Visual Customization:
* Change text size, marker size, and colors for profit, loss, TP, and SL lines as desired.

Binance Pseudo Funding FeeThe indicator calculates the Funding Fee for Binance based on the Premium Index provided by TradingView. The calculation formula can be found here: Binance Funding Rate Introduction . This is NOT the official rate visible on binance.com and used for settlements, but rather an estimated rate, which is inherently INACCURATE . The accuracy of the calculation heavily depends on the timeframe, with almost perfect results on minute-based timeframes.
For the most accurate calculations, you need to visit Binance Funding History and fill in the corresponding Interval , Interest Rate , and Funding Cap/Floor settings for the specific symbol in the indicator's settings. I understand this is not convenient, but for now, this is how it works.
The blue bars indicate the settlement time. Funding can be smoothed using moving averages. Both the funding rate and the moving averages are displayed using plot and are labeled, so you can set alerts on them.

Gold Pro StrategyHere’s the strategy description in a chat format:
---
**Gold (XAU/USD) Trend-Following Strategy**
This **trend-following strategy** is designed for trading gold (XAU/USD) by combining moving averages, MACD momentum indicators, and RSI filters to capture sustained trends while managing volatility risks. The strategy uses volatility-adjusted stops to protect gains and prevent overexposure during erratic price movements. The aim is to take advantage of trending markets by confirming momentum and ensuring entries are not made at extreme levels.
---
**Key Components**
1. **Trend Identification**
- **50 vs 200 EMA Crossover**
- **Bullish Trend:** 50 EMA crosses above 200 EMA, and the price closes above the 200 EMA
- **Bearish Trend:** 50 EMA crosses below 200 EMA, and the price closes below the 200 EMA
2. **Momentum Confirmation**
- **MACD (12,26,9)**
- **Buy Signal:** MACD line crosses above the signal line
- **Sell Signal:** MACD line crosses below the signal line
- **RSI (14 Period)**
- **Bullish Zone:** RSI between 50-70 to avoid overbought conditions
- **Bearish Zone:** RSI between 30-50 to avoid oversold conditions
3. **Entry Criteria**
- **Long Entry:** Bullish trend, MACD bullish crossover, and RSI between 50-70
- **Short Entry:** Bearish trend, MACD bearish crossover, and RSI between 30-50
4. **Exit & Risk Management**
- **ATR Trailing Stops (14 Period):**
- Initial Stop: 3x ATR from entry price
- Trailing Stop: Adjusts to lock in profits as price moves favorably
- **Position Sizing:** 100% of equity per trade (high-risk strategy)
---
**Key Logic Flow**
1. **Trend Filter:** Use the 50/200 EMA relationship to define the market's direction
2. **Momentum Confirmation:** Confirm trend momentum with MACD crossovers
3. **RSI Validation:** Ensure RSI is within non-extreme ranges before entering trades
4. **Volatility-Based Risk Management:** Use ATR stops to manage market volatility
---
**Visual Cues**
- **Blue Line:** 50 EMA
- **Red Line:** 200 EMA
- **Green Triangles:** Long entry signals
- **Red Triangles:** Short entry signals
---
**Strengths**
- **Clear Trend Focus:** Avoids counter-trend trades
- **RSI Filter:** Prevents entering overbought or oversold conditions
- **ATR Stops:** Adapts to gold’s inherent volatility
- **Simple Rules:** Easy to follow with minimal inputs
---
**Weaknesses & Risks**
- **Infrequent Signals:** 50/200 EMA crossovers are rare
- **Potential Missed Opportunities:** Strict RSI criteria may miss some valid trends
- **Aggressive Position Sizing:** 100% equity allocation can lead to large drawdowns
- **No Profit Targets:** Relies on trailing stops rather than defined exit targets
---
**Performance Profile**
| Metric | Expected Range |
|----------------------|---------------------|
| Annual Trades | 4-8 |
| Win Rate | 55-65% |
| Max Drawdown | 25-35% |
| Profit Factor | 1.8-2.5 |
---
**Optimization Recommendations**
1. **Increase Trade Frequency**
Adjust the EMAs to shorter periods:
- `emaFastLen = input.int(30, "Fast EMA")`
- `emaSlowLen = input.int(150, "Slow EMA")`
2. **Relax RSI Filters**
Adjust the RSI range to:
- `rsiBullish = rsi > 45 and rsi < 75`
- `rsiBearish = rsi < 55 and rsi > 25`
3. **Add Profit Targets**
Introduce a profit target at 1.5% above entry:
```pine
strategy.exit("Long Exit", "Long",
stop=longStopPrice,
profit=close*1.015, // 1.5% target
trail_offset=trailOffset)
```
4. **Reduce Position Sizing**
Risk a smaller percentage per trade:
- `default_qty_value=25`
---
**Best Use Case**
This strategy excels in **strong trending markets** such as gold rallies during economic or geopolitical crises. However, during sideways or choppy market conditions, the strategy might require manual intervention to avoid false signals. Additionally, integrating fundamental analysis—like monitoring USD weakness or geopolitical risks—can enhance its effectiveness.
---
This strategy offers a balanced approach for trading gold, combining trend-following principles with risk management tailored to the volatility of the market.

Sharpe and Sortino Ratios with Date RangeThis indicator calculates the Sharpe and Sortino ratios using a chart symbol's periodic price returns.
I added the ability to calculate SORTINO and Sharpe based on CUSTOM DATES within the option menu.
It builds on the script here: by adding this feature.
A little about the Sortino Ratio.
www.nasdaq.com
I want equity market returns, but I don’t want equity market volatility. This is the sentiment many investors naturally feel. This sentiment often grows stronger as one approaches or is in the phase where they desire distributions from their savings to improve lifestyle. This is why there is a need for active management in the investment arena. The desire to control downside volatility, but also participate in the upside growth is a very fundamental human desire. The Sortino Ratio measures how well a particular investment meets this fundamental human desire.
There is the old adage, “volatility is the price you pay for returns.” However, what if we could measure the historical performance of an investment and see if it has given above average returns compared to the downside volatility. This is a simple division problem. It will tell us if the volatility “price we are paying for returns” is good. We can then compare that to other investments to see how they compare.
Let us take the return and subtract the risk-free interest rate and then simply divide that by the downside movement from the average. A basic division problem yielding a number that measures a very basic human desire: How well did this investment do compared to the downside risk it experienced.
In the world of financial analysis and investment management, ratios are abundant. There are many ratios that are truly important to a particular analysis. However, the sheer abundance of ratios that are available often overwhelms the casual investor, leading them to disregard ratios altogether. I would argue for those investors that desire a way to rank an investment by its ability to satisfy this very fundamental human desire, the Sortino Ratio is the number they need to consider.
Disappointing in the marketplace for research, the Sortino Ratio is not featured prominently. It is much easier to find the inflows a particular ETF has experienced than the Sortino Ratio. Inflows are important. They measure how much people are investing into an ETF. However, they are mostly only important to the fund manager, not the investor. What investors care about is the Risk-Adjusted Return. This is the Sortino Ratio.

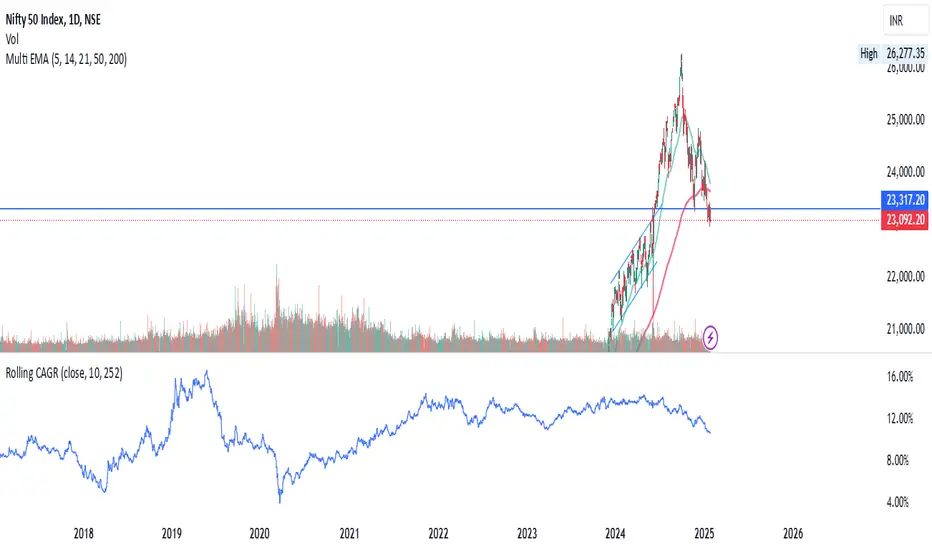
Rolling CAGRRolling CAGR (Compound Annual Growth Rate) Indicator
This indicator calculates and plots the rolling Compound Annual Growth Rate (CAGR) for any selected data source. CAGR represents the mean annual growth rate of an investment over a specified time period, taking into account the effect of compounding.
Features:
• Customizable data source (default: close price)
• Adjustable time period in years
• Configurable trading days per year (252 for stocks, 365 for crypto)
• Results displayed as percentage values
• Works on daily timeframes
Input Parameters:
• Data Source: Select the price or indicator data to analyze
• Number of Years: Set the lookback period for CAGR calculation
• Trading Days in a Year: Adjust based on market type (252 for stocks, 365 for crypto)
Usage:
Perfect for analyzing long-term growth rates and comparing investment performance across different periods. The indicator provides a rolling view of compound growth, helping traders and investors understand the sustained growth rate of an asset over their chosen timeframe.
Note: This indicator is designed for daily timeframes as CAGR calculations are most meaningful over longer periods.
Formula Used:
CAGR = (End Value / Start Value)^(1/number of years) - 1
Position Size Calculator (MOEX Futures)Описание на русском языке
Этот скрипт для TradingView создан специально для трейдеров, работающих с фьючерсами на Московской бирже. Его основная цель – помочь трейдерам быстро и точно рассчитывать параметры позиции, такие как количество контрактов, риск на сделку, общий размер маржи, а также цены стоп-лосса и тейк-профита.
Функционал:
Расчет цены контракта: учитывает цену актива (в пунктах) и стоимость одного пункта.
Риск на сделку: определяется как процент от общего капитала.
Размер позиции: рассчитывается на основе риска на сделку и стоп-лосса.
Количество контрактов: округляется до целого числа вниз.
Общий размер маржи: определяется исходя из количества контрактов и маржи на один контракт.
Цены стоп-лосса и тейк-профита: вычисляются как для лонг-, так и для шорт-позиций.
Интерактивная таблица: статично отображается в правом верхнем углу графика и обновляется автоматически при изменении входных данных.
Скрипт заточен исключительно под специфику фьючерсов Московской биржи и позволяет трейдерам оптимизировать расчёты, минимизировать ошибки и экономить время.
Description in English
This TradingView script is specifically designed for traders working with futures on the Moscow Exchange. Its primary purpose is to help traders quickly and accurately calculate position parameters, such as the number of contracts, risk per trade, total margin size, and stop-loss and take-profit prices.
Features:
Contract price calculation: Takes into account the asset price (in points) and the price per point.
Risk per trade: Defined as a percentage of the total capital.
Position size: Calculated based on the risk per trade and stop-loss percentage.
Number of contracts: Rounded down to the nearest whole number.
Total margin size: Determined based on the number of contracts and margin per contract.
Stop-loss and take-profit prices: Calculated for both long and short positions.
Interactive table: Statically displayed in the top-right corner of the chart and dynamically updated when input parameters change.
This script is tailored exclusively to the specifics of futures trading on the Moscow Exchange, enabling traders to optimize calculations, minimize errors, and save time.

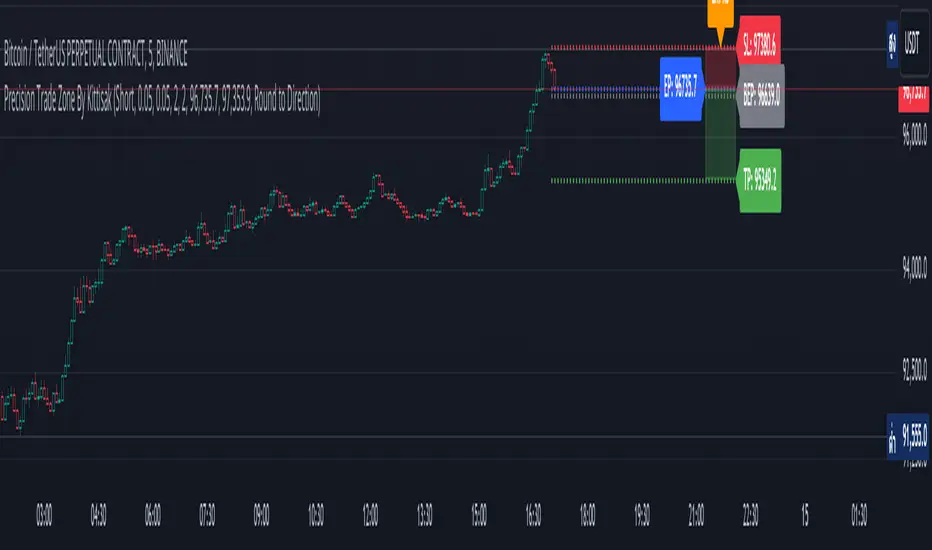
Precision Trade Zone By KittisakThis indicator is designed for Money Management calculations, helping to facilitate risk management in trading, determining suitable leverage based on acceptable risk, and adjusting the Stop Loss level to align with the calculated leverage.
Abbreviation Descriptions
LR : Suitable Leverage.
EP : Entry Price.
BEP : Break-Even Point (a point where you can move your Stop Loss to prevent losses once the price reaches a certain level).
SL : Stop Loss (a recalculated Stop Loss level to match the leverage. You should use this as the Stop Loss price instead of the initial level you set).
TP : Take Profit (a point where you take profit based on the defined risk-reward ratio).
Note
When first activating the indicator, an error may occur, and no output will be displayed. This happens because you must first specify the Entry Price and Stop Loss in the indicator settings.
How Much Leverage Should You Use?
It may seem like a simple question but is difficult to answer.
Method for Calculating Suitable Leverage
Use the formula:
Leverage = Acceptable Loss / (Distance between Entry Price and Stop Loss + (Buy Fee + Sell Fee))
Calculating the Correct Stop Loss Point
(Stop Loss levels will be slightly adjusted or extended)
For Long Positions :
New Stop Loss = Entry Price * (1 - Acceptable Loss / (Calculated Leverage * 100))
For Short Positions :
New Stop Loss = Entry Price * (1 + Acceptable Loss / (Calculated Leverage * 100))
Calculating the Correct Take Profit Point
(Take Profit levels will be slightly adjusted or extended)
For Long Positions :
Take Profit = Entry Price * (1 + (Acceptable Loss / (Calculated Leverage * 100) * RR) + ((Buy Fee + Sell Fee) / 100))
For Short Positions :
Take Profit = Entry Price * (1 - (Acceptable Loss / (Calculated Leverage * 100) * RR) + ((Buy Fee + Sell Fee) / 100))
Benefits of This Calculation
1. Accurate Risk Assessment
The calculated leverage accounts for trading fees. For example, if you aim for a 2% loss, this method ensures the actual loss is exactly 2%, not more (e.g., 2% plus fees).
2. Eliminates Guesswork
Randomly setting leverage can lead to risks because the Stop Loss level may not align with your position. This calculation ensures that the leverage aligns precisely with your desired Stop Loss level.
3. Realistic Profit Targets
For example, with a 2% acceptable loss and a 1:2 RR, you expect a 4% profit. However, without this calculation, fees may reduce your profit below 4%. This method includes fees, ensuring your profit matches the intended target.
Caution
This indicator does not account for slippage or requotes. Use it with caution and allow a buffer for slippage in your calculations.
Indicator นี้มีไว้สำหรับคำนวณ Money Management ซึ่งจะช่วยอำนวยความสะดวกในการจัดการความเสี่ยงในการเทรด การคำนวณ Leverage ที่เหมาะสมกับความเสี่ยงที่คุณยอมรับได้ และจัดการจุด Stop Loss ให้เหมาะสมกับ Leverage นั้น
คำอธิบายเกี่ยวกับคำย่อ
LR หมายถึง Leverage ที่เหมาะสม
EP หมายถึง Entry Price หรือราคาเข้าซื้อ
BEP หมายถึง Break-Even Point หรือจุดคุ้มทุน (คุณสามารถย้าย Stop Loss มาที่จุดนี้เมื่อราคาไปถึงจุดหนึ่งเพื่อป้องกันการขาดทุนได้)
SL หมายถึง Stop Loss (ซึ่งเป็น Stop Loss ที่คำนวณใหม่เพื่อให้ตำแหน่งเหมาะสมกับ Leverage ที่คำนวณได้ คุณควรใช้จุดนี้เพื่อเป็นราคา Stop Loss แทนจุด Stop Loss ที่คุณกำหนดไว้ในตอนแรก)
TP หมายถึง Take Profit (เป็นจุดที่คุณจะขายทำกำไรตาม RR ที่กำหนดไว้)
* หมายเหตุ เมื่อเริ่มเปิด Indicator จะเกิด Error ขึ้น และไม่มีผลลัพท์ใด ๆ แสดงให้เห็น นั่นเป็นเพราะคุณต้องเข้าไปกำหนด Entry Price และ Stop Loss ในการตั้งค่าของ Indicator เสียก่อน
ต้องใช้ Leverage เท่าไหร่? มันเป็นคำถามที่ดูเหมือนง่าย แต่ตอบยาก
วิธีคำนวณ Leverage ที่เหมาะสม ใช้สมการคือ
Levarage = การขาดทุนที่ยอมรับได้ / (ระยะห่างระหว่าง Entry Price และ Stop Loss + (ค่าธรรมเนียมซื้อ + ค่าธรรมเนียมขาย))
นำผลลัพท์ Leverage ที่ได้มาคำนวณเพื่อหาจุด Stop Loss ที่ถูกต้อง (จุดของ Stop Loss จะมีการยืดขยายออกไปเล็กน้อย) โดยใช้สมการ
ตำแหน่ง Stop Loss ใหม่ = Entry Price * (1 - การขาดทุนที่ยอมรับได้ / (Leverage ที่คำนวณได้ * 100)) // สำหรับ Long
ตำแหน่ง Stop Loss ใหม่ = Entry Price * (1 + การขาดทุนที่ยอมรับได้ / (Leverage ที่คำนวณได้ * 100)) // สำหรับ Short
นำผลลัพท์ Leverage ที่ได้มาคำนวณเพื่อหาจุด Take Profit ที่ถูกต้อง (จุดของ Take Profit จะมีการยืดขยายออกไปเล็กน้อย) โดยใช้สมการ
ตำแหน่ง Take Profit = Entry Price * (1 + (การขาดทุนที่ยอมรับได้ / (Leverage ที่คำนวณได้ * 100) * RR) + ((ค่าธรรมเนียมซื้อ + ค่าธรรมเนียมขาย) / 100)) // สำหรับ Long
ตำแหน่ง Take Profit = Entry Price * (1 - (การขาดทุนที่ยอมรับได้ / (Leverage ที่คำนวณได้ * 100) * RR) + ((ค่าธรรมเนียมซื้อ + ค่าธรรมเนียมขาย) / 100)) // สำหรับ Short
ข้อดีของการคำนวณคือ
1. คุณจะได้ค่า Leverage ที่เหมาะสมกับความเสี่ยงที่คุณยอมรับได้โดยรวมค่าธรรมเนียมเข้าไปในนั้นแล้ว นั่นหมายความว่า ความสูญเสียจะเป็น 2% (ตามตัวอย่าง) จริง ๆ ไม่ใช่ 2% และถูกหักค่าธรรมเนียมเพิ่มอีก กลายเป็นสูญเสียมากกว่า 2%
2. การตั้ง Leverage มั่ว ๆ กลายเป็นความเสี่ยง นั่นเพราะตำแหน่งของ Stop Loss ไม่ได้อยู่ในจุดที่ควรจะเป็น การคำนวณนี้ช่วยให้คุณได้ Leverage ในตำแหน่ง Stop Loss ที่คุณต้องการโดยแท้จริง
3. ผลกำไรที่ได้รับตรงกับความต้องการจริง ๆ เช่น การขาดทุนที่ยอมรับได้ 2% และ RR 1:2 สิ่งที่คุณคิดคือกำไร 4% แต่จริง ๆ แล้วไม่ถึง 4% นั่นเพราะว่าโดนหักค่าธรรมเนียมไปส่วนหนึ่ง การคำนวณนี้ได้รวมค่าธรรมเนียมให้แล้ว คุณจึงได้กำไรที่ 4% อย่างถูกต้องตามต้องการ
ข้อควรระวัง
Indicator นี้ไม่ได้มีการควบคุมความเสี่ยงในเรื่องของ slippage หรือ requote โปรดใช้งานอย่างระมัดระวังและมีการเผื่อระยะสำหรับ slippage ด้วย
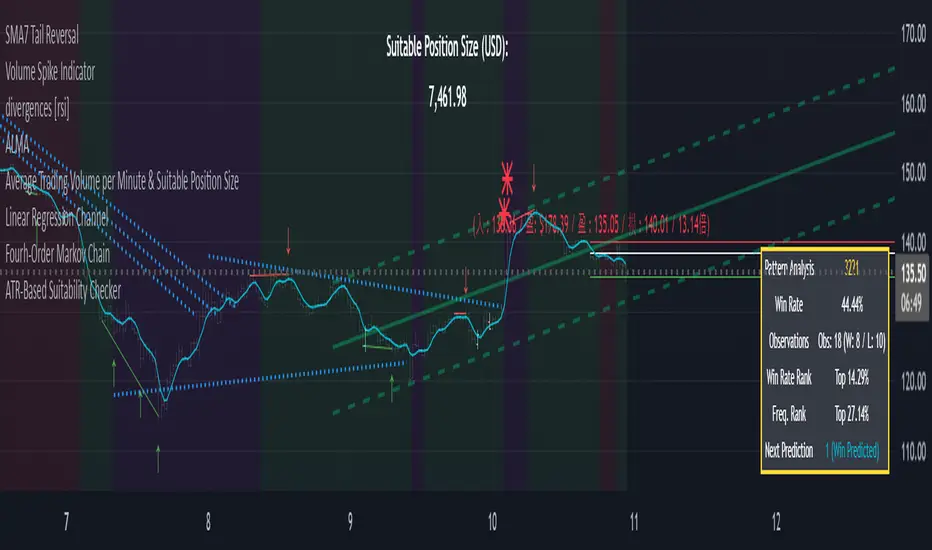
ATR-Based Suitability CheckerPurpose:
This indicator helps traders identify the most suitable timeframe for trading by comparing fees to market volatility (ATR). Instead of filtering out specific assets or strategies, it focuses on finding optimal trading conditions for the selected timeframe. It is designed to adapt dynamically, ensuring that traders can align their approach with the current market environment.
Key Features:
Dynamic ATR Analysis: Measures volatility using the Average True Range (ATR) and evaluates how fees impact potential profitability across timeframes.
Fee-to-ATR Ratio: Calculates the proportion of fees to ATR, highlighting conditions where fees are too large relative to price movements.
Visual Feedback: **Red Background:** Indicates unsuitable trading conditions where fees dominate. **Green Background:** Highlights suitable conditions for trading efficiency. Markers provide quick visual identification of suitability.
Custom Transparency: Enables users to adjust the background’s transparency for better chart visibility.
How to Use:
Timeframe Optimization: When volatility rises, price movements become larger, making shorter timeframes more suitable for trading. Conversely, during periods of low volatility, longer timeframes are preferable to avoid overtrading within a narrow price range.
Spot & Leverage Trading: For spot trading, this tool identifies conditions where fees (e.g., 0.25%-0.3%) might excessively impact profitability. For instance, if ATR is comparable to fees, the trading environment may not be ideal. In leveraged trading, the indicator helps assess whether the current volatility supports your chosen leverage level, ensuring that leverage does not amplify undue risks.
Efficiency Focus: The indicator emphasizes finding a balance between market conditions and your trading strategy. Not all timeframes need to be "suitable" at all times; instead, it highlights the best opportunities based on current market dynamics. Utilize the suitability ratio across different timeframes to guide and adjust your trading strategies effectively.
Input Parameters:
ATR Length: Defines the period for ATR calculation (default: 14).
Fee Percentage (%): Trading fee as a percentage of the closing price (default: 0.1%).
Unsuitable Threshold (% of 1 ATR): Sets the maximum acceptable fee-to-ATR ratio for suitable conditions (default: 20%).
Background Transparency (0-100): Adjusts the opacity of the background highlight (default: 80).
Who Should Use This:
This tool is ideal for traders seeking to align their strategy with market conditions by finding the most suitable timeframe. It applies to both spot and leveraged markets, helping optimize efficiency while managing fees and volatility.
Notes:
The ATR-Based Suitability Checker is a supplementary tool. Combine it with other forms of analysis for comprehensive decision-making.
Regularly adjust the parameters to match your trading preferences and market conditions.
Consistency Rule CalculatorThis script, titled "Consistency Rule Calculator" is designed for use on the TradingView platform. It allows traders to input specific values related to their account, daily highest profit, and a consistency rule (as a decimal).
The script then calculates the "Amount Needed to Withdraw" based on the user's input. This value is calculated using the formula:
Amount Needed to Withdraw = (Daily Highest Profit/Consistency Rule )+ Account Type
Each prop firm has its own consistency rule. Follow their rule, and you will be second to payout!
Additionally, it displays the input values and the calculated amount in a customizable table on the chart. The table is formatted with colors for clarity, and it provides a motivational quote about successful trading. Plus, user can adjust the table's position on the screen.

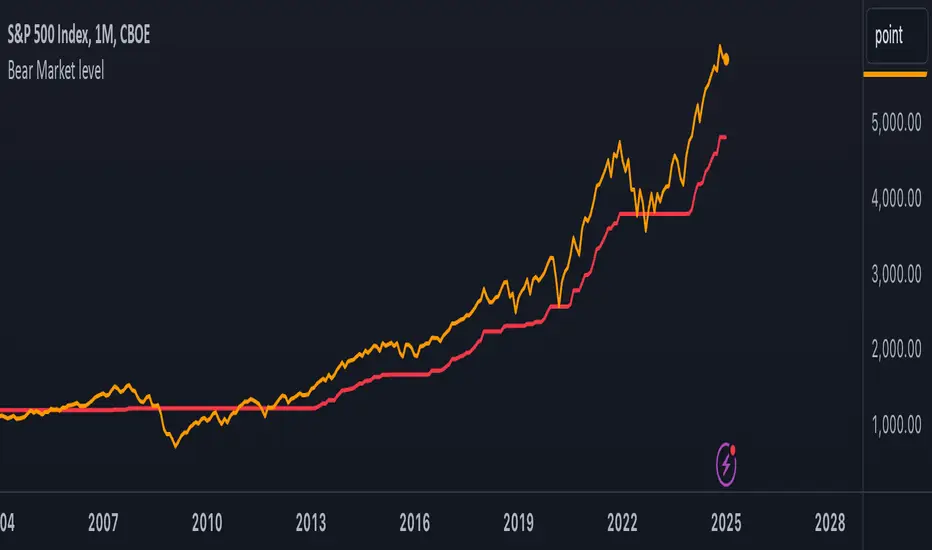
Bear Market LevelMarks the bear market level. Calculated as 20% drop from highs. Useful on indices to determine technical Bull or Bear markets.
BTC vs Mag7 Combined IndexThis Mag7 Combined Index script is a custom TradingView indicator that calculates and visualizes the collective performance of the Magnificent 7 (Mag7) stocks—Apple, Microsoft, Alphabet, Amazon, NVIDIA, Tesla, and Meta (red line) compared to Bitcoin (blue line). It normalizes the daily closing prices of each stock to their initial value on the chart, scales them into percentages, and then computes their simple average to form a combined index. The result is plotted as a single red line, offering a clear view of the aggregated performance of these influential stocks over time compared to Bitcoin.
This indicator is ideal for analyzing the overall market impact of Bitcoin compared to the Mag7 stocks.

Simple Average Price & Target ProfitThis script is designed to help users calculate and visualize the weighted average price of an asset based on multiple entry points, along with the target price and the potential profit. The user can input specific prices for three different entries, along with the percentage of total investment allocated to each price point. The script then calculates the weighted average price based on these entries and displays it on the chart. Additionally, it calculates the potential profit at a given target price, which is plotted on the chart.

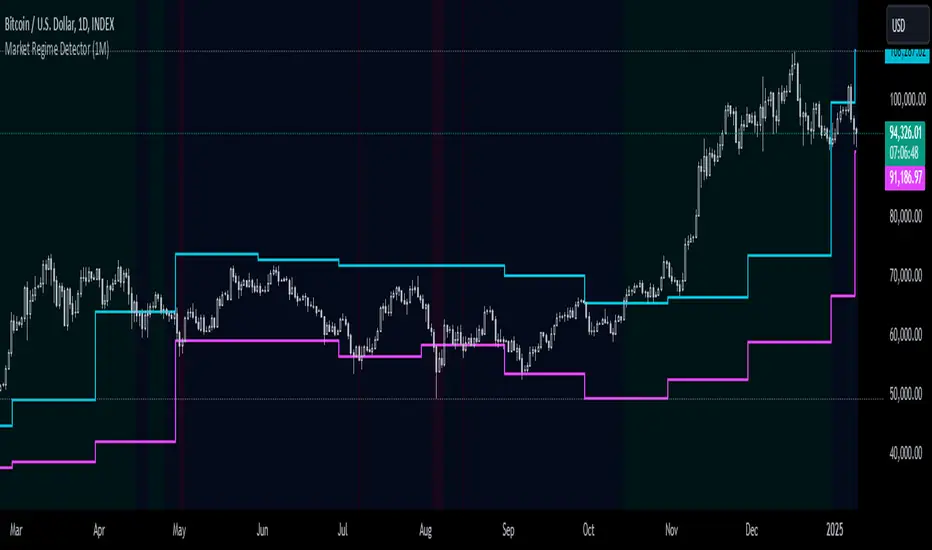
Market Regime DetectorMarket Regime Detector
The Market Regime Detector is a tool designed to help traders identify and adapt to the prevailing market environment by analyzing price action in relation to key macro timeframe levels. This indicator categorizes the market into distinct regimes—Bullish, Bearish, or Reverting—providing actionable insights to set trading expectations, manage volatility, and align strategies with broader market conditions.
What is a Market Regime?
A market regime refers to the overarching state or condition of the market at a given time. Understanding the market regime is critical for traders as it determines the most effective trading approach. The three main regimes are:
Bullish Regime:
Characterized by upward momentum where prices are consistently trending higher.
Trading strategies often focus on buying opportunities and trend-following setups.
Bearish Regime:
Defined by downward price pressure and declining trends.
Traders typically look for selling opportunities or adopt risk-off strategies.
Reverting Regime:
Represents a consolidation phase where prices move within a defined range.
Ideal for mean-reversion strategies or range-bound trading setups.
Key Features of the Market Regime Detector:
Dynamic Market Regime Detection:
Identifies the market regime based on macro timeframe high and low levels (e.g., weekly or monthly).
Provides clear and actionable insights for each regime to align trading strategies.
Visual Context for Price Levels:
Plots the macro high and low levels on the chart, allowing traders to visualize critical support and resistance zones.
Enhances understanding of volatility and trend boundaries.
Regime Transition Alerts:
Sends alerts only when the market transitions into a new regime, ensuring traders are notified of meaningful changes without redundant signals.
Alert messages include clear regime descriptions, such as "Market entered a Bullish Regime: Price is above the macro high."
Customizable Visualization:
Background colors dynamically adjust to the current regime:
Blue for Reverting.
Aqua for Bullish.
Fuchsia for Bearish.
Option to toggle high/low line plotting and background highlights for a tailored experience.
Volatility and Expectation Management:
Offers insights into market volatility by showing when price action approaches, exceeds, or reverts within macro timeframe levels.
Helps traders set realistic expectations and adjust their strategies accordingly.
Use Cases:
Trend Traders: Identify bullish or bearish regimes to capture sustained price movements.
Range Traders: Leverage reverting regimes to trade between defined support and resistance zones.
Risk Managers: Use macro high and low levels as dynamic stop-loss or take-profit zones to optimize trade management.
The Market Regime Detector equips traders with a deeper understanding of the market environment, making it an essential tool for informed decision-making and strategic planning. Whether you're trading trends, ranges, or managing risk, this indicator provides the clarity and insights needed to navigate any market condition.
Dynamic Risk-Adjusted Performance Ratios with TableWith this indicator, you have everything you need to monitor and compare the Sharpe ratio, Sortino ratio, and Omega ratio across multiple assets—all in one place. This tool is designed to help save time and improve efficiency by letting you track up to 15 assets simultaneously in a fully customizable table. You can adjust the lookback period to fit your trading strategy and get a clearer picture of how your assets perform over time. Instead of switching between charts, this indicator puts all the critical information you need at your fingertips.
Sharpe Ratio -
Helps evaluate the overall efficiency of investments by comparing the average return to the total risk (measured by the standard deviation of all returns). Essentially, it tells you how much excess return you’re getting for each unit of risk you’re taking. A higher Sharpe ratio means you’re getting better risk-adjusted performance—something you’ll want to aim for in your portfolio.
Sortino Ratio -
Goes a step further by focusing only on downside risk—because let’s face it, no one worries about positive volatility. This ratio is calculated by dividing the average return by the standard deviation of only the negative returns. Perfect for those concerned about avoiding losses rather than chasing extreme gains. It gives you a sharper view of how well your assets are performing relative to the risks you’re trying to avoid.
Omega Ratio -
Offers a unique perspective by comparing the sum of positive returns to the absolute sum of negative returns. It’s a straightforward way to see if your wins outweigh your losses. A higher Omega ratio means your positive returns significantly exceed the downside, which is exactly what you want when building a strong, reliable portfolio.
This indicator is perfect for traders who want to streamline their decision-making process and gain an edge. Bringing together these three critical ratios into a single user-defined table makes it easy to compare and rank assets at a glance. Whether optimizing a portfolio or looking for the best opportunities, this tool helps you stay ahead by focusing on risk-adjusted returns. The customizable lookback period lets you tailor the analysis to fit your unique trading approach, giving you insights that align with your goals. If you’re serious about making data-driven decisions and improving your trading outcomes, this indicator is a game-changer for your toolkit.

HMA Buy Sell Signals - Profit ManagerNote : Settings should be adjusted according to the selected time frame. Try to find the best setting according to the profitability rate
Overall Functionality
This script combines several trading tools to create a comprehensive system for trend analysis, trade execution, and performance tracking. Users can identify market trends using specific moving averages and RSI indicators while managing profit and loss levels automatically.
Trend Detection and Trade Signals
Hull Moving Averages (HMA):
Two HMAs (a faster one and a slower one) are used to determine the market trend.
A buy signal is generated when the faster HMA crosses above the slower HMA.
Conversely, a sell signal is triggered when the faster HMA crosses below the slower one.
Visual Feedback:
Trend lines on the chart change color to reflect the trend direction (e.g., green for upward trends and red for downward trends).
Trade Levels and Management
Entry, Take-Profit, and Stop-Loss Levels:
When the trend shifts upwards, the script calculates entry, take-profit, and stop-loss levels based on the opening price.
Similarly, for downward trends, these levels are determined for short trades.
Commission Tracking:
Each trade includes a commission cost, which is factored into net profit and loss calculations.
Dynamic Labels:
Entry, take-profit, and stop-loss levels are visually marked on the chart for easier tracking.
Performance Tracking
Profit and Loss Tracking:
The script keeps a running total of profits, losses, and commissions for both long and short trades.
It also calculates the net profit after all costs are considered.
Performance Table:
A table is displayed on the chart summarizing:
The number of trades.
Total profit and loss for long and short positions.
Commission costs.
Net profit.
Fractal Support and Resistance
Dynamic Lines:
The script identifies the most recent significant highs and lows using fractals.
It draws support and resistance lines that automatically update as new fractals form.
Simplified Visuals:
The chart always shows the last two support and resistance lines, keeping the visualization clean and focused.
RSI-Based Signals
Overbought and Oversold Levels:
RSI is used to identify overbought (above 80) and oversold (below 20) conditions.
The script generates buy signals at oversold levels and sell signals at overbought levels.
Chart Indicators:
Arrows and labels appear on the chart to highlight these RSI-based opportunities.
Customization
The script allows users to customize key parameters such as:
Moving average lengths for trend detection.
Take-profit and stop-loss percentages.
Timeframes for backtesting.
Starting capital and commission rates.
Conclusion
This script is a versatile tool for traders, combining trend detection, automated trade management, and visual feedback. It simplifies decision-making by providing clear signals and tracking performance metrics, making it suitable for both beginners and experienced traders.
* The most recently drawn fractals represent potential support and resistance levels. If the price aligns with these levels at the time of entering a trade, it may indicate a likelihood of reversal. In such cases, it’s advisable to either avoid entering the trade altogether or proceed with increased caution.

Visual Range Position Size CalculatorVisual Range Position Size Calculator
The "VR Position Size Calculator" helps traders determine the appropriate position size based on their risk tolerance and the current market conditions. Below is a detailed description of the script, its functionality, and how to use it effectively.
---
Key Features
1. Risk Calculation: The script allows users to input their desired risk in monetary terms (in the currency of the ticker). It then calculates the position sizes for both long and short trades based on this risk.
2. Dynamic High and Low Tracking: The script dynamically tracks the highest and lowest prices within the visible range of the chart, allowing for more accurate position sizing.
3. Formatted Output: The calculated values are displayed in a user-friendly table format with thousands separators for better readability.
4. Visual Indicators: Dashed lines are drawn on the chart at the high and low points of the visible range, providing a clear visual reference for traders.
5. If the risk in security price is 1% or less, the background of the cells displaying position sizes will be green for long positions and red for short positions. If the risk is between 1% and 5%, the background changes to gray, indicating that the risk may be too high for an effective trade. If the risk exceeds 5% of the price, the text also turns gray, rendering it invisible, which signifies that there is no justification for such a trade.
---
Code Explanation
The script identifies the start and end times of the visible range on the chart, ensuring calculations are based only on the data currently in view. It updates and stores the highest (hh) and lowest (ll) prices within this visible range. At the end of the range, dashed lines are drawn at the high and low prices, providing a visual cue for traders.
Users can input their risk amount, which is then used to calculate potential position sizes for both long and short trades based on the current price relative to the tracked high and low. The calculated risk values and position sizes are displayed in a table on the right side of the chart, with color coding to indicate whether the calculated position size meets specific criteria.
---
Usage Instructions
1. Add the Indicator: To use this script, copy and paste it into Pine Script editor, then add it to your chart.
2. Input Your Risk: Adjust the 'Risk in money' input to reflect your desired risk amount for trading.
3. Analyze Position Sizes: Observe the calculated position sizes for both long and short trades displayed in the table. Use this information to guide your trading decisions.
4. Visual Cues: Utilize the dashed lines on the chart to understand recent price extremes within your visible range.
RISK MANAGEMENT TABLEThis updated Risk Management Indicator is a powerful and customizable tool designed to help traders effectively manage risk on every trade. By dynamically calculating position size, stop-loss, and take-profit levels, it enables traders to stay disciplined and follow predefined risk parameters directly on their charts.
Features:
Dynamic Stop-Loss and Take-Profit Levels:
Stop-loss is based on the Average True Range (ATR), offering a flexible way to account for
market volatility.
Take-profit levels can be customized as a percentage of the entry price, providing a clear
target for trade exits.
Position Sizing Calculation:
The indicator computes the maximum position size by considering:
Trade amount (montant_ligne).
Risk percentage per trade.
Transaction fees.
Visual Representation:
Displays stop-loss and take-profit levels on the chart as customizable lines.
Optional visibility of these lines through checkboxes in the settings panel.
Comprehensive Risk Table:
A table on the chart summarizes essential risk metrics:
Stop-loss value.
Distance from entry in percentage.
Position size (maximum suggested).
Take-profit price.
Customizable:
Adjust parameters like ATR length, smoothing type, risk percentage, transaction fees,
and take-profit percentage.
Modify the visual length of lines representing stop-loss and take-profit levels.
How It Works:
Stop-Loss Calculation:
The stop-loss level is calculated using ATR and a volatility factor (default: 2).
This ensures your stop-loss adapts to market conditions.
Take-Profit Calculation:
Take-profit is derived as a percentage increase from the entry price.
Position Size:
The optimal position size is computed as:
Position Size = Risk per Trade /ATR-based Stop Distance
The risk per trade deducts transaction fees to provide a more accurate calculation.
Visual Lines:
Risk Table:
The table displays updated stop-loss, position size, and take-profit metrics at a glance.
Settings Panel:
Length: ATR length for calculating market volatility.
Smoothing: Choose RMA, SMA, EMA, or WMA for ATR smoothing.
Trade Amount: The capital allocated to a single trade.
Risk by Trade (%): Define how much of your trade capital is at risk per trade.
Transaction Fees: Input fees to ensure realistic calculations.
Take Profit (%): Specify your desired take-profit percentage.
Show Entry Stop Loss: Toggle visibility of the stop-loss line.
Show Entry Take Profit: Toggle visibility of the take-profit line.

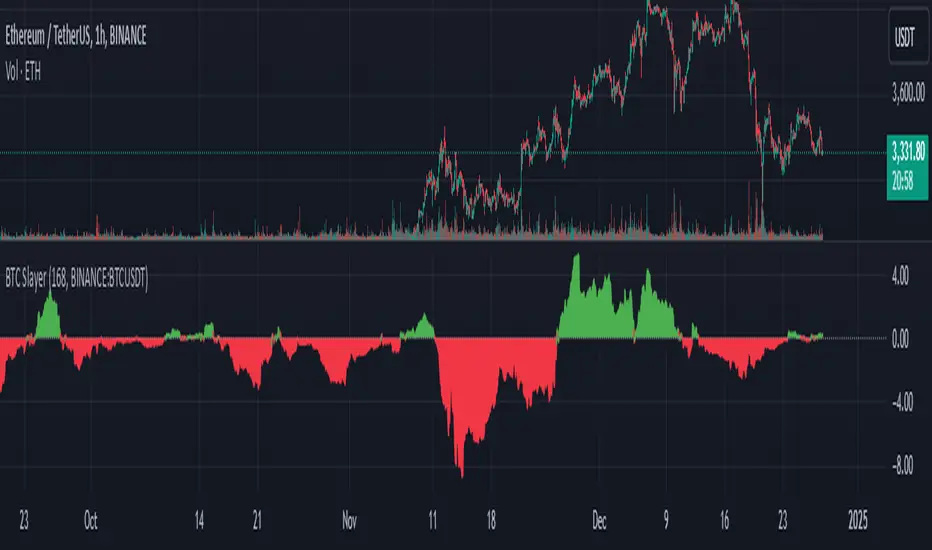
BTC Slayer 9000 - Relative Risk-adjusted performanceBTC Slayer 9000: Relative Risk-Adjusted Performance
Dear friends and fellow traders,
I am pleased to introduce the BTC Slayer 9000, a script designed to provide clear insights into risk-adjusted performance relative to a benchmark. Whether you're navigating the volatile world of cryptocurrencies or exploring opportunities in stocks, this tool helps you make informed decisions by comparing assets against your chosen benchmark.
What Does It Do?
This indicator is based on the Ulcer Index (UI), a metric that measures downside risk. It calculates the Ulcer Performance Index (UPI), which combines returns and downside risk, and compares it to a benchmark (like BTC/USDT, SPY500, or any trading pair).
The result is the Relative UPI (RUPI):
Positive RUPI (green area): The asset's risk-adjusted performance is better than the benchmark.
Negative RUPI (red area): The asset's risk-adjusted performance is worse than the benchmark.
Why Use It?
Risk vs. Reward: See if the extra risk of an asset is justified by its returns.
Customizable Benchmark: Compare any asset against BTC, SPY500, or another chart.
Dynamic Insights: Quickly identify outperforming assets for long positions and underperformers for potential shorts.
How to Use:
Inputs:
Adjust the lookback period to set the time frame for analysis. 720 Period is meant to represent 30 days. I like to use 168 period because I do not hold trades for long.
Choose your comparison chart (e.g., BTC/USDT, SPY500, AAPL, etc.).
Interpretation:
Green Area Above 0: The asset offers better risk-adjusted returns than the benchmark.
Red Area Below 0: The benchmark is a safer or more rewarding option.
Perfect for All Traders
Whether you:
Trade Cryptocurrencies: Compare altcoins to BTC.
Invest in Stocks: Compare individual stocks to indices like SPY500.
Evaluate Portfolio Options: Decide between assets like AAPL or TSLA.
This indicator equips you with a systematic way to evaluate "Is the extra risk worth it?".
The script was compiled in Collaboration with ChatGPT