Business Predictability | Robinhodl21Have you ever wondered why a company beats earnings estimates yet its stock barely moves—or even drops? It might be because the market already expected a beat. Companies that consistently outperform forecasts tend to attract higher expectations over time, so another “+20 % surprise” may no longer surprise anyone. In other cases, investors may weigh sales growth more heavily than earnings, especially in growth sectors where top-line momentum matters more than margin control.
This indicator was built to explore exactly that dynamic. It helps you quantify how predictable a business truly is, how consistently it beats (or misses) expectations, and how well management seems to understand and guide its own performance. It’s not a timing tool, but a quality lens for long-term stock pickers who want to identify stable, well-managed companies with disciplined forecasting and execution.
What the indicator is
its is designed to quantify how often and how well a company beats-or-misses expectations (earnings and sales) over multiple years, then map that into a “predictability” and “quantile” score that you can use to compare across stocks. Its core logic combines deviation from estimates, rolling history, and statistical ranking to highlight companies where the management and the business appear to be aligned, stable and reliable.
Key features:
(• Choice of financial data frequency: you can select FQ (quarterly) or FY (annual) mode so the indicator adapts to your preferred horizon.
(• Deviation calculation: earnings surprise and/or sales surprise can be combined via a weighted setup so you pick which metric drives the score.
(• History buffer: you choose how many “commit points” (i.e., past surprises) to include in the statistics and quantile calculations.
(• Quantile ranking: the tool computes how the company’s recent deviation stacks up versus its own history; in FY-mode we still use quarterly density for statistical robustness.
(• Predictability & volatility metrics: beyond the quantile, you get a predictability score (low recent deviation + low volatility) and a simple “moat” / management-quality overlay via the SLOAN ratio.
(• Status and CI table: the indicator comes with a visualization panel summarizing mean surprise, standard deviation, sample length, and your computed quantile and predictability grades.
(• Future box: optional forward-map showing the next earnings date, estimated deltas and flagged surprises.
What it is not
It is not a timing indicator (i.e., it won’t tell you when to buy or sell precisely). It does not predict short-term price movements. Instead, it is tuned for fundamental stock picking: look for companies that repeatedly deliver surprise results, for which you believe management and business model give an advantage. Use it to add an extra dimension of “earnings surprise stability & management forecasting quality” to your dashboard.
My usage case
I developed this indicator as part of a broader portfolio strategy: I screen for companies that are both highly predictable (i.e., rarely miss) and have the capacity to beat earnings by a meaningful margin, because I believe this reflects strong business execution and good internal alignment. Over time I plan to expand the dashboard with more indicators geared toward company quality and moat (quantitative metrics built from financial statement data). This version is still work in progress (there may be bugs), so consider the output as one more input—do not rely on it exclusively.
Important caveats
The code is relatively computation-intensive, especially with large lookback windows and quarterly frequency. On my Mac Pro it runs smoothly—but depending on your device and market data feed you may experience slower performance. Also: synchronising earnings release timing and sales release timing across companies is tricky—sometimes data lags or is updated later, so there may be discrepancies. Because of this the indicator’s output should be treated as a guide rather than a guarantee.
Empirical background
The academic literature supports the idea that consistent surprises and management execution can matter—but the relationship is complex. For example, research on post-earnings-announcement drift (PEAD) shows that markets often under-react to surprise earnings and that returns continue to drift in the direction of surprise for weeks or months.  At the same time, studies such as Skinner & Sloan (2000) show that when you control for growth expectations the relation of surprise to future returns becomes weaker.  In other words: just beating earnings by 20 % repeatedly does not guarantee outsized share-price gains, because market expectations adjust, estimates bake in the beat and other factors (discount rates, fundamentals) still dominate.
Final word
Use it as part of your fundamental stock-analysis toolkit to gauge how well a company consistently delivers relative to expectations, how volatile those surprises are, and whether you think management has a competitive edge in forecasting or executing. As mentioned, this is a work in progress and should not be your only tool—but used wisely, it can add a meaningful extra dimension to your decision-making. I’ll continue to improve it and add new quality-and-moat oriented indicators in future releases.
Quantitativeanalysis

DCA with the Money Supply Index DCA with the Money Supply Index (MSI) by zdmre
This strategy is based on the Money Supply Index (MSI) by zdmre and enhances it with two functional options for users: a DCA (Dollar-Cost Averaging) approach and a signal-based buy/sell mode. It’s designed to help traders and investors make data-driven, disciplined entry decisions based on monetary supply trends.
🧠 Concept Overview
The Money Supply Index (MSI) provides insight into how liquidity (money supply) influences market movements. This strategy builds upon that foundation by allowing users to either:
Accumulate positions over time using DCA, based on favorable MSI conditions.
Execute a single buy and sell trade, optimized for bull market conditions.
⚙️ Inputs Explained
General Parameters
Start Bar Index / Stop Bar Index
Defines the range of bars (historical data) for backtesting or strategy visualization.
Long DCA
Activates the DCA mode. If unchecked, the strategy operates in single-entry/single-exit signal mode.
Trading Signal
Enables signal-based entries and exits when the MSI reaches predefined thresholds.
DCA Parameters
Entry Value
The MSI value that triggers a DCA buy event. When the MSI crosses below this value, the strategy considers it a favorable moment to deploy the saved capital.
Saved Amount
The amount of money set aside regularly (e.g., monthly) for investment. This simulates the DCA effect by accumulating capital and deploying it when conditions are optimal.
Data Inputs
Money Supply
The data source for the Money Supply Index (default: ECONOMICS:USM2).
Relational Symbol
The market instrument to compare against the money supply (default: NASDAQ_DLY:NDX). This allows the strategy to measure liquidity impact on a specific market.
Chart Display Options
You can toggle these metrics on the chart for better visualization:
Entry Price (green) – The price level of executed buys.
Cash Balance (yellow) – Remaining uninvested capital.
Invested Capital (red) – Total amount currently invested.
Current Value (blue) – The current valuation of the investment.
Profit (purple) – The total realized and unrealized profit.
Trades on Chart / Signal Labels / Quantity – Enables trade markers, signal text, and position size visualization.
📈 How the Strategy Works
1️⃣ DCA Mode
In DCA mode, the strategy simulates periodic savings and only invests when the MSI indicates favorable liquidity conditions (based on the Entry Value).
This approach aims to achieve the best possible average entry price over time — a powerful strategy for long-term investors seeking stable accumulation with reduced emotional bias.
2️⃣ Signal-Based Mode
In signal mode (with DCA disabled), the strategy performs one buy and one sell trade based on MSI turning points.
It’s most effective during bull markets, where liquidity expansion supports upward momentum.
This mode helps identify high-probability entry and exit zones rather than averaging in continuously.
💡 Additional Notes
This strategy includes helpful metrics to monitor your personal investment performance — showing invested capital, cash reserves, and profit in real-time.
The goal is to combine macroeconomic insight (money supply) with disciplined execution and capital management.
⚠️ Disclaimer
This strategy is for educational and research purposes only. It does not constitute financial advice. Always conduct your own analysis before making investment decisions.

S&P 500 & Normalized CAPE Z-Score AnalyzerThis macro-focused indicator visualizes the historical valuation of the U.S. equity market using the CAPE ratio (Shiller P/E), normalized over its long-term average and standard deviations. It helps traders and investors identify overvaluation and undervaluation zones over time, combining both statistical signals and historical context.
💡 Why It’s Useful
This indicator is ideal for macro traders and long-term investors looking to contextualize equity valuations across decades. It helps identify statistical extremes in valuation by referencing the standard deviation of the CAPE ratio relative to its long-term mean. The overlay of S&P 500 price with valuation zones provides a visual confirmation tool for macro decisions or timing insights.
It includes:
✅ Three display modes:
-S&P 500 (color-coded by CAPE valuation zone)
-Normalized CAPE (vs. long-term mean)
-CAPE Z-Score (standardized measure)
🎯 How to Interpret
Dynamic coloring of the S&P 500 price based on CAPE valuation:
🔴 Z > +2σ → Highly Overvalued
🟠 Z > +1σ → Overvalued
⚪ -1σ < Z < +1σ → Neutral
🟢 Z < -1σ → Undervalued
✅ Z < -2σ → Strong Buy Zone
-Live valuation label showing the current CAPE, Z-score, and zone.
-Macro event shading: major historical events (e.g. Great Depression, Oil Crisis, Dot-com Bubble, COVID Crash) are shaded on the chart for context.
✅ Built-in alerts:
CAPE > +2σ → Potential risk zone
CAPE < -2σ → Potential opportunity zone
📊 Use Cases
This indicator is ideal for:
🧠 Macro traders seeking long-term valuation extremes.
📈 Portfolio managers monitoring systemic valuation risk.
🏛️ Long-term investors timing strategic allocation shifts.
🧪 How It Works
CAPE ratio (Shiller PE) is retrieved from Quandl (MULTPL/SHILLER_PE_RATIO_MONTH).
The script calculates the long-term average and standard deviation of CAPE.
The Z-score is computed as:
(CAPE - Mean) / Standard Deviation
Users can switch between:
S&P 500 chart, color-coded by CAPE valuation zones.
Normalized CAPE, centered around zero (historic mean).
CAPE Z-score, showing statistical positioning directly.
Visual bands represent +1σ, +2σ, -1σ, -2σ thresholds.
You can switch between modes using the “Display” dropdown in the settings panel.
📊 Data Sources
CAPE: MULTPL/SHILLER_PE_RATIO_MONTH via Quandl
S&P 500: Monthly close prices of SPX (TradingView data)
All data updated on monthly resolution
This is not a repackaged built-in or autogenerated script. It’s a custom-built and interactive indicator designed for educational and analytical use in macroeconomic valuation studies.

FuTech : Earnings (All 269 Fundamental Metrics of Tradingview)FuTech : Earnings Indicator
The FuTech : Earnings Indicator is a revolutionary tool, offering the most comprehensive integration of all 269 fundamental financial metrics available from the TradingView platform.
This groundbreaking indicator is designed to empower financial researchers, traders, investors, and analysts with an unmatched depth of data, enabling superior analysis and decision-making.
Overview
"FuTech : Earnings Indicator" is the first-ever indicator to provide a holistic comparison of fundamental financial metrics for any stock, covering quarterly, yearly, and trailing twelve months (TTM) periods.
This tool brings together key financial data from income statements, balance sheets, cash flows, and other critical metrics found in company annual reports.
It also incorporates additional unique features like per-employee data, R&D expenses, and capital expenditures (CapEx), which are typically hidden within dense financial statements of Annual Reports.
---
Key Features and Capabilities
1. Comprehensive Financial Metrics
- "FuTech : Earnings Indicator" offers access to all 269 fundamental metrics available on TradingView platform. This includes widely used data such as revenue, profit margins, and EPS, alongside more niche metrics like R&D expenditure, employee efficiency, and financial scores developed by renowned analysts.
- Users can explore income statement data (e.g., net income, gross profit), balance sheet items (e.g., total assets, liabilities), cash flow metrics, and other financial statistics such as Altman Score, per employee expenses etc. in unparalleled detail.
2. Comparison Across Time Periods
- "FuTech : Earnings Indicator" allows users to analyze data for:
- Quarterly periods (e.g., Q1, Q2, Q3, Q4).
- Yearly comparisons for a broad historical view.
- TTM analysis to observe the most recent trends and developments.
- Users can select a minimum of 4 periods up to an unlimited range for detailed comparisons in both quarter.
3. Dynamic Data Display
- Users can select up to 5 key metrics alongside the stock price column to focus their analysis on the most relevant data points.
- Highlighting with green and red symbols offers an intuitive and visual representation:
- Green : Positive trends or improvements.
- Red : Negative trends or deteriorations.
4. Automated Averages
- "FuTech : Earnings Indicator" automatically calculates averages of selected metrics across the chosen periods. This feature helps users quickly identify performance trends and smooth out anomalies, enabling faster and more reliable research.
5. Designed for Research Excellence
- FuTech serves a wide audience, including:
- Corporate finance professionals who need a deep dive into financial metrics.
- Individual investors seeking robust tools for investment analysis.
- Broking companies and equity research analysts performing stock analysis.
- Traders looking to incorporate fundamental metrics into their strategies.
- Technical analysts seeking a better understanding of price behavior in relation to fundamentals.
- Fundamental research aspirants who want an edge in their learning process.
6. Unmatched Detail for Deeper Insights
- By pulling all 269 Financial metrics from the TradingView, "FuTech : Earnings Indicator" enables:
- Cross-comparison of a stock’s performance with its historical benchmarks.
- Evaluation of rare data like R&D expenses, CapEx trends, and employee efficiency ratios for enhanced investment insights.
- This ensures users can study stocks in greater depth than ever before.
7. Enhanced Usability
- Simple to use and visually appealing, "FuTech : Earnings Indicator" is designed with researchers in mind.
- Its intuitive interface ensures even novice users can navigate the wealth of data without feeling overwhelmed.
Applications of FuTech : Earnings Indicator
FuTech : Earnings Indicator is incredibly versatile and has applications in diverse fields of financial research and trading:
1. Corporate Finance
- Professionals in corporate finance can leverage "FuTech : Earnings Indicator" to benchmark company performance, study efficiency ratios, and evaluate financial health across various metrics.
2. Investors and Traders
- Long-term investors can use the tool to study the fundamental strengths of a stock before making buy-and-hold decisions.
- Traders can incorporate "FuTech : Earnings Indicator" into their analysis to align comprehensive fundamental trends with their targeted technical signals.
3. Equity Research Analysts
- Analysts can streamline their workflows by quickly identifying trends, outliers, and averages across large datasets.
4. Education and Research
- "FuTech : Earnings Indicator" is ideal for students and aspiring financial analysts who want a practical tool for understanding real-world data.
How FuTech : Earnings Indicator Stands Out
1. First-Ever Integration of All Financial Metrics
- It's an exclusive tool which offers the ability to explore all 269 financial metrics available on TradingView for a single stock research in-depth for quarters, years or TTM periods.
2. Period Customization
- Users have complete flexibility to select and analyze data across any range of time periods, allowing for customized insights tailored to specific research goals.
3. Data Visualization
- The intuitive use of color-coded symbols (green for positive trends, red for negative) makes complex data easy to interpret at a glance.
4. Actionable Insights
- The automated average calculations provide actionable insights for making informed decisions without manual computations.
5. Unique Metrics
- Metrics such as research and development costs, CapEx, and per-employee efficiency data offer unique angles that aren’t typically available in traditional analysis tools.
Why to Use FuTech : Earnings Indicator ?
1. Boost Your Research Power
- With FuTech, you can unlock a world of data that gives you the edge in analyzing stocks. Whether you’re a seasoned analyst or a beginner, this tool offers something for everyone.
2. Save Time and Effort
- The automated features and intuitive interface eliminate the need for time-consuming manual calculations and formatting.
3. Make Better Decisions
- "FuTech : Earnings Indicator's" detailed comparison capabilities and insightful visual aids allow for more accurate assessments of a stock’s performance and potential.
4. Broad Appeal
- From individual investors to financial institutions, FuTech is a valuable tool for anyone in the world of finance.
---
Conclusion
- The FuTech : Earnings Indicator is a must-have for anyone serious about financial analysis.
- It combines the depth of all 269 fundamental metrics with intuitive tools for comparison, visualization, and calculation.
- Designed for ease of use and powerful insights, FuTech : Earnings Indicator is set to transform the way financial data is analyzed and understood.
Thank you !
Jai Swaminarayan Dasna Das !
He Hari ! Bas Ek Tu Raji Tha !

Advanced Volume-Driven Breakout SignalsThe "Advanced Volume-Driven Breakout Signals" indicator is a cutting-edge tool designed to help traders identify high-potential trading opportunities through sophisticated volume analysis techniques. This indicator integrates volume flow analysis, moving averages, and Relative Volume (RVOL) to provide a comprehensive view of market conditions, going beyond traditional Volume Spread Analysis (VSA) methods.
Key Features:
Volume Flow Analysis: Distinguishes bullish and bearish volume flows with distinct colors, making it easier to visualize market sentiment and potential breakout points.
Volume Flow Moving Averages: Calculates moving averages for volume using various methods (SMA, EMA, WMA, HMA, VWMA), accommodating different trading strategies. This includes settings for adjusting the type of moving average and its period, as well as thresholds for high, medium, and low volume levels.
Volume Spikes Detection: Identifies significant volume spikes based on user-defined multipliers and moving averages, highlighting unusual trading activity.
Volume MA Cloud Settings: Computes general moving averages of volume to track trends and detect deviations. This feature includes options to select different moving average types and adjust thresholds for detecting high volume activity.
Relative Volume (RVOL): Measures current volume relative to historical averages, triggering signals when RVOL exceeds predefined thresholds, indicating notable changes in trading activity.
Entry Conditions: Provides clear long and short entry signals based on combined volume flow conditions and RVOL, offering actionable trading opportunities.
Volume Visualization:
— Bullish Volume Flow: Light and dark green bars indicate bullish volume flow.
— Bearish Volume Flow: Light and dark red bars denote bearish volume flow.
— High Volume Bars: Highlighted in yellow, and extreme volume bars in orange for additional context. These bars are plotted for visual aid and do not directly influence trade signals, focusing instead on the quality and strength of the volume flow.
Alerts: Allows users to create alert notifications for long and short entry signals when the criteria are met, enabling traders to respond promptly to trading opportunities.
Usage:
Overlay: Apply the indicator directly to your price chart to visualise real-time signals and volume conditions.
Customisable: Adjust settings for moving averages, RVOL, and other parameters to match your trading strategy and preferences.
Comparison to VSA Scripts: The "Advanced Volume-Driven Breakout Signals" indicator extends beyond traditional VSA scripts by incorporating a wider range of analytical features. While VSA primarily focuses on volume spread patterns and price action, this indicator offers enhanced functionality with advanced RVOL metrics, customizable moving averages, and detailed volume spike detection, making it a more versatile tool for identifying breakout opportunities and managing trades. It is particularly effective when used alongside key levels and order blocks.
Acknowledgements: Special thanks to @oh92 and @goofoffgoose for their invaluable scripts, which served as inspiration in the development of this advanced trading indicator.
Notes: The script is continually evolving, with ongoing refinements aimed at enhancing accuracy and performance.

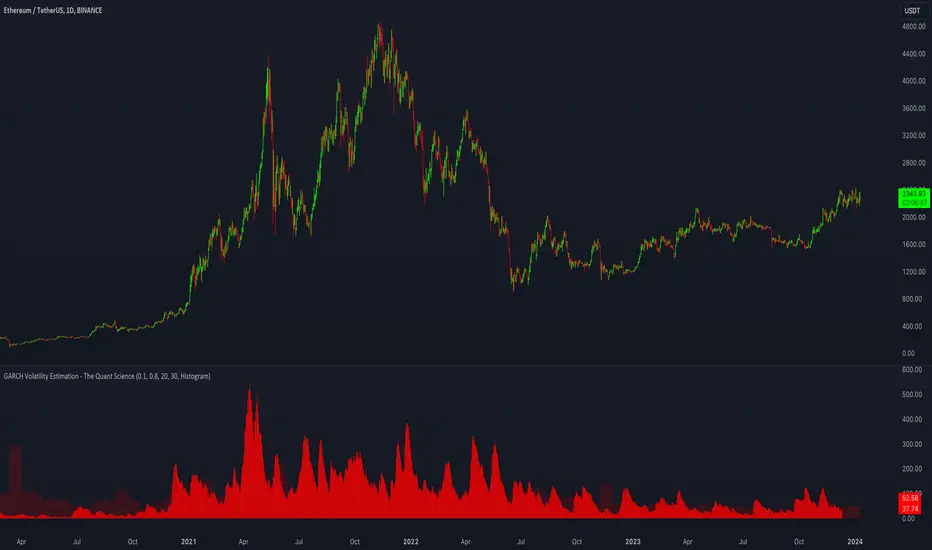
GARCH Volatility Estimation - The Quant ScienceThe GARCH (Generalized Autoregressive Conditional Heteroskedasticity) model is a statistical model used to forecast the volatility of a financial asset. This model takes into account the fluctuations in volatility over time, recognizing that volatility can vary in a heteroskedastic (i.e., non-constant variance) manner and can be influenced by past events.
The general formula of the GARCH model is:
σ²(t) = ω + α * ε²(t-1) + β * σ²(t-1)
where:
σ²(t) is the conditional variance at time t (i.e., squared volatility)
ω is the constant term (intercept) representing the baseline level of volatility
α is the coefficient representing the impact of the squared lagged error term on the conditional variance
ε²(t-1) is the squared lagged error term at the previous time period
β is the coefficient representing the impact of the lagged conditional variance on the current conditional variance
In the context of financial forecasting, the GARCH model is used to estimate the future volatility of the asset.
HOW TO USE
This quantitative indicator is capable of estimating the probable future movements of volatility. When the GARCH increases in value, it means that the volatility of the asset will likely increase as well, and vice versa. The indicator displays the relationship of the GARCH (bright red) with the trend of historical volatility (dark red).
USER INTERFACE
Alpha: select the starting value of Alpha (default value is 0.10).
Beta: select the starting value of Beta (default value is 0.80).
Lenght: select the period for calculating values within the model such as EMA (Exponential Moving Average) and Historical Volatility (default set to 20).
Forecasting: select the forecasting period, the number of bars you want to visualize data ahead (default set to 30).
Design: customize the indicator with your preferred color and choose from different types of charts, managing the design settings.