RSI DeviationAn oscillator which de-trends the Relative Strength Index. Rather, it takes a moving average of RSI and plots it's standard deviation from the MA, similar to a Bollinger %B oscillator. This seams to highlight short term peaks and troughs, Indicating oversold and overbought conditions respectively. It is intended to be used with a Dollar Cost Averaging strategy, but may also be useful for Swing Trading, or Scalping on lower timeframes.
When the line on the oscillator line crosses back into the channel, it signals a trade opportunity.
~ Crossing into the band from the bottom, indicates the end of an oversold condition, signaling a potential reversal. This would be a BUY signal.
~ Crossing into the band from the top, indicates the end of an overbought condition, signaling a potential reversal. This would be a SELL signal.
For ease of use, I've made the oscillator highlight the main chart when Overbought/Oversold conditions are occurring, and place fractals upon reversion to the Band. These repaint as they are calculated at close. The earliest trade would occur upon open of the following day.
I have set the default St. Deviation to be 2, but in my testing I have found 1.5 to be quite reliable. By decreasing the St. Deviation you will increase trade frequency, to a point, at the expense of efficiency.
Cheers
DJSnoWMan06
מדד חוזק יחסי (RSI)

HMA Crossover 1H with RSI, Stochastic RSI, and Trailing StopThe strategy script provided is a trading algorithm designed to help traders make informed buy and sell decisions based on certain technical indicators. Here’s a breakdown of what each part of the script does and how the strategy works:
Key Components:
Hull Moving Averages (HMA):
HMA 5: This is a Hull Moving Average calculated over 5 periods. HMAs are used to smooth out price data and identify trends more quickly than traditional moving averages.
HMA 20: This is another HMA but calculated over 20 periods, providing a broader view of the trend.
Relative Strength Index (RSI):
RSI 14: This is a momentum oscillator that measures the speed and change of price movements over a 14-period timeframe. It helps identify overbought or oversold conditions in the market.
Stochastic RSI:
%K: This is the main line of the Stochastic RSI, which combines the RSI and the Stochastic Oscillator to provide a more sensitive measure of overbought and oversold conditions. It is smoothed with a 3-period simple moving average.
Trading Signals:
Buy Signal:
Generated when the 5-period HMA crosses above the 20-period HMA, indicating a potential upward trend.
Additionally, the RSI must be below 45, suggesting that the market is not overbought.
The Stochastic RSI %K must also be below 39, confirming the oversold condition.
Sell Signal:
Generated when the 5-period HMA crosses below the 20-period HMA, indicating a potential downward trend.
The RSI must be above 60, suggesting that the market is not oversold.
The Stochastic RSI %K must also be above 63, confirming the overbought condition.
Trailing Stop Loss:
This feature helps protect profits by automatically selling the position if the price moves against the trade by 5%.
For sell positions, an additional trailing stop of 100 points is included.

Advanced Gold Scalping Strategy with RSI Divergence# Advanced Gold Scalping Strategy with RSI Divergence
## Overview
This Pine Script implements an advanced scalping strategy for gold (XAUUSD) trading, primarily designed for the 1-minute timeframe. The strategy utilizes the Relative Strength Index (RSI) indicator along with its moving average to identify potential trade setups based on divergences between price action and RSI movements.
## Key Components
### 1. RSI Calculation
- Uses a customizable RSI length (default: 60)
- Allows selection of the source for RSI calculation (default: close price)
### 2. Moving Average of RSI
- Supports multiple MA types: SMA, EMA, SMMA (RMA), WMA, VWMA, and Bollinger Bands
- Customizable MA length (default: 3)
- Option to display Bollinger Bands with adjustable standard deviation multiplier
### 3. Divergence Detection
- Implements both bullish and bearish divergence identification
- Uses pivot high and pivot low points to detect divergences
- Allows for customization of lookback periods and range for divergence detection
### 4. Entry Conditions
- Long Entry: Bullish divergence when RSI is below 40
- Short Entry: Bearish divergence when RSI is above 60
### 5. Trade Management
- Stop Loss: Customizable, default set to 11 pips
- Take Profit: Customizable, default set to 33 pips
### 6. Visualization
- Plots RSI line and its moving average
- Displays horizontal lines at 30, 50, and 70 RSI levels
- Shows Bollinger Bands when selected
- Highlights divergences with "Bull" and "Bear" labels on the chart
## Input Parameters
- RSI Length: Adjusts the period for RSI calculation
- RSI Source: Selects the price source for RSI (close, open, high, low, hl2, hlc3, ohlc4)
- MA Type: Chooses the type of moving average applied to RSI
- MA Length: Sets the period for the moving average
- BB StdDev: Adjusts the standard deviation multiplier for Bollinger Bands
- Show Divergence: Toggles the display of divergence labels
- Stop Loss: Sets the stop loss distance in pips
- Take Profit: Sets the take profit distance in pips
## Strategy Logic
1. **RSI Calculation**:
- Computes RSI using the specified length and source
- Calculates the chosen type of moving average on the RSI
2. **Divergence Detection**:
- Identifies pivot points in both price and RSI
- Checks for higher lows in RSI with lower lows in price (bullish divergence)
- Checks for lower highs in RSI with higher highs in price (bearish divergence)
3. **Trade Entry**:
- Enters a long position when a bullish divergence is detected and RSI is below 40
- Enters a short position when a bearish divergence is detected and RSI is above 60
4. **Position Management**:
- Places a stop loss order at the entry price ± stop loss pips (depending on the direction)
- Sets a take profit order at the entry price ± take profit pips (depending on the direction)
5. **Visualization**:
- Plots the RSI and its moving average
- Draws horizontal lines for overbought/oversold levels
- Displays Bollinger Bands if selected
- Shows divergence labels on the chart for identified setups
## Usage Instructions
1. Apply the script to a 1-minute XAUUSD (Gold) chart in TradingView
2. Adjust the input parameters as needed:
- Increase RSI Length for less frequent but potentially more reliable signals
- Modify MA Type and Length to change the sensitivity of the RSI moving average
- Adjust Stop Loss and Take Profit levels based on current market volatility
3. Monitor the chart for Bull (long) and Bear (short) labels indicating potential trade setups
4. Use in conjunction with other analysis and risk management techniques
## Considerations
- This strategy is designed for short-term scalping and may not be suitable for all market conditions
- Always backtest and forward test the strategy before using it with real capital
- The effectiveness of divergence-based strategies can vary depending on market trends and volatility
- Consider using additional confirmation signals or filters to improve the strategy's performance
Remember to adapt the strategy parameters to your risk tolerance and trading style, and always practice proper risk management.

RSI Sector analysis
Screening tool that produces a table with the various sectors and their RSI values. The values are shown in 3 rows, each with a user-defined length, and can be averaged out and displayed as a single value. The chart is color coded as well. Each ETF representing a sector can be looked at individually, with the top holdings in each preprogrammed, but users can define their own if they wish. The left most ticker is the "benchmark"; SPY is the benchmark for the various sectors, and the ETF is the benchmark for the tickers within.
Symbols are color coded: light blue text indicates that a symbol has greater RSI values in all three timeframes than the benchmark (the leftmost symbol). Orange text indicates that a symbol has a lower RSI value for all three timeframes. In the first row, light blue text indicates the largest RSI increase from the third row to the first row. Orange text indicates the largest RSI decrease from the third row to the first row.
A blue highlight indicates that the value is the highest among the tickers, excluding the benchmark, and an orange highlight indicates that the value is the lowest among the tickers, also excluding the benchmark. A blue highlight on the ticker indicates that it has the highest average value of the 3 rows, and a orange highlight on the ticker indicates that it has the lowest average value of the 3 rows.

Fusion MFI RSIHello fellas,
This superb indicator summons two monsters called Relative Strength Index (RSI) and Money Flow Index (MFI) and plays the Yu-Gi-Oh! card "Polymerization" to combine them.
Overview
The Fusion MFI RSI Indicator is an advanced analytical tool designed to provide a nuanced understanding of market dynamics by combining the Relative Strength Index (RSI) and the Money Flow Index (MFI). Enhanced with sophisticated smoothing techniques and the Inverse Fisher Transform (IFT), this indicator excels in identifying key market conditions such as overbought and oversold states, trends, and potential reversal points.
Key Features (Brief Overview)
Fusion of RSI and MFI: Integrates momentum and volume for a comprehensive market analysis.
Advanced Smoothing Techniques: Employs Hann Window, Jurik Moving Average (JMA), T3 Smoothing, and Super Smoother to refine signals.
Inverse Fisher Transform (IFT) Enhances the clarity and distinctiveness of indicator outputs.
Detailed Feature Analysis
Fusion of RSI and MFI
RSI (Relative Strength Index): Developed by J. Welles Wilder Jr., the RSI measures the speed and magnitude of directional price movements. Wilder recommended using a 14-day period and identified overbought conditions above 70 and oversold conditions below 30.
MFI (Money Flow Index): Created by Gene Quong and Avrum Soudack, the MFI combines price and volume to measure trading pressure. It is typically calculated using a 14-day period, with over 80 considered overbought and under 20 as oversold.
Application in Fusion: By combining RSI and MFI, the indicator leverages RSI's sensitivity to price changes with MFI's volume-weighted confirmation, providing a robust analysis tool. This combination is particularly effective in confirming the strength behind price movements, making the signals more reliable.
Advanced Smoothing Techniques
Hann Window: Traditionally used to reduce the abrupt data discontinuities at the edges of a sample, it is applied here to smooth the price data.
Jurik Moving Average (JMA): Known for preserving the timing and smoothness of the data, JMA reduces market noise effectively without significant lag.
T3 Smoothing: Developed to respond quickly to market changes, T3 provides a smoother response to price fluctuations.
Super Smoother: Filters out high-frequency noise while retaining important trends.
Application in Fusion: These techniques are chosen to refine the output of the combined RSI and MFI values, ensuring the indicator remains responsive yet stable, providing clearer and more actionable signals.
Inverse Fisher Transform (IFT):
Developed by John Ehlers, the IFT transforms oscillator outputs to enhance the clarity of extreme values. This is particularly useful in this fusion indicator to make critical turning points more distinct and actionable.
Mathematical Calculations for the Fusion MFI RSI Indicator
RSI (Relative Strength Index)
The RSI is calculated using the following steps:
Average Gain and Average Loss: First, determine the average gain and average loss over the specified period (typically 14 days). This is done by summing all the gains and losses over the period and then dividing each by the period.
Average Gain = (Sum of Gains over the past 14 periods) / 14
Average Loss = (Sum of Losses over the past 14 periods) / 14
Relative Strength (RS): This is the ratio of average gain to average loss.
RS = Average Gain / Average Loss
RSI: Finally, the RSI is calculated using the RS value:
RSI = 100 - (100 / (1 + RS))
MFI (Money Flow Index)
The MFI is calculated using several steps that incorporate both price and volume:
Typical Price: Calculate the typical price for each period.
Typical Price = (High + Low + Close) / 3
Raw Money Flow: Multiply the typical price by the volume for the period.
Raw Money Flow = Typical Price * Volume
Positive and Negative Money Flow: Compare the typical price of the current period to the previous period to determine if the money flow is positive or negative.
If today's Typical Price > Yesterday's Typical Price, then Positive Money Flow = Raw Money Flow; Negative Money Flow = 0
If today's Typical Price < Yesterday's Typical Price, then Negative Money Flow = Raw Money Flow; Positive Money Flow = 0
Money Flow Ratio: Calculate the ratio of the sum of Positive Money Flows to the sum of Negative Money Flows over the past 14 periods.
Money Flow Ratio = (Sum of Positive Money Flows over 14 periods) / (Sum of Negative Money Flows over 14 periods)
MFI: Finally, calculate the MFI using the Money Flow Ratio.
MFI = 100 - (100 / (1 + Money Flow Ratio))
Fusion of RSI and MFI
The final Fusion MFI RSI value could be calculated by averaging the IFT-transformed values of RSI and MFI, providing a single oscillator value that reflects both momentum and volume-weighted price action:
Fusion MFI RSI = (MFI weight * MFI) + (RSI weight * RSI)
Suggested Settings and Trading Rules
Original Usage
RSI: Wilder suggested buying when the RSI moves above 30 from below (enter long) and selling when the RSI moves below 70 from above (enter short). He recommended exiting long positions when the RSI reaches 70 or higher and exiting short positions when the RSI falls below 30.
MFI: Quong and Soudack recommended buying when the MFI is below 20 and starts rising (enter long), and selling when it is above 80 and starts declining (enter short). They suggested exiting long positions when the MFI reaches 80 or higher and exiting short positions when the MFI falls below 20.
Fusion Application
Settings: Use a 14-day period for this indicator's calculations to maintain consistency with the original settings suggested by the inventors.
Trading Rules:
Enter Long Signal: Consider entering a long position when both RSI and MFI are below their respective oversold levels and begin to rise. This indicates strong buying pressure supported by both price momentum and volume.
Exit Long Signal: Exit the long position when either RSI or MFI reaches its respective overbought threshold, suggesting a potential reversal or decrease in buying pressure.
Enter Short Signal: Consider entering a short position when both indicators are above their respective overbought levels and begin to decline, suggesting that selling pressure is mounting.
Exit Short Signal: Exit the short position when either RSI or MFI falls below its respective oversold threshold, indicating diminishing selling pressure and a potential upward reversal.
How to Use the Indicator
Select Source and Timeframe: Choose the data source and the timeframe for analysis.
Configure Fusion Settings: Adjust the weights for RSI and MFI.
Choose Smoothing Technique: Select and configure the desired smoothing method to suit the market conditions and personal preference.
Enable Fisherization: Optionally apply the Inverse Fisher Transform to enhance signal clarity.
Customize Visualization: Set up gradient coloring, background plots, and bands according to your preferences.
Interpret the Indicator: Use the Fusion value and visual cues to identify market conditions and potential trading opportunities.
Conclusion
The Fusion MFI RSI Indicator integrates classical and modern technical analysis concepts to provide a comprehensive tool for market analysis. By combining RSI and MFI with advanced smoothing techniques and the Inverse Fisher Transform, this indicator offers enhanced insights, aiding traders in making more informed and timely trading decisions. Customize the settings to align with your trading strategy and leverage this powerful tool to navigate financial markets effectively.
Best regards,
simwai
---
Credits to:
@loxx – T3
@everget – JMA
@cheatcountry – Hann Window

Statistical RSI Pivot Reversal Indicator [UAlgo]🔶 Idea
The "Statistical RSI Pivot Reversal Indicator " is designed to enhance traditional RSI analysis by incorporating statistical methods to identify potential reversal points more accurately. The core concept is to detect frequently occurring pivot points in the RSI data, which can indicate strong support or resistance levels. By analyzing the most frequent RSI values at these pivots, the script provides traders with clearer signals for potential market reversals, helping to improve the timing of entry and exit points in their trading strategies.
🔶 Key Features
Enhanced RSI Analysis:
This script calculates the Relative Strength Index (RSI) based on user-defined parameters and identifies pivot points in the RSI data. By analyzing these pivots, it detects the most frequently occurring RSI values at support and resistance levels.
Signal Filtering Options:
Filter buy and sell signals based on whether the RSI is in overbought (above 70) or oversold (below 30) conditions, enhancing the reliability of signals.
Visual and Alert Features:
Visual Signals: The script plots the RSI, the most frequent high and low RSI values, and buy/sell signals on the chart.
Alerts: Set up custom alerts for buy and sell conditions, ensuring you never miss a trading opportunity.
🔶 Disclaimer
The "Statistical RSI Pivot Reversal Indicator " script is intended for educational and informational purposes only.
It does not constitute financial advice or investment recommendations.
Trading financial instruments involves risk, and it is possible to lose more than your initial investment. Past performance is not indicative of future results.

Enhanced Reversal DetectionScript Description:
The "Enhanced Reversal Detection" indicator is a powerful tool designed to identify potential market reversals across various financial instruments. It incorporates a sophisticated algorithm that analyzes price action along with key technical indicators such as the Relative Strength Index (RSI), Bollinger Bands, and Moving Average (MA).
How to Use:
Adjustable Parameters: The indicator offers a range of adjustable parameters to cater to different trading preferences and market conditions.
RSI Length: Adjusts the length of the RSI calculation to fine-tune sensitivity.
Overbought Level: Sets the threshold for identifying overbought conditions on the RSI scale.
Oversold Level: Sets the threshold for identifying oversold conditions on the RSI scale.
Bollinger Bands Length: Determines the length of the Bollinger Bands calculation.
Bollinger Bands Multiplier: Adjusts the standard deviation multiplier for the Bollinger Bands, influencing band width.
Moving Average Length: Defines the length of the Moving Average calculation to capture trend direction.
Min Bars Between Signals: Sets the minimum number of bars required between consecutive reversal signals.
ADX Length: Adjusts the length of the Average Directional Index (ADX) calculation.
ADX Threshold: Defines the threshold value for ADX, serving as a filter for reversal signals.
Signal Generation: The indicator generates signals for both bullish and bearish reversals based on predefined criteria. A bullish reversal signal is triggered when the closing price exceeds the lower Bollinger Band and RSI falls below the oversold threshold. Conversely, a bearish reversal signal occurs when the closing price falls below the upper Bollinger Band and RSI surpasses the overbought threshold.
Alerts: Traders can opt to receive alerts for bullish and bearish reversal signals, enabling them to stay informed of potential trading opportunities even when away from the platform.
Publication Readiness:
To ensure readiness for publication in the TradingView public library, the script has been meticulously crafted and documented:
The code is extensively commented to provide clear explanations of parameters, calculations, and signal generation logic.
Best coding practices have been followed to enhance readability and maintainability.
Rigorous testing has been conducted to validate the accuracy and reliability of signal generation across various market conditions.
The script adheres to TradingView's guidelines and policies for script publication, ensuring compliance with platform standards and user expectations.
With its comprehensive features and user-friendly design, the "Enhanced Reversal Detection" indicator is poised to become a valuable asset for traders seeking to identify high-probability reversal opportunities in the financial markets.

Multi Timeframe Relative Strength Index {DCAquant}Overview
The Multi Timeframe Relative Strength Index (MTF RSI) is a powerful technical analysis tool designed to provide insights into market momentum and potential trend reversals across multiple timeframes. Leveraging the Relative Strength Index (RSI) formula, this indicator offers traders a comprehensive view of market sentiment and identifies overbought and oversold conditions.
Key Features
RSI Calculation:
Utilizes the standard RSI calculation formula to measure the magnitude of recent price changes and assess the strength of market trends.
Employs a user-defined length parameter to customize the sensitivity of the RSI calculation based on trading preferences.
Multiple Timeframe Analysis:
Allows traders to analyze RSI values across up to six different timeframes, ranging from minutes to days, providing a holistic perspective on market dynamics.
Calculates RSI values independently for each selected timeframe, enabling comparison and trend identification.
Threshold Levels:
Defines overbought and oversold levels to highlight potential reversal points in market trends.
Offers flexibility in adjusting threshold levels based on individual risk tolerance and trading strategies.
Neutral Zone:
Establishes upper and lower neutral thresholds to identify periods of consolidation or sideways movement in price.
Helps traders distinguish between trending and ranging market conditions for more accurate analysis.
Moving Average Smoothing:
Provides the option to apply moving average smoothing to aggregated RSI values for enhanced clarity and reduced noise.
Enables smoother visualization of RSI trends, facilitating easier interpretation for traders.
Visual Representation:
Plots the aggregated MTF RSI values on the price chart, allowing traders to visually assess market momentum and potential reversal points.
Utilizes color-coded backgrounds to indicate Long, Short, or Neutral conditions for quick identification.
Dynamic Table Display:
Displays trading signals alongside graphical indicators (rocket for Long, snowflake for Short, and star for Neutral) in a customizable table format.
Offers flexibility in table placement and size to accommodate user preferences.
How to Use:
Parameter Configuration:
Adjust the length parameter to fine-tune the sensitivity of the RSI calculation based on the desired timeframe and trading strategy.
Define overbought and oversold levels to identify potential reversal points in market trends.
Customize upper and lower neutral thresholds to differentiate between trending and ranging market conditions.
Interpretation:
Monitor the aggregated MTF RSI values plotted on the price chart for signals of overbought or oversold conditions.
Pay attention to color-coded backgrounds and graphical indicators in the table for actionable trading insights.
Trading Strategy:
Consider entering Long positions when the aggregated MTF RSI is above the upper neutral threshold, indicating potential bullish momentum.
Evaluate Short opportunities when the aggregated MTF RSI falls below the lower neutral threshold, signaling possible bearish momentum.
Exercise caution during Neutral conditions, as there may be uncertainty in market direction.
Risk Management:
Combine MTF RSI analysis with robust risk management strategies, including stop-loss and take-profit levels, to manage trading risks effectively.
Practice prudent risk management and trade within your risk tolerance to minimize potential losses.
Disclaimer
Trading in financial markets involves risk, and past performance is not indicative of future results. The use of the MTF RSI indicator does not guarantee profits or prevent losses. Traders should conduct their own analysis, exercise caution, and seek advice from qualified financial professionals before making trading decisions.

Multi-Chart Widget [LuxAlgo]The Multi-Chart Widget tool is a comprehensive solution crafted for traders and investors looking to analyze multiple financial instruments simultaneously. With the capability to showcase up to three additional charts, users can customize each chart by selecting different financial instruments, and timeframes.
Users can add various widely used technical indicators to the charts such as the relative strength index, Supertrend, moving averages, Bollinger Bands...etc.
🔶 USAGE
The tool offers traders and investors a comprehensive view of multiple charts simultaneously. By displaying up to three additional charts alongside the primary chart, users can analyze assets across different timeframes, compare their performance, and make informed decisions.
Users have the flexibility to choose from various customizable chart types, including the recently added "Volume Candles" option.
This tool allows adding to the chart some of the most widely used technical indicators, such as the Supertrend, Bollinger Bands, and various moving averages.
In addition to the charting capabilities, the tool also features a dynamic statistic panel that provides essential metrics and key insights into the selected assets. Users can track performance indicators such as relative strength, trend, and volatility, enabling them to identify trends, patterns, and trading opportunities efficiently.
🔶 DETAILS
A brief overview of the indicators featured in the statistic panel is given in the sub-section below:
🔹Dual Supertrend
The Dual Supertrend is a modified version of the Supertrend indicator, which is based on the concept of trend following. It generates buy or sell signals by analyzing the asset's price movement. The Dual Supertrend incorporates two Supertrend indicators with different parameters to provide potentially more accurate signals. It helps traders identify trend reversals and establish trend direction in a more responsive manner compared to a single Supertrend.
🔹Relative Strength Index
The Relative Strength Index is a momentum oscillator that measures the speed and change of price movements. RSI oscillates between 0 and 100 and is typically used to identify overbought or oversold conditions in a market. Traditionally, RSI values above 70 are considered overbought, suggesting that the asset may be due for a reversal or correction, while RSI values below 30 are considered oversold, indicating potential buying opportunities.
🔹Volatility
Volatility in trading refers to the degree of variation or fluctuation in the price of a financial instrument, such as a stock, currency pair, or commodity, over a certain period of time. It is a measure of the speed and magnitude of price changes and reflects the level of uncertainty or risk in the market. High volatility implies that prices are experiencing rapid and significant movements, while low volatility suggests that prices are relatively stable and are not changing much. Traders often use volatility as an indicator to assess the potential risk and return of an investment and to make informed decisions about when to enter or exit trades.
🔹R-Squared (R²)
R-squared, also known as the coefficient of determination, is a statistical measure that indicates the proportion of the variance in the dependent variable that is predictable from the independent variable(s). In other words, it quantifies the goodness of fit of a regression model to the observed data. R-squared values range from %0 to %100, with higher values indicating a better fit of the model to the data. An R-squared of 100% means that all movements of a security are completely explained by movements in the index, while an R-squared value of %0 indicates that the model does not explain any of the variability in the dependent variable.
In simpler terms, in investing, a high R-squared, from 85% to 100%, indicates that the stock’s or fund’s performance moves relatively in line with the index. Conversely, a low R-squared (around 70% or less) indicates that the fund's performance tends to deviate significantly from the movements of the index.
🔶 SETTINGS
🔹Mini Chart(s) Generic Settings
Mini Charts Separator: This option toggles the visibility of the separator lines.
Number Of Bars: Specifies the number of bars to be displayed for each mini chart.
Horizontal Offset: Determines the distance at which the mini charts will be displayed from the primary chart.
🔹Mini Chart Settings: Top - Middle - Bottom
Mini Chart Top/Middle/Bottom: Toggle the visibility of the selected mini chart.
Symbol: Choose the financial instrument to be displayed in the mini chart. If left as an empty string, it will default to the current chart instrument.
Timeframe: This option determines the timeframe used for calculating the mini charts. If a timeframe lower than the chart's timeframe is selected, the calculations will be based on the chart's timeframe.
Chart Type: Selection from various chart types for the mini charts, including candles, volume candles, line, area, columns, high-low, and Heikin Ashi.
Chart Size: Determines the size of the mini chart.
Technical Indicator: Selection from various technical indicators to be displayed on top of the mini charts.
Note : Chart sizing is relative to other mini charts. For example, If all the mini charts are sized to x5 relative to each other, the result will be the same as if they were all sized as x1. This is because the relative proportions between the mini charts remain consistent regardless of their absolute sizes. Therefore, their positions and sizes relative to each other remain unchanged, resulting in the same visual representation despite the differences in absolute scale.
🔹Supertrend Settings
ATR Length: is the lookback length for the ATR calculation.
Factor: is what the ATR is multiplied by to offset the bands from price.
Color: color customization option.
🔹Moving Average Settings
Type: is the type of the moving average, available types of moving averages include SMA (Simple Moving Average), EMA (Exponential Moving Average), RMA (Root Mean Square Moving Average), HMA (Hull Moving Average), WMA (Weighted Moving Average), and VWMA (Volume Weighted Moving Average).
Source: Determines what data from each bar will be used in calculations.
Length: The time period to be used in calculating the Moving Average.
Color: Color customization option.
🔹Bollinger Bands Settings
Basis Type: Determines the type of Moving Average that is applied to the basis plot line.
Source: Determines what data from each bar will be used in calculations.
Length: The time period to be used in calculating the Moving Average which creates the base for the Upper and Lower Bands.
StdDev: The number of Standard Deviations away from the Moving Average that the Upper and Lower Bands should be.
Color: Color customization options for basis, upper and lower bands.
🔹Mini Chart(s) Panel Settings
Mini Chart(s) Panel: Controls the visibility of the panel containing the mini charts.
Dual Supertrend: Toggles the display of the evaluated dual super trend, based on the super trend settings provided below the option. The definitions for the options are the same as stated above for the super trend.
Relative Strength Index: Toggles the display of the evaluated RSI, based on the source and length settings provided below the option.
Volatility: Toggles the display of the calculated Volatility, based on the length settings provided below the option.
R-Squared: Toggles the display of the calculated R-Squared (R²), based on the length settings provided below the option.
🔶 LIMITATIONS
The tool allows users to display mini charts featuring various types of instruments alongside the primary chart instrument. However, there's a limitation: the selected primary chart instrument must have an ACTIVE market status. Alternatively, if the primary chart instrument is not active, the mini chart instruments must belong to the same exchange and have the same type as the primary chart instrument.

RSI - Made EasyThis indicator is a visually improved version of RSI. It makes it much easier to see what's happening by simplifying those confusing, intersecting lines. With this, you can detect the RSI direction more clearly. All the features are also explained in the tooltips of the input fields. Some extra features are included, such as average top and bottom calculation, standard deviation and divergences.
Color legend:
Green: RSI Above MA and Rising
Light Green: RSI Above MA and Falling
Red: RSI Below MA and Falling
Light Red: RSI Below MA and Rising
Blue: RSI Crossover MA
Orange: RSI Crossunder MA
Blue Arrow: Bullish Divergence
Orange Arrow: Bearish Divergence
Korneev Reverse RSIRethinking the Legendary Relative Strength Index by John Welles Wilder
The essence of the new approach lies in the reverse use of the so-called "overbought" and "oversold" zones. In his 1978 book, "New Concepts in Technical Trading Systems," where the RSI mechanism was thoroughly described, Wilder writes that one way to use the oscillator is to open a long position when the RSI drops into oversold territory (below 30) and to open a short position when the RSI rises to overbought levels (above 70). However, backtesting this strategy with such inputs yields rather mediocre results.
Based on the calculation formula, the RSI calculates the rate of price change over a certain period. Therefore, overbought and oversold zones will have relative significance (relative to the set calculation period). It is no coincidence that the word "relative" was added to the name of the oscillator. It is worth accepting as an axiom the assertion that the price of an asset is fair at every moment in time.
Essentially, the RSI calculates the strength of a trend. If the oscillator value is above 70, it is highly likely that an upward movement is occurring in the market. Therefore, in the current strategy, a long position is opened precisely at the moment of greatest buyer strength (when RSI > 80), i.e., in the direction of the trend, since counter-trend trading with the RSI has proven to be ineffective. The position is closed after the buyers lose their advantage and the RSI drops to 40.
The strategy is recommended to be used only with long positions, as short positions show negative results. The strategy uses a moving average for the RSI with a period of 14 to smooth the oscillator data.
--------------------------------------------------------------------------------------------
Переосмысление легендарного осциллятора Relative strength index Джона Уэллса Уайлдера
Суть нового подхода заключается в реверсивном использовании так называемых зон "перекупленности" и "перепроданности". В своей книге от 1978 года "New concepts in tecnical trading systems", в которой был подробно описан механизм работы RSI, Уайлдер пишет, что один из способов использования осциллятора - открытие длинной позиции при снижении RSI в перепроданность (ниже 30) и открытие короткой позиции при повышении RSI до перекупленности (выше 70). Однако бэктест стратегии с такими вводными дает весьма посредственные результаты.
Исходя из формулы расчета, RSI рассчитывает скорость изменения цены за определенный период. Поэтому зоны перекупленности и перепроданности будут иметь относительное значение (относительно установленного периода расчета). Не зря ведь в названии осциллятора было добавлено слово "относительной". Стоит принять за аксиому утверждение, что цена актива справедлива в каждый момент времени.
По сути, RSI рассчитывает силу тренда. Если значение осциллятора выше 70, то на рынке с высокой долей вероятности происходит восходящее движение. Поэтому в текущей стратегии открытие лонга происходит именно в момент наибольшей силы покупателей (когда RSI > 80), то есть в сторону тренда, поскольку контртрендовая торговля по RSI показала свою несостоятельность. Закрытие позиции происходит после того, как покупатели теряют преимущество и RSI снижается до 40.
Стратегию рекомендуется использовать только с длинными позициями, поскольку короткие позиции показывают отрицательный результат. В стратегии используется скользящая средняя для RSI с периодом 14 для сглаживания данных осциллятора.

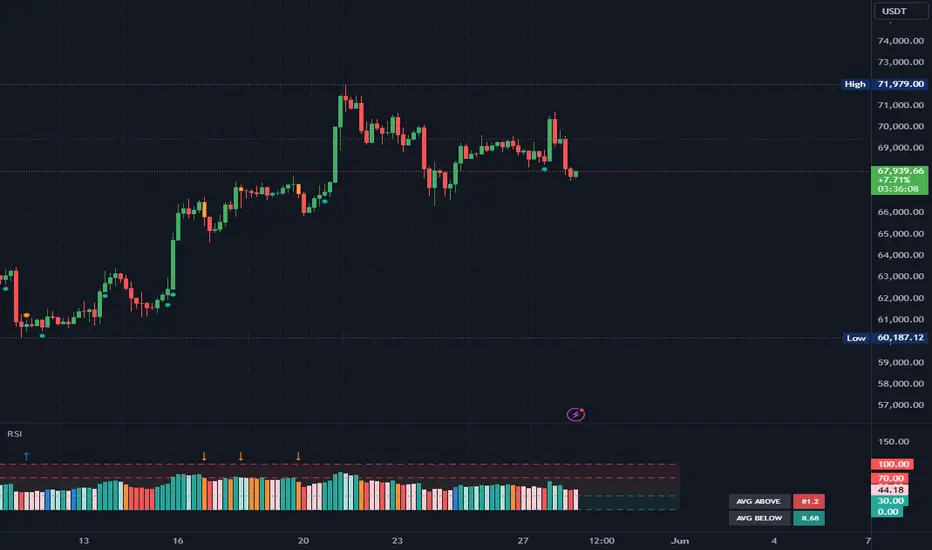
RSI Multiple TimeFrame, Version 1.0RSI Multiple TimeFrame, Version 1.0
Overview
The RSI Multiple TimeFrame script is designed to enhance trading decisions by providing a comprehensive view of the Relative Strength Index (RSI) across multiple timeframes. This tool helps traders identify overbought and oversold conditions more accurately by analyzing RSI values on different intervals simultaneously. This is particularly useful for traders who employ multi-timeframe analysis to confirm signals and make more informed trading decisions.
Unique Feature of the new script (described in detail below)
Multi-Timeframe RSI Analysis
Customizable Timeframes
Visual Signal Indicators (dots)
Overbought and Oversold Layers with gradual Background Fill
Enhanced Trend Confirmation
Originality and Usefulness
This script combines the RSI indicator across three distinct timeframes into a single view, providing traders with a multi-dimensional perspective of market momentum. It also provides associated signals to better time dips and peaks. Unlike standard RSI indicators that focus on a single timeframe, this script allows users to observe RSI trends across short, medium, and long-term intervals, thereby improving the accuracy of entry and exit signals. This is particularly valuable for traders looking to align their short-term strategies with longer-term market trends.
Signal Description
The script also includes a unique signal feature that plots green and red dots on the chart to highlight potential buy and sell opportunities:
Green Dots : These appear when all three RSI values are under specific thresholds (RSI of the shortest timeframe < 30, the medium timeframe < 40, and the longest timeframe < 50) and the RSI of the shortest timeframe is showing an upward trend (current value is greater than the previous value, and the value two periods ago is greater than the previous value). This indicates a potential buying opportunity as the market may be shifting from an oversold condition.
Red Dots : These appear when all three RSI values are above specific thresholds (RSI of the shortest timeframe > 70, the medium timeframe > 60, and the longest timeframe > 50) and the RSI of the shortest timeframe is showing a downward trend (current value is less than the previous value, and the value two periods ago is less than the previous value). This indicates a potential selling opportunity as the market may be shifting from an overbought condition.
These signals help traders identify high-probability turning points in the market by ensuring that momentum is aligned across multiple timeframes.
Detailed Description
Input Variables
RSI Period (`len`) : The number of periods to calculate the RSI. Default is 14.
RSI Source (`src`) : The price source for RSI calculation, defaulting to the average of the high and low prices (`hl2`).
Timeframes (`tf1`, `tf2`, `tf3`) : The different timeframes for which the RSI is calculated, defaulting to 5 minutes, 1 hour, and 8 hours respectively.
Functionality
RSI Calculations : The script calculates the RSI for each of the three specified timeframes using the `request.security` function. This allows the RSI to be plotted for multiple intervals, providing a layered view of market momentum.
```pine
rsi_tf1 = request.security(syminfo.tickerid, tf1, ta.rsi(src, len))
rsi_tf2 = request.security(syminfo.tickerid, tf2, ta.rsi(src, len))
rsi_tf3 = request.security(syminfo.tickerid, tf3, ta.rsi(src, len))
```
Plotting : The RSI values for the three timeframes are plotted with different colors and line widths for clear visual distinction. This makes it easy to compare RSI values across different intervals.
```pine
p1 = plot(rsi_tf1, title="RSI 5m", color=color.rgb(200, 200, 255), linewidth=2)
p2 = plot(rsi_tf2, title="RSI 1h", color=color.rgb(125, 125, 255), linewidth=2)
p3 = plot(rsi_tf3, title="RSI 8h", color=color.rgb(0, 0, 255), linewidth=2)
```
Overbought and Oversold Levels : Horizontal lines are plotted at standard RSI levels (20, 30, 40, 50, 60, 70, 80) to visually identify overbought and oversold conditions. The areas between these levels are filled with varying shades of blue for better visualization.
```pine
h80 = hline(80, title="RSI threshold 80", color=color.gray, linestyle=hline.style_dotted, linewidth=1)
h70 = hline(70, title="RSI threshold 70", color=color.gray, linestyle=hline.style_dotted, linewidth=1)
...
fill(h70, h80, color=color.rgb(33, 150, 243, 95), title="Background")
```
Signal Plotting : The script adds green and red dots to indicate potential buy and sell signals, respectively. A green dot is plotted when all RSI values are under specific thresholds and the RSI of the shortest timeframe is rising. Conversely, a red dot is plotted when all RSI values are above specific thresholds and the RSI of the shortest timeframe is falling.
```pine
plotshape(series=(rsi_tf1 < 30 and rsi_tf2 < 40 and rsi_tf3 < 50 and (rsi_tf1 > rsi_tf1 ) and (rsi_tf1 > rsi_tf1 )) ? 1 : na, location=location.bottom, color=color.green, style=shape.circle, size=size.tiny)
plotshape(series=(rsi_tf1 > 70 and rsi_tf2 > 60 and rsi_tf3 > 50 and (rsi_tf1 < rsi_tf1 ) and (rsi_tf1 < rsi_tf1 )) ? 1 : na, location=location.top, color=color.red, style=shape.circle, size=size.tiny)
```
How to Use
Configuring Inputs : Adjust the RSI period and source as needed. Modify the timeframes to suit your trading strategy.
Interpreting the Indicator : Use the plotted RSI values to gauge momentum across different timeframes. Look for overbought conditions (RSI above 70, 60 and 50) and oversold conditions (RSI below 30, 40 and 50) across multiple intervals to confirm trade signals.
Signal Confirmation : Pay attention to the green and red dots that provide signals to better time dips and peaks. dots are printed when the lower timeframe (5mn by default) shows sign of reversal.
These signals are more reliable when confirmed across all three timeframes.
This script provides a nuanced view of RSI, helping traders make more informed decisions by considering multiple timeframes simultaneously. By combining short, medium, and long-term RSI values, traders can better align their strategies with overarching market trends, thus improving the precision of their trading actions.

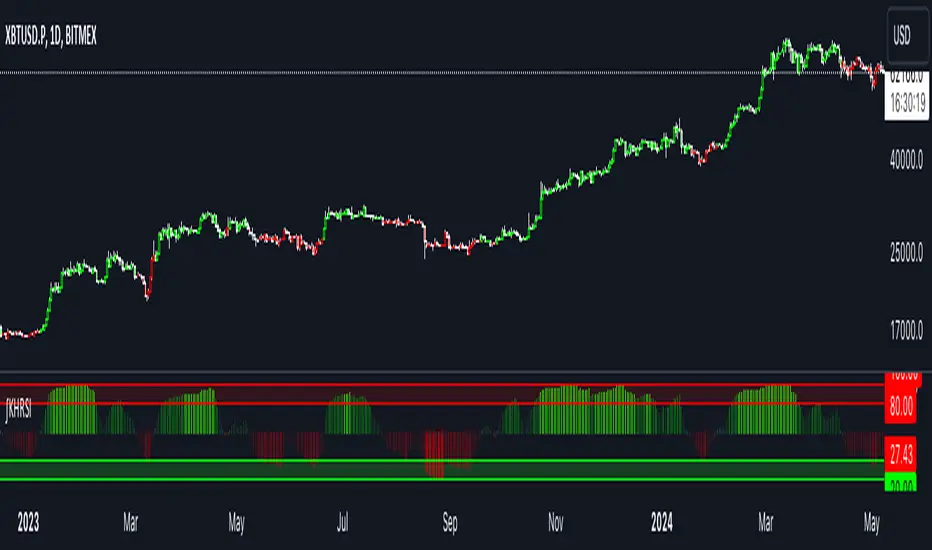
Wall Street Cheat Sheet IndicatorThe Wall Street Cheat Sheet Indicator is a unique tool designed to help traders identify the psychological stages of the market cycle based on the well-known Wall Street Cheat Sheet. This indicator integrates moving averages and RSI to dynamically label market stages, providing clear visual cues on the chart.
Key Features:
Dynamic Stage Identification: The indicator automatically detects and labels market stages such as Disbelief, Hope, Optimism, Belief, Thrill, Euphoria, Complacency, Anxiety, Denial, Panic, Capitulation, Anger, and Depression. These stages are derived from the emotional phases of market participants, helping traders anticipate market movements.
Technical Indicators: The script uses two key technical indicators:
200-day Simple Moving Average (SMA): Helps identify long-term market trends.
50-day Simple Moving Average (SMA): Aids in recognizing medium-term trends.
Relative Strength Index (RSI): Assesses the momentum and potential reversal points based on overbought and oversold conditions.
Clear Visual Labels: The current market stage is displayed directly on the chart, making it easy to spot trends and potential turning points.
Usefulness:
This indicator is not just a simple mashup of existing tools. It uniquely combines the concept of market psychology with practical technical analysis tools (moving averages and RSI). By labeling the psychological stages of the market cycle, it provides traders with a deeper understanding of market sentiment and potential future movements.
How It Works:
Disbelief: Detected when the price is below the 200-day SMA and RSI is in the oversold territory, indicating a potential bottom.
Hope: Triggered when the price crosses above the 50-day SMA, with RSI starting to rise but still below 50, suggesting an early uptrend.
Optimism: Occurs when the price is above the 50-day SMA and RSI is between 50 and 70, indicating a strengthening trend.
Belief: When the price is well above the 50-day SMA and RSI is between 70 and 80, showing strong bullish momentum.
Thrill and Euphoria: Identified when RSI exceeds 80, indicating overbought conditions and potential for a peak.
Complacency to Depression: These stages are identified based on price corrections and drops relative to moving averages and declining RSI values.
Best Practices:
High-Time Frame Focus: This indicator works best on high-time frame charts, specifically the 1-week Bitcoin (BTCUSDT) chart. The longer time frame provides a clearer picture of the overall market cycle and reduces noise.
Trend Confirmation: Use in conjunction with other technical analysis tools such as trendlines, Fibonacci retracement levels, and support/resistance zones for more robust trading strategies.
How to Use:
Add the Indicator: Apply the Wall Street Cheat Sheet Indicator to your TradingView chart.
Analyze Market Stages: Observe the dynamic labels indicating the current stage of the market cycle.
Make Informed Decisions: Use the insights from the indicator to time your entries and exits, aligning your trades with the market sentiment.
This indicator is a valuable tool for traders looking to understand market psychology and make informed trading decisions based on the stages of the market cycle.

Triple EMA + QQE Trend Following Strategy [TradeDots]The "Triple EMA + QQE Trend Following Strategy" harnesses the power of two sophisticated technical indicators, the Triple Exponential Moving Average (TEMA) and the Qualitative Quantitative Estimation (QQE), to generate precise buy and sell signals. This strategy excels in capturing shifts in trends by identifying short-term price momentum and dynamic overbought or oversold conditions.
HOW IT WORKS
This strategy integrates two pivotal indicators:
Triple Exponential Moving Average (TEMA): TEMA enhances traditional moving averages by reducing lag and smoothing the data more effectively. It achieves this by applying the EMA formula three times onto the price, as follows:
tema(src, length) =>
ema1 = ta.ema(src, length)
ema2 = ta.ema(ema1, length)
ema3 = ta.ema(ema2, length)
tema = 3*ema1 - 3*ema2 + ema3
This computation helps to sharpen the sensitivity to price movements.
Qualitative Quantitative Estimation (QQE): The QQE indicator improves upon the standard RSI by incorporating a smoothing mechanism. It starts with the standard RSI, overlays a 5-period EMA on this RSI, and then enhances the result using a double application of a 27-period EMA. A slow trailing line is then derived by multiplying the result with a factor number. This approach establishes a more refined and less jittery trend-following signal, complementing the TEMA to enhance overall market timing during fluctuating conditions.
APPLICATION
Referenced from insights on "Trading Tact," the strategy implementation follows:
First of all, we utilize two TEMA lines: one set at a 20-period and the other at a 40-period. Then following the rules below:
40-period TEMA is rising
20-period TEMA is above 40-period TEMA
Price closes above 20-period TEMA
Today is not Monday
RSI MA crosses the Slow trailing line
This strategy does not employ an active take profit mechanism; instead, it utilizes a trailing stop loss to allow the price to reach the stop loss naturally, thereby maximizing potential profit margins.
DEFAULT SETUP
Commission: 0.01%
Initial Capital: $10,000
Equity per Trade: 80%
Users are advised to adjust and personalize this trading strategy to better match their individual trading preferences and style.
RISK DISCLAIMER
Trading entails substantial risk, and most day traders incur losses. All content, tools, scripts, articles, and education provided by TradeDots serve purely informational and educational purposes. Past performances are not definitive predictors of future results.
Reference:
Trading Tact. What Is the QQE Indicator? Retrieved from: tradingtact.com

Market Cipher B by WeloTradesMarket Cipher B by WeloTrades: Detailed Script Description
//Overview//
"Market Cipher B by WeloTrades" is an advanced trading tool that combines multiple technical indicators to provide a comprehensive market analysis framework. By integrating WaveTrend, RSI, and MoneyFlow indicators, this script helps traders to better identify market trends, potential reversals, and trading opportunities. The script is designed to offer a holistic view of the market by combining the strengths of these individual indicators.
//Key Features and Originality//
WaveTrend Analysis:
WaveTrend Channel (WT1 and WT2): The core of this script is the WaveTrend indicator, which uses the smoothed average of typical price to identify overbought and oversold conditions. WT1 and WT2 are calculated to track market momentum and cyclical price movements.
Major Divergences (🐮/🐻): The script detects and highlights major bullish and bearish divergences automatically, providing traders with visual cues for potential reversals. This helps in making informed decisions based on divergence patterns.
Relative Strength Index (RSI):
RSI Levels: RSI is used to measure the speed and change of price movements, with specific levels indicating overbought and oversold conditions.
Customizable Levels: Users can configure the overbought and oversold thresholds, allowing for a tailored analysis based on individual trading strategies.
MoneyFlow Indicator:
Fast and Slow MoneyFlow: This indicator tracks the flow of capital into and out of the market, offering insights into the underlying market strength. It includes configurable periods and multipliers for both fast and slow MoneyFlow.
Vertical Positioning: The script allows users to adjust the vertical position of MoneyFlow plots to maintain a clear and uncluttered chart.
Stochastic RSI:
Stochastic RSI Levels: This combines the RSI and Stochastic indicators to provide a momentum oscillator that is sensitive to price changes. It is used to identify overbought and oversold conditions within a specified period.
Customizable Levels: Traders can set specific levels for more precise analysis.
//How It Works//
The script integrates these indicators through advanced algorithms, creating a synergistic effect that enhances market analysis. Here’s a detailed explanation of the underlying concepts and calculations:
WaveTrend Indicator:
Calculation: WaveTrend is based on the typical price (average of high, low, and close) smoothed over a specified channel length. WT1 and WT2 are derived from this typical price and further smoothed using the Average Channel Length. The difference between WT1 and WT2 indicates momentum, helping to identify cyclical market trends.
RSI (Relative Strength Index):
Calculation: RSI calculates the average gains and losses over a specified period to measure the speed and change of price movements. It oscillates between 0 and 100, with levels set to identify overbought (>70) and oversold (<30) conditions.
MoneyFlow Indicator:
Calculation: MoneyFlow is derived by multiplying price changes by volume and smoothing the results over specified periods. Fast MoneyFlow reacts quickly to price changes, while Slow MoneyFlow offers a broader view of capital movement trends.
Stochastic RSI:
Calculation: Stochastic RSI is computed by applying the Stochastic formula to RSI values, which highlights the RSI’s relative position within its range over a given period. This helps in identifying momentum shifts more precisely.
//How to Use the Script//
Display Settings:
Users can enable or disable various components like WaveTrend OB & OS levels, MoneyFlow plots, and divergence alerts through checkboxes.
Example: Turn on "Show Major Divergence" to see major bullish and bearish divergence signals directly on the chart.
Adjust Channel Settings:
Customize the data source, channel length, and smoothing periods in the "WaveTrend Channel SETTINGS" group.
Example: Set the "Channel Length" to 10 for a more responsive WaveTrend line or adjust the "Average Channel Length" to 21 for smoother trends.
Set Overbought & Oversold Levels:
Configure levels for WaveTrend, RSI, and Stochastic RSI in their respective settings groups.
Example: Set the WaveTrend Overbought Level to 60 and Oversold Level to -60 to define critical thresholds.
Money Flow Settings:
Adjust the periods and multipliers for Fast and Slow MoneyFlow indicators, and set their vertical positions for better visualization.
Example: Set the Fast Money Flow Period to 9 and Slow Money Flow Period to 12 to capture both short-term and long-term capital movements.
//Justification for Combining Indicators//
Enhanced Market Analysis:
Combining WaveTrend, RSI, and MoneyFlow provides a more comprehensive view of market conditions. Each indicator brings a unique perspective, making the analysis more robust.
WaveTrend identifies cyclical trends, RSI measures momentum, and MoneyFlow tracks capital movement. Together, they provide a multi-dimensional analysis of the market.
Improved Decision-Making:
By integrating these indicators, the script helps traders make more informed decisions. For example, a bullish divergence detected by WaveTrend might be validated by an RSI moving out of oversold territory and supported by increasing MoneyFlow.
Customization and Flexibility:
The script offers extensive customization options, allowing traders to tailor it to their specific needs and strategies. This flexibility makes it suitable for different trading styles and timeframes.
//Conclusion//
The indicator stands out due to its innovative combination of WaveTrend, RSI, and MoneyFlow indicators, offering a well-rounded tool for market analysis. By understanding how each component works and how they complement each other, traders can leverage this script to enhance their market analysis and trading strategies, making more informed and confident decisions.
Remember to always backtest the indicator first before implying it to your strategy.

RSI Screener / Heatmap - By LeviathanThis script allows you to quickly scan the market by displaying the RSI values of up to 280 tickers at once and visualizing them in an easy-to-understand format using labels with heatmap coloring.
📊 Source
The script can display the RSI from a custom timeframe (MTF) and custom length for the following data:
- Price
- OBV (On Balance Volume)
- Open Interest (for crypto tickers)
📋 Ticker Selection
This script uses a different approach for selecting tickers. Instead of inputting them one by one via input.symbol(), you can now copy-paste or edit a list of tickers in the text area window. This approach allows users to easily exchange ticker lists between each other and, for example, create multiple lists of tickers by sector, market cap, etc., and easily input them into the script. Full credit to @allanster for his functions for extracting tickers from the text. Users can switch between 7 groups of 40 tickers each, totaling 280 tickers.
🖥️ Display Types
- Screener with Labels: Each ticker has its own color-coded label located at its RSI value.
- Group Average RSI: A standard RSI plot that displays the average RSI of all tickers in the group.
- RSI Heatmap (coming soon): Color-coded rows displaying current and historical values of tickers.
- RSI Divergence Heatmap (coming soon): Color-coded rows displaying current and historical regular/hidden bullish/bearish divergences for tickers.
🎨 Appearance
Appearance is fully customizable via user inputs, allowing you to change heatmap/gradient colors, zone coloring, and more.

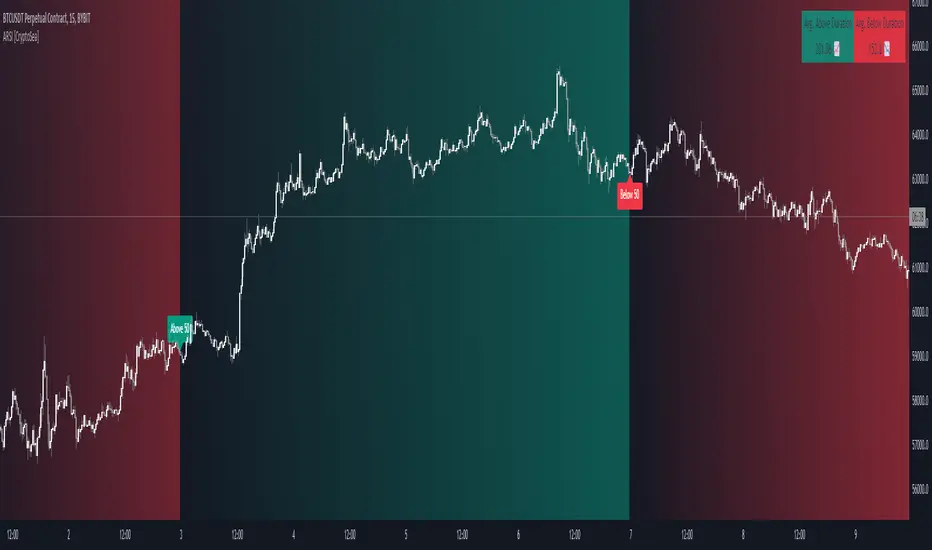
Advanced RSI [CryptoSea]The Advanced RSI Duration (ARSI) is a unique tool crafted to deepen your market insights by focusing on the duration the Relative Strength Index (RSI) spends above or below key thresholds. This innovative approach is designed to help traders anticipate potential market reversals by observing sustained overbought and oversold conditions.
Core Feature
Duration Monitoring ARSI's standout feature is its ability to track how long the RSI remains in overbought (>70) or oversold (<30) conditions. By quantifying these durations, traders can gauge the strength of current market trends and the likelihood of reversals.
Enhanced Functionality
Multi-Timeframe Flexibility : Analyze the RSI duration from any selected timeframe on your current chart, offering a layered view of market dynamics.
Customizable Alerts : Receive notifications when the RSI maintains its position above or below set levels for an extended period, signaling sustained market pressure.
Visual Customization : Adjust the visual elements, including colors for overbought and oversold durations, to match your analytical style and preferences.
Label Management : Control the frequency of labels marking RSI threshold crossings, ensuring clarity and focus on significant market events.
Settings Overview
RSI Timeframe & Length : Tailor the RSI calculation to fit your analysis, choosing from various timeframes and period lengths.
Threshold Levels : Define what you consider overbought and oversold conditions with customizable upper and lower RSI levels.
Duration Alert Threshold : Set a specific bar count for how long the RSI should remain beyond these thresholds to trigger an alert.
Visualization Options : Choose distinct colors for durations above and below thresholds, and adjust label visibility to suit your charting approach.
Application & Strategy
Use ARSI to identify potential turning points in the market
Trend Exhaustion : Extended periods in overbought or oversold territories may indicate a strong trend but also warn of possible exhaustion and impending reversals.
Comparative Analysis : By evaluating the current duration against historical averages, traders can assess the relative strength of ongoing market conditions.
Strategic Entries/Exits : Utilize duration insights to refine entry and exit points, capitalizing on the predictive nature of prolonged RSI levels.
Alert Conditions
The Advanced RSI (ARSI) offers critical alert mechanisms to aid traders in identifying prolonged market conditions that could lead to actionable trading opportunities. These conditions are designed to alert traders when the RSI remains at extremes longer than typical durations, signaling sustained market behaviors.
Above Upper Level Alert: This alert is triggered when the RSI sustains above the upper threshold (usually 70) for more than the configured duration, indicating strong bullish momentum or potential overbought conditions.
Below Lower Level Alert: Similarly, this alert is activated when the RSI stays below the lower threshold (commonly 30) for an extended period, suggesting significant bearish momentum or potential oversold conditions.
These alerts enable traders to respond swiftly to extend market conditions, enhancing their strategy by providing timely insights into potential trend reversals or continuations.
The Advanced RSI Duration Analysis empowers traders with a nuanced understanding of market states, beyond mere RSI values. It highlights the significance of how long markets remain in extreme conditions, offering a predictive edge in anticipating reversals. Whether you're strategizing entries or preparing for shifts in market momentum, ARSI is your companion for informed trading decisions.
Dual RSI Differential - Strategy [presentTrading]█ Introduction and How it is Different
The Dual RSI Differential Strategy introduces a nuanced approach to market analysis and trading decisions by utilizing two Relative Strength Index (RSI) indicators calculated over different time periods. Unlike traditional strategies that employ a single RSI and may signal premature or delayed entries, this method leverages the differential between a shorter and a longer RSI. This approach pinpoints more precise entry and exit points, providing a refined tool for traders to exploit market conditions effectively, particularly in overbought and oversold scenarios.
Most important: it is a good eductional code for swing trading.
For beginners, this Pine Script provides a complete function that includes crucial elements such as holding days and the option to configure take profit/stop loss settings:
- Hold Days: This feature ensures that trades are not exited too hastily, helping traders to ride out short-term market volatility. It's particularly valuable for swing trading where maintaining positions slightly longer can lead to capturing significant trends.
- TPSL Condition (None by default): This setting allows traders to focus solely on the strategy's robust entry and exit signals without being constrained by preset profit or loss limits. This flexibility is crucial for learning to adjust strategy settings based on personal risk tolerance and market observations.
BTCUSD 6h LS Performance
█ Strategy, How It Works: Detailed Explanation
🔶 RSI Calculation:
The RSI is a momentum oscillator that measures the speed and change of price movements. It is calculated using the formula:
RSI = 100 - (100 / (1 + RS))
Where RS (Relative Strength) = Average Gain of up periods / Average Loss of down periods.
🔶 Dual RSI Setup:
This strategy involves two RSI indicators:
RSI_Short (RSI_21): Calculated over a short period (21 days).
RSI_Long (RSI_42): Calculated over a longer period (42 days).
Differential Calculation:
The strategy focuses on the differential between these two RSIs:
RSI Differential = RSI_Long - RSI_Short
This differential helps to identify when the shorter-term sentiment diverges from longer-term trends, signaling potential trading opportunities.
BTCUSD Local picuture
🔶 Signal Triggers:
Entry Signal: A buy (long) signal is triggered when the RSI Differential exceeds -5, suggesting strengthening short-term momentum. Conversely, a sell (short) signal occurs when the RSI Differential falls below +5, indicating weakening short-term momentum.
Exit Signal: Trades are generally exited when the RSI Differential reverses past these thresholds, indicating a potential momentum shift.
█ Trade Direction
This strategy accommodates various trading preferences by allowing selections among long, short, or both directions, thus enabling traders to capitalize on diverse market movements and volatility.
█ Usage
The Dual RSI Differential Strategy is particularly suited for:
Traders who prefer a systematic approach to capture market trends.
Those who seek to minimize risks associated with rapid and unexpected market movements.
Traders who value strategies that can be finely tuned to different market conditions.
█ Default Settings
- Trading Direction: Both — allows capturing of upward and downward market movements.
- Short RSI Period: 21 days — balances sensitivity to market movements.
- Long RSI Period: 42 days — smoothens out longer-term fluctuations to provide a clearer market trend.
- RSI Difference Level: 5 — minimizes false signals by setting a moderate threshold for action.
Use Hold Days: True — introduces a temporal element to trading strategy, holding positions to potentially enhance outcomes.
- Hold Days: 5 — ensures that trades are not exited too hastily, helping to ride out short-term volatility.
- TPSL Condition: None — enables traders to focus solely on the strategy's entry and exit signals without preset profit or loss limits.
- Take Profit Percentage: 15% — aims for significant market moves to lock in profits.
- Stop Loss Percentage: 10% — safeguards against large losses, essential for long-term capital preservation.

RSI Momentum Waves [Quantigenics]RSI Momentum Waves Indicator
The RSI Momentum Waves Indicator is your intuitive tool for visualizing market strength and trend persistence. It refines the classic RSI by smoothing the data with Exponential Moving Averages (EMAs), which help clear out the noise to give you a more accurate picture of where the market’s heading. The parameters - RSI Period, Smoothing Period, Overbought, Oversold, Upper Neutral Zone, and Lower Neutral Zone - are all adjustable, so you can tailor the indicator to different market conditions or your trading style.
How It Works:
RSI Period (RsiPer): Adjusts how far back the RSI looks to calculate its value, affecting its sensitivity.
Smoothing Period (SmoothPer): Dictates how smooth the EMA lines are, balancing between sensitivity and noise reduction.
Overbought (OBLevel) / Oversold (OSLevel) Levels: Set the thresholds where the market might be too stretched in either direction and due for a reversal.
Neutral Zones (UpperNZ / LowerNZ): Define the areas where the market is considered neutral, and trend strength is less clear.
Trading Instructions:
Use the RSI Momentum Waves to gain insights into the market’s momentum and make informed decisions:
For Trend Identification: If the waves are consistently above the 50 line and climbing, the market may be bullish; if below and declining, bearish signals are suggested.
Overbought and Oversold Regions: Entering these areas might indicate a potential reversal. A peak and downturn in the overbought region can signal a sell, while a trough and upturn in the oversold region can indicate a buy.
Neutral Zone Caution: In the neutral zones, exercise caution and wait for a breakout in either direction for stronger signals.
Confirm with Other Analysis: Never rely solely on one indicator. Confirm the RSI Momentum Waves signals with other technical indicators or fundamental analysis for best practices.
Remember, the goal is to detect the rhythm of the market’s momentum and act accordingly. Happy trading!

Kalman Hull RSI [BackQuant]Kalman Hull RSI
At its core, this indicator uses a Kalman filter of price, put inside of a hull moving average function (replacing the weighted moving averages) and then using that as a price source for the the RSI, very similar to the Kalman Hull Supertrend just processing price for a different indicator.
This also allows it to make it more adaptive to price and also sensitive to recent price action. This indicator is also mainly built for trend-following systems
PLEASE Read the following, knowing what an indicator does at its core before adding it into a system is pivotal. The core concepts can allow you to include it in a logical and sound manner.
1. What is a Kalman Filter
The Kalman Filter is an algorithm renowned for its efficiency in estimating the states of a linear dynamic system amidst noisy data. It excels in real-time data processing, making it indispensable in fields requiring precise and adaptive filtering, such as aerospace, robotics, and financial market analysis. By leveraging its predictive capabilities, traders can significantly enhance their market analysis, particularly in estimating price movements more accurately.
If you would like this on its own, with a more in-depth description please see our Kalman Price Filter.
OR our Kalman Hull Supertrend
2. Hull Moving Average (HMA) and Its Core Calculation
The Hull Moving Average (HMA) improves on traditional moving averages by combining the Weighted Moving Average's (WMA) smoothness and reduced lag. Its core calculation involves taking the WMA of the data set and doubling it, then subtracting the WMA of the full period, followed by applying another WMA on the result over the square root of the period's length. This methodology yields a smoother and more responsive moving average, particularly useful for identifying market trends more rapidly.
3. Combining Kalman Filter with HMA
The innovative combination of the Kalman Filter with the Hull Moving Average (KHMA) offers a unique approach to smoothing price data. By applying the Kalman Filter to the price source before its incorporation into the HMA formula, we enhance the adaptiveness and responsiveness of the moving average. This adaptive smoothing method reduces noise more effectively and adjusts more swiftly to price changes, providing traders with clearer signals for market entries or exits.
The calculation is like so:
KHMA(_src, _length) =>
f_kalman(2 * f_kalman(_src, _length / 2) - f_kalman(_src, _length), math.round(math.sqrt(_length)))
Use Case
The Kalman Hull RSI is particularly suited for traders who require a highly adaptive indicator that can respond to rapid market changes without the excessive noise associated with typical RSI calculations. It can be effectively used in markets with high volatility where traditional indicators might lag or produce misleading signals.
Application in a Trading System
The Kalman Hull RSI is versatile in application, suitable for:
Trend Identification: Quickly identify potential reversals or confirmations of existing trends.
Overbought/Oversold Conditions: Utilize the dynamic RSI thresholds to pinpoint potential entry and exit points, adapting to current market conditions.
Risk Management: Enhance trading strategies by integrating a more reliable measure of momentum, which can lead to improved stop-loss placements and exit strategies.
Core Calculations and Benefits
Dynamic State Estimation: By applying the Kalman Filter, the indicator continually adjusts its calculations based on incoming price data, providing a real-time, smoothed response to price movements.
Reduced Lag: The integration with HMA significantly reduces lag, offering quicker responses to price changes than traditional moving averages or RSI alone.
Increased Accuracy: The dual filtering effect minimizes the impact of price spikes and noise, leading to more accurate signaling for trades.
Thus following all of the key points here are some sample backtests on the 1D Chart
Disclaimer: Backtests are based off past results, and are not indicative of the future.
INDEX:BTCUSD
INDEX:ETHUSD
BINANCE:SOLUSD
Support Resistance base Volume RSIThe indicator displays support and resistance levels based on volume and the Relative Strength Index (RSI).
Variable and Input Assignment:
lookback: Determines the period for data lookback.
RsiVisible, RsilabelSize, OversoldForRsi, OverboughtForRsi: Various inputs to adjust RSI indicator parameters.
Indicator Calculation:
highestVol: Finds the highest volume within a certain period.
Rsi: Calculates the RSI value with a period of 14.
roc: Calculates the Rate of Change.
Support and Resistance Level Determination:
Uses a comparison between price change (roc) and RSI value to determine whether the price is rising or falling.
If the price is rising and the current volume is greater than the previous highest volume, a new resistance level is established.
If the price is falling and the current volume is greater than the previous highest volume, a new support level is established.
Support and Resistance Lines:
Creates lines indicating the latest support and resistance levels.
These lines are updated whenever there is a change in support or resistance levels.
RSI Labels:
Displays the RSI value above or below the price chart depending on whether the RSI is above or below the overbought or oversold levels.
If the RSI value is above the overbought level, the label is displayed above the price.
If the RSI value is below the oversold level, the label is displayed below the price.
Labels are removed if the corresponding conditions are not met.
Additional RSI Label:
Adds an additional label displaying the RSI value next to the price chart on the last bar.
The main purpose of this script is to assist traders in identifying support and resistance levels based on price movement, volume, and the RSI indicator. Thus, traders can use this information to make better trading decisions.

Multi Timeframe RSI Buy Sell Strategy [TradeDots]The "Multi Timeframe RSI Buy/Sell Strategy" is a trading strategy that utilizes Relative Strength Index (RSI) indicators from multiple timeframes to provide buy and sell signals.
This strategy allows for extensive customization, supporting up to three distinct RSIs, each configurable with its own timeframe, length, and data source.
HOW DOES IT WORK
This strategy integrates up to three RSIs, each selectable from different timeframes and customizable in terms of length and source. Users have the flexibility to define the number of active RSIs. These selections visualize as plotted lines on the chart, enhancing interpretability.
Users can also manage the moving average of the selected RSI lines. When multiple RSIs are active, the moving average is calculated based on these active lines' average value.
The color intensity of the moving average line changes as it approaches predefined buying or selling thresholds, alerting users to potential signal generation.
A buy or sell signal is generated when all active RSI lines simultaneously cross their respective threshold lines. Concurrently, a label will appear on the chart to signify the order placement.
For those preferring not to display order information or activate the strategy, an "Enable backtest" option is provided in the settings for toggling activation.
APPLICATION
The strategy leverages multiple RSIs to detect extreme market conditions across various timeframes without the need for manual timeframe switching.
This feature is invaluable for identifying divergences across timeframes, such as detecting potential short-term reversals within broader trends, thereby aiding traders in making better trading decisions and potentially avoiding losses.
DEFAULT SETUP
Commission: 0.01%
Initial Capital: $10,000
Equity per Trade: 60%
RISK DISCLAIMER
Trading entails substantial risk, and most day traders incur losses. All content, tools, scripts, articles, and education provided by TradeDots serve purely informational and educational purposes. Past performances are not definitive predictors of future results.
TradeDots Stochastic Z-Score

Uptrick: RSI MA Buying/Selling signalsIndicator Purpose:
This indicator, titled "Uptrick: RSI MA Buying/Selling signals" or "UpRSIMA," aims to provide buying and selling signals based on the Moving Average (MA) of the Relative Strength Index (RSI).
It plots the RSI MA line and highlights whether the RSI MA value is above or below 50, indicating potential bullish or bearish signals, respectively.
RSI Calculation:
The script calculates the RSI using a user-defined length parameter (default is 14) and a specified source (typically the closing price).
It then computes the MA of the RSI using the Recursive Moving Average (RMA) function applied to the RSI values.
Color Representation:
The color of the RSI MA line is determined based on whether it's above or below the neutral level of 50.
If the RSI MA is above 50, indicating potential bullish signals, the color is set to green; otherwise, it's set to red for potential bearish signals.
Plotting:
The RSI MA line is plotted on the chart with the specified color based on its value relative to 50.
Additionally, a horizontal line is drawn at y = 50 to visually represent the neutral level.
Histogram bars are also added to visually represent the difference between the RSI MA and the neutral level, with green bars indicating bullish signals and red bars indicating bearish signals.
User Interface:
The indicator is designed to be used as an overlay on price charts, allowing traders to easily visualize potential buying and selling signals based on RSI MA crossovers and levels relative to 50.
Overall, the "Uptrick: RSI MA Buying/Selling signals" indicator offers traders insights into potential trend reversals or continuations based on the moving average of the Relative Strength Index, aiding them in making informed trading decisions.
