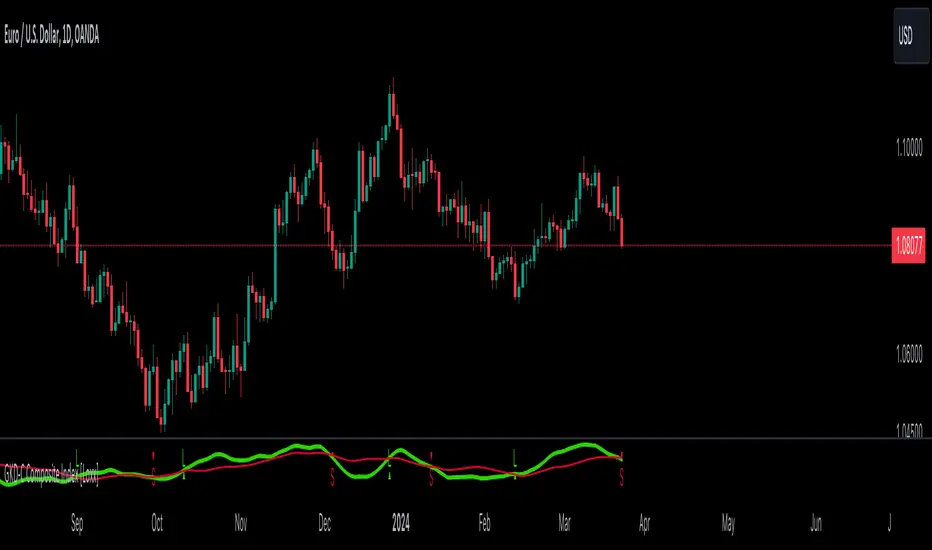
GKD-C Composite Index [Loxx]The Giga Kaleidoscope GKD-C Composite Index is a Confirmation module included in Loxx's "Giga Kaleidoscope Modularized Trading System."
█ GKD-C Composite Index
The Composite Index is a sophisticated technical analysis tool that enhances the traditional Relative Strength Index (RSI) by incorporating momentum and multiple time frame analysis. It calculates two versions of the RSI, one at a slower period and another at a faster period, to capture both long-term trends and short-term market fluctuations. The innovation comes from introducing a momentum factor, RSIDelta, which is the difference between the slow RSI and its value a specified number of periods ago, highlighting the rate of change in market sentiment. Simultaneously, the fast RSI is smoothed with a simple moving average (SMA) over a designated period (RSIsma), blending immediate price movements with ongoing trends. The Composite Index then combines these elements (RSIDelta and RSIsma), creating a singular metric that embodies both momentum and the smoothed trend. This index is further refined by averaging it over two additional periods, offering a multifaceted view that assists in identifying overbought or oversold conditions with enhanced sensitivity to market dynamics. This method aims to provide traders with a deeper understanding of market forces, potentially leading to more informed trading decisions by capturing nuances missed by the standard RSI.
█ Giga Kaleidoscope Modularized Trading System
Core components of an NNFX algorithmic trading strategy
The NNFX algorithm is built on the principles of trend, momentum, and volatility. There are six core components in the NNFX trading algorithm:
1. Volatility - price volatility; e.g., Average True Range, True Range Double, Close-to-Close, etc.
2. Baseline - a moving average to identify price trend
3. Confirmation 1 - a technical indicator used to identify trends
4. Confirmation 2 - a technical indicator used to identify trends
5. Continuation - a technical indicator used to identify trends
6. Volatility/Volume - a technical indicator used to identify volatility/volume breakouts/breakdown
7. Exit - a technical indicator used to determine when a trend is exhausted
8. Metamorphosis - a technical indicator that produces a compound signal from the combination of other GKD indicators*
*(not part of the NNFX algorithm)
What is Volatility in the NNFX trading system?
In the NNFX (No Nonsense Forex) trading system, ATR (Average True Range) is typically used to measure the volatility of an asset. It is used as a part of the system to help determine the appropriate stop loss and take profit levels for a trade. ATR is calculated by taking the average of the true range values over a specified period.
True range is calculated as the maximum of the following values:
-Current high minus the current low
-Absolute value of the current high minus the previous close
-Absolute value of the current low minus the previous close
ATR is a dynamic indicator that changes with changes in volatility. As volatility increases, the value of ATR increases, and as volatility decreases, the value of ATR decreases. By using ATR in NNFX system, traders can adjust their stop loss and take profit levels according to the volatility of the asset being traded. This helps to ensure that the trade is given enough room to move, while also minimizing potential losses.
Other types of volatility include True Range Double (TRD), Close-to-Close, and Garman-Klass
What is a Baseline indicator?
The baseline is essentially a moving average, and is used to determine the overall direction of the market.
The baseline in the NNFX system is used to filter out trades that are not in line with the long-term trend of the market. The baseline is plotted on the chart along with other indicators, such as the Moving Average (MA), the Relative Strength Index (RSI), and the Average True Range (ATR).
Trades are only taken when the price is in the same direction as the baseline. For example, if the baseline is sloping upwards, only long trades are taken, and if the baseline is sloping downwards, only short trades are taken. This approach helps to ensure that trades are in line with the overall trend of the market, and reduces the risk of entering trades that are likely to fail.
By using a baseline in the NNFX system, traders can have a clear reference point for determining the overall trend of the market, and can make more informed trading decisions. The baseline helps to filter out noise and false signals, and ensures that trades are taken in the direction of the long-term trend.
What is a Confirmation indicator?
Confirmation indicators are technical indicators that are used to confirm the signals generated by primary indicators. Primary indicators are the core indicators used in the NNFX system, such as the Average True Range (ATR), the Moving Average (MA), and the Relative Strength Index (RSI).
The purpose of the confirmation indicators is to reduce false signals and improve the accuracy of the trading system. They are designed to confirm the signals generated by the primary indicators by providing additional information about the strength and direction of the trend.
Some examples of confirmation indicators that may be used in the NNFX system include the Bollinger Bands, the MACD (Moving Average Convergence Divergence), and the MACD Oscillator. These indicators can provide information about the volatility, momentum, and trend strength of the market, and can be used to confirm the signals generated by the primary indicators.
In the NNFX system, confirmation indicators are used in combination with primary indicators and other filters to create a trading system that is robust and reliable. By using multiple indicators to confirm trading signals, the system aims to reduce the risk of false signals and improve the overall profitability of the trades.
What is a Continuation indicator?
In the NNFX (No Nonsense Forex) trading system, a continuation indicator is a technical indicator that is used to confirm a current trend and predict that the trend is likely to continue in the same direction. A continuation indicator is typically used in conjunction with other indicators in the system, such as a baseline indicator, to provide a comprehensive trading strategy.
What is a Volatility/Volume indicator?
Volume indicators, such as the On Balance Volume (OBV), the Chaikin Money Flow (CMF), or the Volume Price Trend (VPT), are used to measure the amount of buying and selling activity in a market. They are based on the trading volume of the market, and can provide information about the strength of the trend. In the NNFX system, volume indicators are used to confirm trading signals generated by the Moving Average and the Relative Strength Index. Volatility indicators include Average Direction Index, Waddah Attar, and Volatility Ratio. In the NNFX trading system, volatility is a proxy for volume and vice versa.
By using volume indicators as confirmation tools, the NNFX trading system aims to reduce the risk of false signals and improve the overall profitability of trades. These indicators can provide additional information about the market that is not captured by the primary indicators, and can help traders to make more informed trading decisions. In addition, volume indicators can be used to identify potential changes in market trends and to confirm the strength of price movements.
What is an Exit indicator?
The exit indicator is used in conjunction with other indicators in the system, such as the Moving Average (MA), the Relative Strength Index (RSI), and the Average True Range (ATR), to provide a comprehensive trading strategy.
The exit indicator in the NNFX system can be any technical indicator that is deemed effective at identifying optimal exit points. Examples of exit indicators that are commonly used include the Parabolic SAR, and the Average Directional Index (ADX).
The purpose of the exit indicator is to identify when a trend is likely to reverse or when the market conditions have changed, signaling the need to exit a trade. By using an exit indicator, traders can manage their risk and prevent significant losses.
In the NNFX system, the exit indicator is used in conjunction with a stop loss and a take profit order to maximize profits and minimize losses. The stop loss order is used to limit the amount of loss that can be incurred if the trade goes against the trader, while the take profit order is used to lock in profits when the trade is moving in the trader's favor.
Overall, the use of an exit indicator in the NNFX trading system is an important component of a comprehensive trading strategy. It allows traders to manage their risk effectively and improve the profitability of their trades by exiting at the right time.
What is an Metamorphosis indicator?
The concept of a metamorphosis indicator involves the integration of two or more GKD indicators to generate a compound signal. This is achieved by evaluating the accuracy of each indicator and selecting the signal from the indicator with the highest accuracy. As an illustration, let's consider a scenario where we calculate the accuracy of 10 indicators and choose the signal from the indicator that demonstrates the highest accuracy.
The resulting output from the metamorphosis indicator can then be utilized in a GKD-BT backtest by occupying a slot that aligns with the purpose of the metamorphosis indicator. The slot can be a GKD-B, GKD-C, or GKD-E slot, depending on the specific requirements and objectives of the indicator. This allows for seamless integration and utilization of the compound signal within the GKD-BT framework.
How does Loxx's GKD (Giga Kaleidoscope Modularized Trading System) implement the NNFX algorithm outlined above?
Loxx's GKD v2.0 system has five types of modules (indicators/strategies). These modules are:
1. GKD-BT - Backtesting module (Volatility, Number 1 in the NNFX algorithm)
2. GKD-B - Baseline module (Baseline and Volatility/Volume, Numbers 1 and 2 in the NNFX algorithm)
3. GKD-C - Confirmation 1/2 and Continuation module (Confirmation 1/2 and Continuation, Numbers 3, 4, and 5 in the NNFX algorithm)
4. GKD-V - Volatility/Volume module (Confirmation 1/2, Number 6 in the NNFX algorithm)
5. GKD-E - Exit module (Exit, Number 7 in the NNFX algorithm)
6. GKD-M - Metamorphosis module (Metamorphosis, Number 8 in the NNFX algorithm, but not part of the NNFX algorithm)
(additional module types will added in future releases)
Each module interacts with every module by passing data to A backtest module wherein the various components of the GKD system are combined to create a trading signal.
That is, the Baseline indicator passes its data to Volatility/Volume. The Volatility/Volume indicator passes its values to the Confirmation 1 indicator. The Confirmation 1 indicator passes its values to the Confirmation 2 indicator. The Confirmation 2 indicator passes its values to the Continuation indicator. The Continuation indicator passes its values to the Exit indicator, and finally, the Exit indicator passes its values to the Backtest strategy.
This chaining of indicators requires that each module conform to Loxx's GKD protocol, therefore allowing for the testing of every possible combination of technical indicators that make up the six components of the NNFX algorithm.
What does the application of the GKD trading system look like?
Example trading system:
Backtest: Multi-Ticker CC Backtest
Baseline: Hull Moving Average
Volatility/Volume: Hurst Exponent
Confirmation 1: Advance Trend Pressure as shown on the chart above
Confirmation 2: uf2018
Continuation: Coppock Curve
Exit: Rex Oscillator
Metamorphosis: Baseline Optimizer
Each GKD indicator is denoted with a module identifier of either: GKD-BT, GKD-B, GKD-C, GKD-V, GKD-M, or GKD-E. This allows traders to understand to which module each indicator belongs and where each indicator fits into the GKD system.
█ Giga Kaleidoscope Modularized Trading System Signals
Standard Entry
1. GKD-C Confirmation gives signal
2. Baseline agrees
3. Price inside Goldie Locks Zone Minimum
4. Price inside Goldie Locks Zone Maximum
5. Confirmation 2 agrees
6. Volatility/Volume agrees
1-Candle Standard Entry
1a. GKD-C Confirmation gives signal
2a. Baseline agrees
3a. Price inside Goldie Locks Zone Minimum
4a. Price inside Goldie Locks Zone Maximum
Next Candle
1b. Price retraced
2b. Baseline agrees
3b. Confirmation 1 agrees
4b. Confirmation 2 agrees
5b. Volatility/Volume agrees
Baseline Entry
1. GKD-B Baseline gives signal
2. Confirmation 1 agrees
3. Price inside Goldie Locks Zone Minimum
4. Price inside Goldie Locks Zone Maximum
5. Confirmation 2 agrees
6. Volatility/Volume agrees
7. Confirmation 1 signal was less than 'Maximum Allowable PSBC Bars Back' prior
1-Candle Baseline Entry
1a. GKD-B Baseline gives signal
2a. Confirmation 1 agrees
3a. Price inside Goldie Locks Zone Minimum
4a. Price inside Goldie Locks Zone Maximum
5a. Confirmation 1 signal was less than 'Maximum Allowable PSBC Bars Back' prior
Next Candle
1b. Price retraced
2b. Baseline agrees
3b. Confirmation 1 agrees
4b. Confirmation 2 agrees
5b. Volatility/Volume agrees
Volatility/Volume Entry
1. GKD-V Volatility/Volume gives signal
2. Confirmation 1 agrees
3. Price inside Goldie Locks Zone Minimum
4. Price inside Goldie Locks Zone Maximum
5. Confirmation 2 agrees
6. Baseline agrees
7. Confirmation 1 signal was less than 7 candles prior
1-Candle Volatility/Volume Entry
1a. GKD-V Volatility/Volume gives signal
2a. Confirmation 1 agrees
3a. Price inside Goldie Locks Zone Minimum
4a. Price inside Goldie Locks Zone Maximum
5a. Confirmation 1 signal was less than 'Maximum Allowable PSVVC Bars Back' prior
Next Candle
1b. Price retraced
2b. Volatility/Volume agrees
3b. Confirmation 1 agrees
4b. Confirmation 2 agrees
5b. Baseline agrees
Confirmation 2 Entry
1. GKD-C Confirmation 2 gives signal
2. Confirmation 1 agrees
3. Price inside Goldie Locks Zone Minimum
4. Price inside Goldie Locks Zone Maximum
5. Volatility/Volume agrees
6. Baseline agrees
7. Confirmation 1 signal was less than 7 candles prior
1-Candle Confirmation 2 Entry
1a. GKD-C Confirmation 2 gives signal
2a. Confirmation 1 agrees
3a. Price inside Goldie Locks Zone Minimum
4a. Price inside Goldie Locks Zone Maximum
5a. Confirmation 1 signal was less than 'Maximum Allowable PSC2C Bars Back' prior
Next Candle
1b. Price retraced
2b. Confirmation 2 agrees
3b. Confirmation 1 agrees
4b. Volatility/Volume agrees
5b. Baseline agrees
PullBack Entry
1a. GKD-B Baseline gives signal
2a. Confirmation 1 agrees
3a. Price is beyond 1.0x Volatility of Baseline
Next Candle
1b. Price inside Goldie Locks Zone Minimum
2b. Price inside Goldie Locks Zone Maximum
3b. Confirmation 1 agrees
4b. Confirmation 2 agrees
5b. Volatility/Volume agrees
Continuation Entry
1. Standard Entry, 1-Candle Standard Entry, Baseline Entry, 1-Candle Baseline Entry, Volatility/Volume Entry, 1-Candle Volatility/Volume Entry, Confirmation 2 Entry, 1-Candle Confirmation 2 Entry, or Pullback entry triggered previously
2. Baseline hasn't crossed since entry signal trigger
4. Confirmation 1 agrees
5. Baseline agrees
6. Confirmation 2 agrees
מדד חוזק יחסי (RSI)
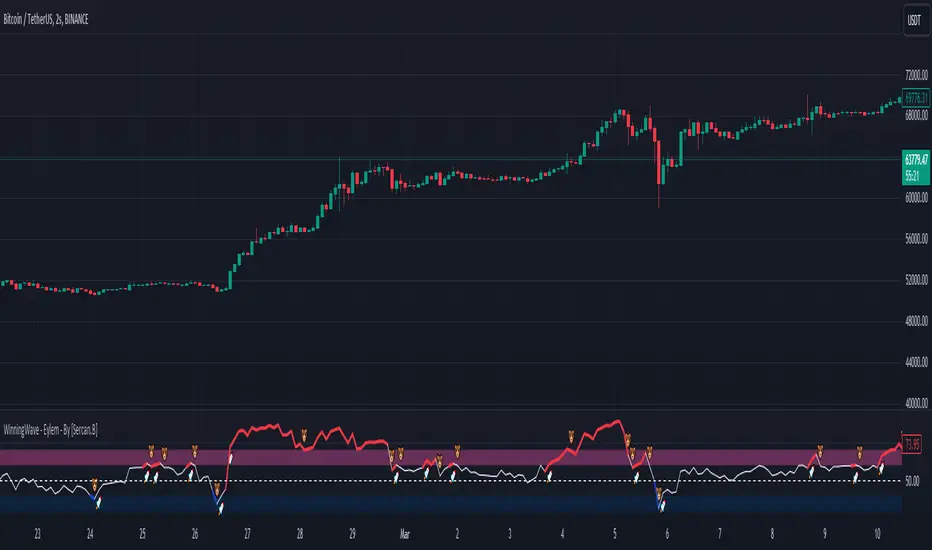
WinningWave - Eylem - By [Sercan.B]"WinningWave - Eylem" is designed as an auxiliary oscillator to the "WinningWave - Devrim" indicator. This specialized tool stands out for its ability to generate buy-sell signals that are compatible with the harmonic formations identified by Devrim. While the primary indicator, Devrim, is utilized to determine harmonic formations and potential trend reversal points in the market, the Eylem indicator provides compatible signals following the formation of these patterns, helping investors to capitalize on these opportunities optimally.
"WinningWave - Eylem" is crafted to predict market momentum and trend reversals based on the formations detected by the Devrim indicator. This synergy offers investors sharp awareness to act when formations are completed and new trends are about to commence.
When used together with Devrim, the Eylem indicator enables investors to analyze market movements from a broader perspective and base their investment decisions on a stronger foundation. In addition to harmonic formations, this auxiliary oscillator, which can adapt to market dynamics, provides investors with a significant tool for determining market entry and exit points. Thus, WinningWave - Eylem enhances Devrim's analytical capabilities, facilitating the process of making informed investments in the financial markets.
Please be aware that using this oscillator alone may lead to financial losses. Remember, it is designed to be an auxiliary oscillator.
Note: In line with my personal impartiality principles, the definition and usage of the indicator were created by analyzing the codes via ChatGPT.
Important note: The indicator is a confirmation oscillator for the buy section. Its function is to confirm the indicator on the main screen.
- As seen in the image, the ''Eylem'' indicator is the auxiliary oscillator of the "Devrim" indicator. Buy and Sell signals have been changed to "Rocket" and "Bear" emojis.
-The Rocket emoji represents the buying areas during the formation periods of harmonic formations.
-The Bear emoji represents the selling areas during the formation periods of harmonic formations.
-Winningwave is the auxiliary oscillator of the Devrim indicator. Its use alone can lead to financial loss.
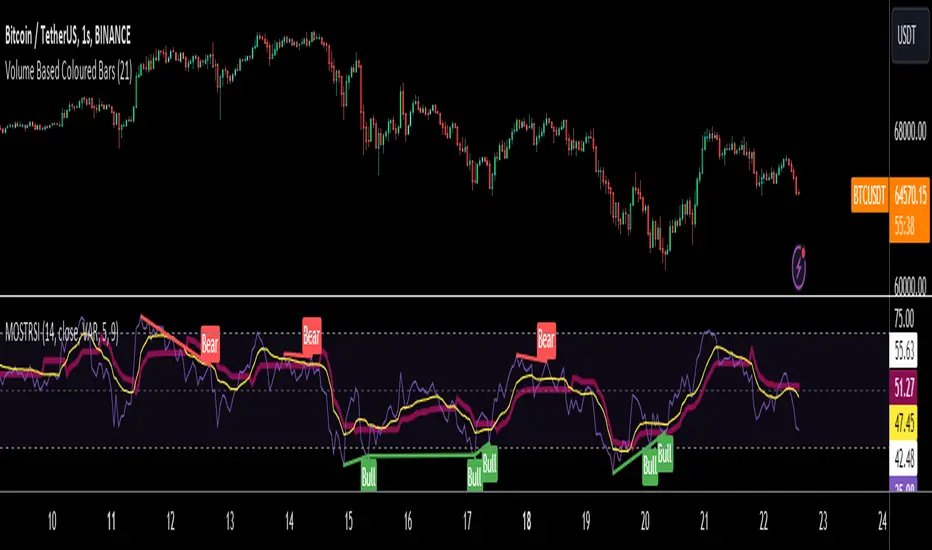
MOST on RSIMOST is applied on this RSI moving average with an extra default option added VAR/VIDYA (Variable Index Dynamic Moving Average)
MOST added on RSI has a Moving Average of RSI and a trailing percent stop level of the Moving Average that can be adjusted by changing the length of the MA and %percent of the stop level.
BUY SIGNAL when the Moving Average Line crosses above the MOST Line
LONG CONDITION when the Moving Average is above the MOST
SELL SIGNAL when Moving Average Line crosses below MOST Line
SHORT CONDITION when the Moving Average is below MOST
-MOST indicator advised to use with Variable Moving Average in the sideways market by its developer Anıl Özekşi, so there are a couple of alternative Moving Average OPTIONS to use in the calculation of MOST:
"SMA", "Bollinger Bands", "EMA", "SMMA (RMA)", "WMA", "VWMA", "VAR"
SMA: Simple Moving Average
EMA: Exponential Movin Average
SMMA (RMA: Smoothed Moving Average, Rolling/Running Moving Average
WMA: Weighted Moving Average
WWMA: Welles Wilder's Moving Average
VAR: Variable Index Dynamic Moving Average aka VIDYA
The Moving Average length and stop loss percent values must be increased for less reliable but late signals. Conversely, it must be decreased to have more and faster signals.
As this indicator is derived from TradingView's built-in RSI, it has Bollinger Bands bounding RSI and a tool that can be used for Bullish & Bearish divergences between the price and RSI. (Show Divergence option)
Finally, users may check the box "Show Signals" to visually see the BUY & SELL signals.
MBAND 200 4H BTC/USDT - By MGS-TradingMBAND 200 4H BTC/USDT with RSI and Volume by MGS-Trading: A Neural Network-Inspired Indicator
Introduction:
The MBAND 200 4H BTC/USDT with RSI and Volume represents a groundbreaking achievement in the integration of artificial intelligence (AI) into cryptocurrency market analysis. Developed by MGS-Trading, this indicator is the culmination of extensive research and development efforts aimed at leveraging AI's power to enhance trading strategies. By synthesizing neural network concepts with traditional technical analysis, the MBAND indicator offers a dynamic, multi-dimensional view of the market, providing traders with unparalleled insights and actionable signals.
Innovative Approach:
Our journey to create the MBAND indicator began with a simple question: How can we mimic the decision-making prowess of a neural network in a trading indicator? The answer lay in the weighted aggregation of Exponential Moving Averages (EMAs) from multiple timeframes, each serving as a unique input akin to a neuron in a neural network. These weights are not arbitrary; they were painstakingly optimized through backtesting across various market conditions to ensure they reflect the significance of each timeframe’s contribution to overall market dynamics.
Core Features:
Neural Network-Inspired Weights: The heart of the MBAND indicator lies in its AI-inspired weighting system, which treats each timeframe’s EMA as an input node in a neural network. This allows the indicator to process complex market data in a nuanced and sophisticated manner, leading to more refined and informed trading signals.
Multi-Timeframe EMA Analysis: By analyzing EMAs from 15 minutes to 3 days, the MBAND indicator captures a comprehensive snapshot of market trends, enabling traders to make informed decisions based on a broad spectrum of data.
RSI and Volume Integration: The inclusion of the Relative Strength Index (RSI) and volume data adds layers of confirmation to the signals generated by the EMA bands. This multi-indicator approach helps in identifying high-probability setups, reinforcing the neural network’s concept of leveraging multiple data points for decision-making.
Usage Guidelines:
Signal Interpretation: The MBAND bands provide a visual representation of the market’s momentum and direction. A price moving above the upper band signals strength and potential continuation of an uptrend, while a move below the lower band suggests weakness and a possible downtrend.
Overbought/Oversold Conditions: The RSI component identifies when the asset is potentially overbought (>70) or oversold (<30). Traders should watch for these conditions near the MBAND levels for potential reversal opportunities.
Volume Confirmation: An increase in volume accompanying a price move towards or beyond an MBAND level serves as confirmation of the strength behind the move. This can indicate whether a breakout is likely to sustain or if a reversal has substantial backing.
Strategic Entry and Exit Points: Combine the MBAND readings with RSI and volume indicators to pinpoint strategic entry and exit points. For example, consider entering a long position when the price is near the lower MBAND, RSI indicates oversold conditions, and there is a notable volume increase.
About MGS-Trading:
At MGS-Trading, we are passionate about harnessing the transformative power of AI to revolutionize cryptocurrency trading. Our indicators and tools are designed to provide traders with advanced analytics and insights, drawing on the latest AI techniques and methodologies. The MBAND 200 4H BTC/USDT with RSI and Volume indicator is a prime example of our commitment to innovation, offering traders a sophisticated, AI-enhanced tool for navigating the complexities of the cryptocurrency markets.
Disclaimer:
The MBAND indicator is provided for informational purposes only and does not constitute investment advice. Trading cryptocurrencies involves significant risk and can result in the loss of your investment. We recommend conducting your own research and consulting with a qualified financial advisor before making any trading decisions.

CAPACE MARKETThis custom indicator combines the Moving Average Convergence Divergence (MACD) and the Relative Strength Index (RSI) into a single trading tool. It calculates the MACD and RSI values, then averages these two indicators to create a composite line. This average line is intended to capture the momentum and relative strength of the market simultaneously, potentially offering a more nuanced view of market conditions.
Key features of the indicator include:
Visualization of MACD and RSI Lines: It plots the MACD and RSI values as separate lines on the chart, allowing traders to see the behavior of each indicator clearly.
Average Line: A line representing the average of the MACD and RSI indicators is plotted, providing a synthesized view of both momentum and strength.
Entry Points Indication: The indicator uses red dots to mark the points where the average line crosses over or under the MACD or RSI lines. These intersections are meant to signal potential entry points for traders.
Market Condition Highlighting: The background color changes based on whether the average line is above or below zero. A green background suggests a positive market condition (bullish), while a red background indicates a negative market condition (bearish).
This tool aims to offer traders an integrated perspective by combining the insights of both MACD and RSI, potentially aiding in the identification of entry and exit points as well as the overall market sentiment.

Wiseball RSI Super Advanced Divergences | EssentialThis indicator is a cutting-edge tool designed to elevate your trading strategy by identifying both regular and hidden RSI divergences with unparalleled precision. Moreover, this indicator uniquely offers the capability to visualize divergences as they are forming ("anticipated"), a feature that stands out for its originality and innovation.
Unique Features and How They Work:
This tool distinguishes itself by leveraging its Divergences Detection System (DDS), which incorporates advanced algorithms to analyze market movements and oscillator behavior beyond the capabilities of existing open-source scripts. Here's a brief overview of what makes DDS uniquely effective:
Anticipated and Projected Divergences: DDS goes beyond mere detection of existing divergences. It offers insights into divergences that are currently forming and even projects potential future divergences by analyzing current trends and oscillator levels. This forward-looking feature empowers traders to anticipate market movements, offering a strategic advantage.
Comprehensive Pivot Analysis: Unlike typical divergence indicators, such as the "RSI Divergence Indicator," which only identifies divergences between two consecutive pivots, DDS is engineered to analyze as many previous pivots as the user's configuration allows (duration min/max). This capability ensures that no potential trend or extended divergence is overlooked, providing a more thorough market analysis.
Multiple Divergences Detection: Our system is capable of detecting multiple divergences within the same timeframe. For instance, it can identify a significant bearish divergence alongside a minor bullish divergence, offering a nuanced view of market dynamics that other indicators might miss.
Extensive Customization Options: DDS provides an array of configuration settings, allowing traders to tailor the detection system to their specific needs. Whether adjusting for sensitivity, timeframes, or specific divergence types, these customization options ensure that the tool can adapt to various trading strategies and preferences.
Our commitment to continuous development means that we regularly update the script based on user feedback, ensuring that it remains at the forefront of trading technology.
How to Use This Script:
Setup: Search for "Wiseball RSI Super Advanced Divergences" in the TradingView indicator library. Easily add the script to your TradingView chart and adjust the settings according to your trading preferences.
Analysis: The script automatically identifies divergences and highlights them on your chart, using color-coded lines and patterns for easy interpretation.
Action: Customize alerts to notify you of new divergences, enabling timely trading decisions based on the script's analysis.
Note: This indicator is best used on a dark background, as it has been optimized for this.
Divergence Style Coding:
Bullish Regular Divergence: Green
Bullish Hidden Divergence: Blue
Bearish Regular Divergence: Red
Bearish Hidden Divergence: Orange
Confirmed Divergence: Solid opaque line
Anticipated Divergence: Dotted line in the type's color
Projected Divergence: Dashed line in the type's color
Understand Technical and practical limitations:
This indicator is designed to facilitate ease of use, correspond to standard practices, and cover your essential needs. DDS options are limited to the essentials for simplicity and ease of use. Moreover, these limitations allow for reduced calculation time and a smooth display.
It is limited to displaying 100 divergences, and the number of bars analyzed is fixed at 960. Use the replay mode to view past divergences.
Divergences sharing the same endpoint are limited to the divergence with the longest duration.
Divergences of the same type that cross or share the same time space are filtered to display only one.
The maximum duration of divergences is set to 120 bars.
Anticipated divergences but not projected ones.
Note: As with all trading tools, it's crucial to use this indicator in conjunction with other indicators and fundamental analysis to validate your trading decisions. Our tools are designed to provide you with valuable insights, not to predict the future. Always conduct your research and trade responsibly.

Swing Trading Indicators (Improved)This "Swing Trading Indicators" script is a sophisticated trading tool designed for traders who wants to use technical analysis for identifying optimal entry points, safeguarding profits, and protect their capital. With foundations loosely based on the momentum burst strategy by Pradeep Bonde, Kristjan Kullamaggie's trading methodologies, and incorporating automatic stop-losses based on Average Daily Range (ADR) and Average True Range (ATR), this script offers a comprehensive solution if you want to capitalize on short-term market movements.
Key Features:
Indicators and Moving Averages: Includes EMA (5, 10, 20, 50 days), SMA (200 days), and the highest and lowest prices over 200 days to provide a multifaceted view of market trends and momentum.
Thrust Indicator: Central to the script, the thrust indicator signals a buy point when a candlestick bar closes above the highs of the last two days, indicating a momentum burst. This feature is particularly inspired by Pradeep Bonde's 4% breakout strategy, highlighting the script's capability to identify range expansion and upward thrusts as key entry moments.
Automatic Stop-Levels: Utilizes ADR and ATR to set dynamic stop-losses, helping traders to manage risk effectively by adapting to market volatility.
Comprehensive Market Analysis : Through volume analysis, RSI, closing range, and other parameters, the script offers a deep dive into market dynamics, aiding in decision-making.
Who Should Use It:
This tool is ideal for swing traders and momentum traders focused on short to medium-term gains. Its robust set of features makes it suitable for those who prefer a data-driven approach to identify buying opportunities and manage risk.
Trading Style Compatibility:
The thrust indicator shines in momentum trading strategies, providing clear signals for entering trades ahead of potential price jumps. The integration of moving averages and volume analysis supports a variety of trading styles, including day trading and swing trading, by offering insights into trend strength and potential reversals.
How the Thrust Indicator Works:
When you see a thrust indicator (green upwards arrow below a candle) when the price is moving out of a consolidation or low volatility price-range , that's the buy point.
The thrust indicator is NOT indended as an indicator for long term positions or trend reversals, but for entries at a good price while capturing the first day of a potential 5-20% move in the coming 3-5 days.
The thrust indicator pinpoints moments when a stock shows a strong upward momentum, characterized by a candlestick closing above the highs of the preceding two days. This identifies a momentum burst, signaling an optimal entry point for traders looking to profit from a short-term price movement, typically ranging from 5-20% over the following 3-5 days. Such precision in identifying entry points is invaluable for traders focusing on capturing quick gains from market volatility.
"Top / Watch out" Indicator:
In addition to the script's core functionality, the "WatchOut" indicator plays a crucial role in identifying potential reversals after significant price movements. By analyzing conditions such as recent price increases compared to the average daily range, RSI levels, and the opening price distance from the EMA, the "WatchOut" indicator alerts traders to exercise caution. This feature is pivotal for those looking to avoid entering trades that might be on the verge of a pullback or reversal, enhancing the script's utility in managing risk.

RSI / Connectable [Azullian]Enhance your trading approach with the modular RSI indicator, skilled in identifying market extremes. Simplify pattern visualization and signal weighting for more efficient strategy formulation.
This connectable RSI indicator is part of an indicator system designed to help test, visualize and build strategy configurations without coding. Like all connectable indicators , it interacts through the TradingView input source, which serves as a signal connector to link indicators to each other. All connectable indicators send signal weight to the next node in the system until it reaches either a connectable signal monitor, signal filter and/or strategy.
█ UNIFORM SETTINGS AND A WAY OF WORK
Although connectable indicators may have specific weight scoring conditions, they all aim to follow a standardized general approach to weight scoring settings, as outlined below.
■ Connectable indicators - Settings
• 🗲 Energy: Energy applies an ATR multiplier to the plotted shapes on the chart. A higher value plots shapes farther away from the candle, enhancing visibility.
• ☼ Brightness: Brightness determines the opacity of the shape plotted on the chart, aiding visibility. Indicator weight also influences opacity.
• → Input: Use the input setting to specify a data source for the indicator. Here you can connect the indicator to other indicators.
• ⌥ Flow: Determine where you want to receive signals from:
○ Both: Weights from this indicator and the connected indicator will apply
○ Indicator only: Only weights from this indicator will apply
○ Input only: Only weights from the connected indicator will apply
• ⥅ Weight multiplier: Multiply all weights in the entire indicator by a given factor, useful for quickly testing different indicators in a granular setup.
• ⥇ Threshold: Set a threshold to indicate the minimum amount of weight it should receive to pass it through to the next indicator.
• ⥱ Limiter: Set a hard limit to the maximum amount of weight that can be fed through the indicator.
■ Connectable indicators - Weight scoring settings
▢ Weight scoring conditions
• SM – Signal mode: Enable specific conditions for weight scoring
○ All: All signals will be scored.
○ Entries only: Only entries will score.
○ Exits only: Only exits will score.
○ Entries & exits: Both entries and exits will score.
○ Zone: Continuous scoring for each candle within the zone.
• SP – Signal period: Defines a range of candles within which a signal can score.
• SC - Signal count: Specifies the number of bars to retrospectively examine and score.
○ Single: Score for a single occurrence
○ All occurrences: Score for all occurrences
○ Single + Threshold: Score for single occurrences within the signal period (SP)
○ Every + Threshold: Score for all occurrences within the signal period (SP)
▢ Weight scoring direction
• ES: Enter Short weight
• XL: Exit long weight
• EL: Enter Long weight
• XS: Exit Short weight
▢ Weight scoring values
• Weights can hold either positive or negative scores. Positive weights enhance a particular trading direction, while negative weights diminish it.
■ Entries, exits and zone illustrated on a standard RSI indicator when the RSI is overbought.
█ RSI - INDICATOR SETTINGS
■ Main settings
• Enable/Disable Indicator: Toggle the entire indicator on or off.
• S - Source: Choose an alternative data source for the RSI calculation.
• T - Timeframe: Select an alternative timeframe for the RSI calculation.
• LE - Length: Define the number of bars or periods used in the RSI calculation.
• OB - Overbought Level: Determine the RSI value at which overbought conditions are met.
• OS - Oversold Level: Specify the RSI value at which oversold conditions are met.
■ Scoring functionality
• The RSI scores long entries when the RSI enters OS: oversold area
• The RSI scores long exits when the RSI exits OS: oversold area
• The RSI scores long zones the entire time the RSI is in OS: oversold area
• The RSI scores short entries when the RSI enters OB: overbought area
• The RSI scores short exits when the RSI exits OB: overbought area
• The RSI scores short zones the entire time the RSI is in OB: overbought area
█ PLOTTING
• Standard: Symbols (EL, XS, ES, XL) appear relative to candles based on set conditions. Their opacity and position vary with weight.
• Conditional Settings: A larger icon appears if global conditions are met. For instance, with a Threshold(⥇) of 12, Signal Period (SP) of 3, and Scoring Condition (SC) set to "EVERY", an RSI signaling over two times in 3 candles (scoring 6 each) triggers a larger icon.
█ USAGE OF CONNECTABLE INDICATORS
■ Connectable chaining mechanism
Connectable indicators can be connected directly to the signal monitor, signal filter or strategy , or they can be daisy chained to each other while the last indicator in the chain connects to the signal monitor, signal filter or strategy. When using a signal filter you can chain the filter to the strategy input to make your chain complete.
• Direct chaining: Connect an indicator directly to the signal monitor, signal filter or strategy through the provided inputs (→).
• Daisy chaining: Connect indicators using the indicator input (→). The first in a daisy chain should have a flow (⌥) set to 'Indicator only'. Subsequent indicators use 'Both' to pass the previous weight. The final indicator connects to the signal monitor, signal filter, or strategy.
■ Set up this indicator with a signal filter and strategy
The indicator provides visual cues based on signal conditions. However, its weight system is best utilized when paired with a connectable signal filter, signal monitor, or strategy .
Let's connect the RSI to a connectable signal filter and a strategy :
1. Load all relevant indicators
• Load RSI / Connectable
• Load Signal filter / Connectable
• Load Strategy / Connectable
2. Signal Filter: Connect the RSI to the Signal Filter
• Open the signal filter settings
• Choose one of the three input dropdowns (1→, 2→, 3→) and choose : RSI / Connectable: Signal Connector
• Toggle the enable box before the connected input to enable the incoming signal
3. Signal Filter: Update the filter signals settings if needed
• The default settings of the filter enable EL (Enter Long), XL (Exit Long), ES (Enter Short) and XS (Exit Short).
4. Signal Filter: Update the weight threshold settings if needed
• All connectable indicators load by default with a score of 6 for each direction (EL, XL, ES, XS)
• By default, weight threshold (TH) is set at 5. This allows each occurrence to score, as the default score in each connectable indicator is 1 point above the threshold. Adjust to your liking.
5. Strategy: Connect the strategy to the signal filter in the strategy settings
• Select a strategy input → and select the Signal filter: Signal connector
6. Strategy: Enable filter compatible directions
• Set the signal mode of the strategy to a compatible direction with the signal filter.
Now that everything is connected, you'll notice green spikes in the signal filter representing long signals, and red spikes indicating short signals. Trades will also appear on the chart, complemented by a performance overview. Your journey is just beginning: delve into different scoring mechanisms, merge diverse connectable indicators, and craft unique chains. Instantly test your results and discover the potential of your configurations. Dive deep and enjoy the process!
█ BENEFITS
• Adaptable Modular Design: Arrange indicators in diverse structures via direct or daisy chaining, allowing tailored configurations to align with your analysis approach.
• Streamlined Backtesting: Simplify the iterative process of testing and adjusting combinations, facilitating a smoother exploration of potential setups.
• Intuitive Interface: Navigate TradingView with added ease. Integrate desired indicators, adjust settings, and establish alerts without delving into complex code.
• Signal Weight Precision: Leverage granular weight allocation among signals, offering a deeper layer of customization in strategy formulation.
• Advanced Signal Filtering: Define entry and exit conditions with more clarity, granting an added layer of strategy precision.
• Clear Visual Feedback: Distinct visual signals and cues enhance the readability of charts, promoting informed decision-making.
• Standardized Defaults: Indicators are equipped with universally recognized preset settings, ensuring consistency in initial setups across different types like momentum or volatility.
• Reliability: Our indicators are meticulously developed to prevent repainting. We strictly adhere to TradingView's coding conventions, ensuring our code is both performant and clean.
█ COMPATIBLE INDICATORS
Each indicator that incorporates our open-source 'azLibConnector' library and adheres to our conventions can be effortlessly integrated and used as detailed above.
For clarity and recognition within the TradingView platform, we append the suffix ' / Connectable' to every compatible indicator.
█ COMMON MISTAKES, CLARIFICATIONS AND TIPS
• Removing an indicator from a chain: Deleting a linked indicator and confirming the "remove study tree" alert will also remove all underlying indicators in the object tree. Before removing one, disconnect the adjacent indicators and move it to the object stack's bottom.
• Point systems: The azLibConnector provides 500 points for each direction (EL: Enter long, XL: Exit long, ES: Enter short, XS: Exit short) Remember this cap when devising a point structure.
• Flow misconfiguration: In daisy chains the first indicator should always have a flow (⌥) setting of 'indicator only' while other indicator should have a flow (⌥) setting of 'both'.
• Hide attributes: As connectable indicators send through quite some information you'll notice all the arguments are taking up some screenwidth and cause some visual clutter. You can disable arguments in Chart Settings / Status line.
• Layout and abbreviations: To maintain a consistent structure, we use abbreviations for each input. While this may initially seem complex, you'll quickly become familiar with them. Each abbreviation is also explained in the inline tooltips.
• Inputs: Connecting a connectable indicator directly to the strategy delivers the raw signal without a weight threshold, meaning every signal will trigger a trade.
█ A NOTE OF GRATITUDE
Through years of exploring TradingView and Pine Script, we've drawn immense inspiration from the community's knowledge and innovation. Thank you for being a constant source of motivation and insight.
█ RISK DISCLAIMER
Azullian's content, tools, scripts, articles, and educational offerings are presented purely for educational and informational uses. Please be aware that past performance should not be considered a predictor of future results.

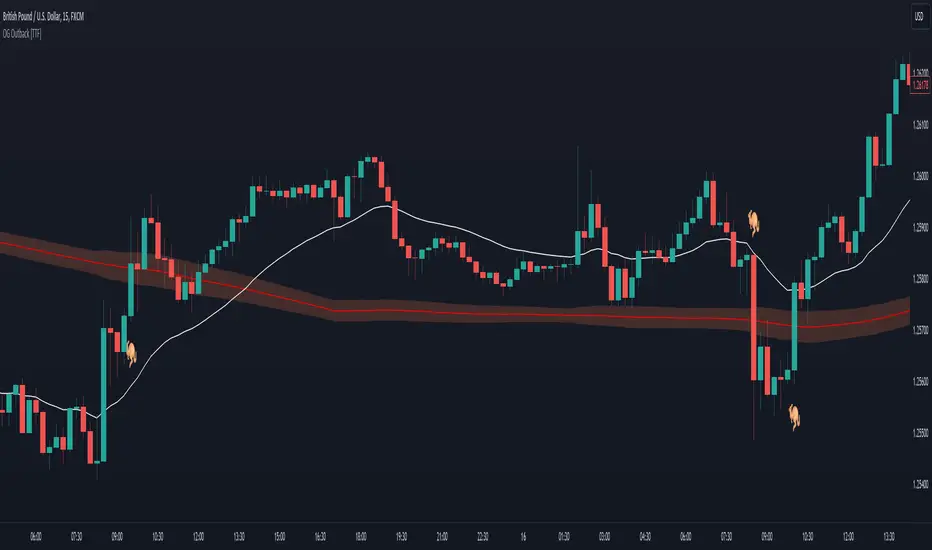
The OG Outback [TTF]The Outback indicator
After a major overhaul of our Outback strategy, we decided that we would make our original version available for anyone to use.
The fundamental element of this indicator is based on price action relative to a slow moving average. That said, given that price will always tend towards a moving average, we have also implemented a method for helping filter out false signals leveraging a "consolidation cloud" and fast moving average. This, coupled with references to a customized version of the Relative Strength Index (RSI), has enabled us to provide significantly higher quality signals relating to price crossing a moving average.
Note: For this version, we have only prepared a single set of conditions and alerts (as noted by the 🦘 symbols). However it's worth noting there are several variations that can be done with some fundamental technical analysis and referencing additional indicators that can take this foundation and build upon it for a substantial increase in risk/reward and profit targets.
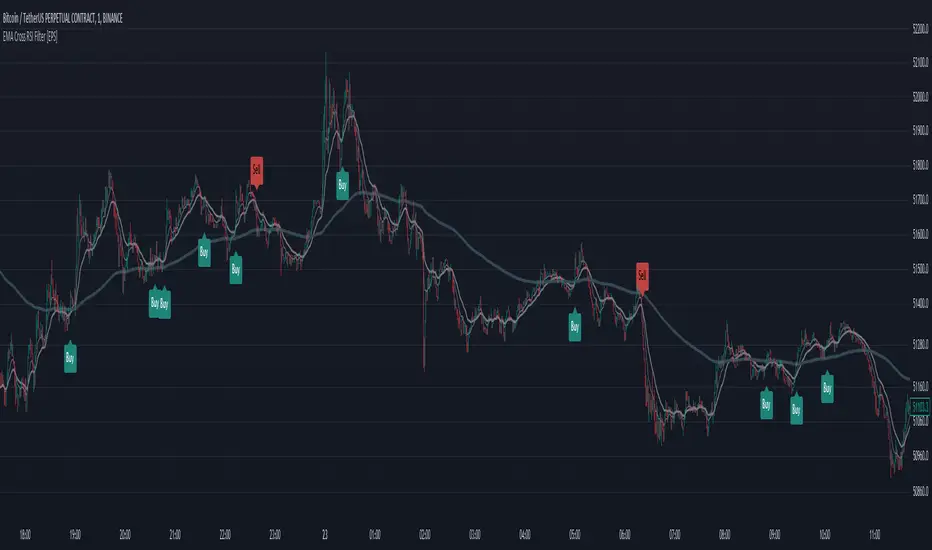
EMA Cross RSI Filter [EPS]The "EMA Cross RSI Filter " is a technical analysis tool that combines the power of Exponential Moving Averages (EMAs) with the Relative Strength Index (RSI) to provide clear buy and sell signals on financial charts. Utilizing the dynamic interaction between a fast and a medium EMA, it identifies potential trend reversals. This is further refined by the RSI which filters signals based on momentum, with a custom threshold to pinpoint optimal entry and exit points.
🔹 KEY FEATURES
Dynamic EMA Crossover: Detects potential market turns with a fast EMA crossing a medium EMA.
Momentum-Filtered RSI: Enhances signal reliability by incorporating momentum data from the RSI.
Trend-Following Confirmation: Ensures trades are in harmony with the broader market direction by considering the long-term EMA.
Adaptable Parameters: Empowers traders to tailor EMA periods and RSI thresholds to their unique trading blueprint.
🔹 TRADING APPLICATION
Buy Indications: Presented when the fast EMA ascends above the medium EMA while the asset's price surpasses the long-term EMA, and the RSI exceeds the established long level.
Sell Projections: Emerge when the fast EMA descends below the medium EMA, combined with the asset's price dropping beneath the long-term EMA and the RSI falling short of the prescribed short level.
Custom Visibility: Offers the flexibility to display or conceal EMA lines for a streamlined chart analysis experience.
🔹 STRATEGIC INTEGRATION
This analytical tool is optimized for traders who prioritize a disciplined methodology in market entry and exit, bolstered by the validation of trend direction and momentum agreement.
Capital Management Synergy: You can seamlessly integrate these signals with your personal risk management strategy, enhancing the effectiveness of your trades.
Stop-Loss and Take-Profit: It's advisable to set stop-loss orders at the previous swing low for buys, or swing high for sells. For take-profit levels, a Risk to Reward ratio of 1 to 1.5 or a preferred measure can be employed to systematically secure gains.
🔶 APPROACH
This tool caters to both trend-following and breakout strategies. It's designed for traders who want a systematic approach to enter and exit the market with the added confidence of trend and momentum confirmation.
🔹 NOTE
Indicator does not repaint.
Optimal for various timeframes and trading instruments.
Best used in trending markets for higher reliability.
🔶 SETUP
EMA Lengths: Fast (9), Medium (21), Long (200).
RSI Settings: Length (14), Long Threshold (50), Short Threshold (35).
Display Options: Show or hide EMA lines.
By adhering to the principle that no single indicator should dictate a trade, this tool is best used in conjunction with other analyses to confirm signals.
Divergence Signal [TradingFinder] RSI & MACD Reversal On Swing🔵 Introduction
Sometimes in analyzing price charts using indicators, you may observe a discrepancy. For instance, while the price of stocks, currencies, or commodities is increasing, the indicator shows a decrease. Such a phenomenon in technical analysis is termed "divergence." Divergences are categorized into three types based on their formation and the prediction they make about the continuation of the price trend: "Regular Divergence," "Hidden Divergence," and "Time Divergence."
🟣 Important :
• This indicator exclusively identifies regular divergences since its primary function is to detect reversal points.
• This indicator identifies divergences using three indicators: "Moving Average Convergence Divergence" (MACD), "Relative Strength Index" (RSI), and "Awesome Oscillator" (AO). The user can choose each of these indicators in the settings using the "Divergence Detection Method" dropdown menu for identifying divergences. These settings are by default set to the MACD mode.
🔵Types of Divergence
Divergences, as mentioned, offer different predictions about the continuation of price trends. Hence, they have various types. We will focus on explaining regular divergences based on this indicator.
🟣 Regular Divergence(RD) :
Regular divergence is a situation arising from contradictory behavior between the indicator and the price chart at the end of a trend. By identifying regular divergences, we anticipate a change in trend direction resembling a reversal pattern.
Regular divergence has two types based on the trend and prediction:
Negative Regular Divergence (RD-) :
This type occurs between two price peaks at the end of an uptrend. Despite forming a new high, the indicator fails to recognize it, indicating a negative regular divergence. The likelihood of a subsequent downtrend is high. Negative divergence suggests strong selling pressure and weak buying power, portraying an unfavorable future for the stock.
Positive Regular Divergence (RD+) :
In contrast, positive regular divergence happens at the end of a downtrend and between two price troughs. As depicted in the chart, although the price forms a new low, the indicator doesn't acknowledge it. Positive regular divergence indicates robust buying pressure and weak selling power. Upon identifying positive divergence in the chart, we expect a price increase for the stock under review
🔵 How to Use
Information from the indicator is displayed in two ways: Table and Label.
🟣 Table : The table displays information about the latest divergence. This includes the type of divergence, existence or absence of divergence, consecutive divergences, divergence quality, and change in indicator phase.
Type Divergence : Indicates the type of divergence, which can be either "Bullish Divergence" or "Bearish Divergence."
Exist : Indicates the presence of divergence with a "+" sign and absence with a "-" sign. A green color is used for bullish divergence and red for bearish divergence.
Consecutive : Shows the number of consecutive divergences. For example, if there are 3 consecutive divergences, the number 3 is displayed.
Divergence Quality : Displays the quality of the divergence based on the number of consecutive divergences. If there is 1 divergence, the quality is "Normal"; for 2 divergences, it's "Good"; and for 3 or more divergences, it's "Strong."
Change Phase Indicator : Indicates whether a phase change in the indicator has occurred with "+" for yes and "-" for no.
🟣 Label : Unlike the table, which only shows information about the latest divergence, labels display information about each divergence at the point where it occurs. The information includes the type of divergence, detection method, divergence quality, consecutive divergences, and change in phase indicator. The selected method of detection is also displayed. For example, if the chosen method is the "AO" indicator, the label will show "Method: AO."
🔵 Settings
Fractal Period : Determines the period of swings. The minimum and default value is 2.
Divergence Detect Method : Selects the indicator (MACD, RSI, or AO) used for detecting divergences. The default indicator is MACD.
Show Fractal : Chooses whether to display fractals or not. The default is "No."
Show Table : Determines whether to display the table or not. The default is "Yes."
Show Label : Chooses whether to display labels or not. The default is "Yes."
Label Size : Adjusts the size of the labels from "Tiny" to "Large."

Multi-Timeframe RSI Tracker by Ox_kaliThis script, is trend Tracker that serves as an analytical tool for assessing market trends through the lens of the Relative Strength Index (RSI) across multiple timeframes. It caters to individuals who require a detailed examination of market dynamics, leveraging the RSI to gauge the strength and direction of market momentum.
Functionality Overview:
Multi-Timeframe Analysis: The script evaluates the RSI across an array of timeframes, from 1 minute up to 1 week. This diverse range allows for a comprehensive view of market trends, accommodating strategies that span from intraday to long-term analysis.
RSI Trend Interpretation: It utilizes the RSI to determine market trends. Specifically, an RSI value above 50 signals a bullish trend, indicating that positive momentum is prevailing. Conversely, an RSI below 50 suggests a bearish trend, marking a period of negative momentum. This simple yet effective method provides a quick way to assess the market’s direction.
Customization and Flexibility: Users can customize the appearance of trend lines with different colors to distinguish between bullish and bearish trends easily. Furthermore, the script includes options to select which timeframes are displayed, allowing users to tailor the analysis to their specific needs.
Average Trend Indicator: A important feature is the calculation of an average trend across all selected timeframes. This aggregated trend gives a summarized view of the overall market direction, offering an additional layer of insight.
Adjustments and Enhancements:
User-Controlled Settings: Beyond the pre-defined color themes (Normal, Modern, Classic, Robust, Accented, Monochrome), the script introduces a user-defined option for maximum customization. This feature empowers users to set their preferred colors for various trend conditions.
Label Positioning and RSI Period Customization: The script provides inputs for adjusting label positions and setting the RSI period, enabling a personalized and clear charting experience.
Detailed Timeframe Analysis: The inclusion of a wide range of timeframes ensures that users can conduct a detailed examination of market behaviors, facilitating informed decision-making.
Operational Note:
The Multi-Timeframe RSI Tracker is a tool designed to supplement market analysis within a comprehensive trading strategy. It is crucial for users to integrate this tool within a framework that includes risk management and to familiarize themselves with its functionalities through testing and practice. By offering a detailed perspective on market trends through RSI analysis, this script by Ox_kali provides valuable insights, aiding users in navigating the complexities of the financial markets with an informed approach.
Please note that the MTEMA-Tracker is not a guarantee of future market performance and should be used in conjunction with proper risk management. Always ensure that you have a thorough understanding of the indicator’s methodology and its limitations before making any investment decisions. Additionally, past performance is not indicative of future results.

RSI over screener (any tickers)█ OVERVIEW
This screener allow you to watch up to 240 any tickers you need to check RSI overbought and oversold using multiple periods, including the percentage of RSIs of different periods being overbought/oversold, as well as the average between these multiple RSIs.
█ THANKS
LuxAlgo for his RSI over multi length
I made function for this RSI and screener based on it.
allanster for his amazing idea how to split multiple symbols at once using a CSV list of ticker IDs
█ HOW TO USE
- hide chart:
- add 6 copies of screener
- change list number at settings from 1 to 6
- add you tickers
Screener shows signals when RSI was overbought or oversold and become to 0, this signal you may use to enter position(check other market condition before enter).
At settings you cam change Prefics, Appendix and put you tickers.
limitations are:
- max 40 tickers for one list
- max 4096 characters for one list
- tickers list should be separated by comma and may contains one space after the comma
By default it shows almost all BINANCE USD-M USDT tickers
Also you can adjust table for your screen by changing width of columns at settings.
If you have any questions or suggestions write comment or message.

Gtrades Forex RSI & Volume SignalThe "Forex RSI & Volume Signal" indicator combines Relative Strength Index (RSI) and volume analysis to identify potential buy signals in forex trading. It calculates RSI to gauge overbought or oversold conditions, while comparing current volume to a moving average to determine bullish volume momentum. When RSI indicates oversold conditions and volume suggests bullish momentum, a buy signal is generated. This indicator aims to identify favorable entry points during short-term uptrends in the forex market, leveraging both momentum and volume analysis to inform trading decisions. It provides traders with a comprehensive tool to identify potential buying opportunities based on multiple technical factors.

Regression Sloped RSI [QuantraSystems]Regression Sloped RSI
Introduction
The Regression Sloped RSI (𝓡𝓢-𝓡𝓢𝓘) enhances the classical RSI by incorporating a form of linear regression analysis, which adjusts the traditional RSI in relation to the calculated slope over a specified lookback period.
Its innovative approach reduces the occurrence of false signals compared to the classical RSI. Furthermore, it is particularly effective in markets characterized by strong trends. This is because it responds faster while retaining a high level of whipsaw resistance. The Heikin-Ashi style processing is critical to this.
It also provides robust reversal signals from dynamic overbought and oversold zones to further enhance mean-reversion trading.
Legend
The coloring of the 𝓡𝓢-𝓡𝓢𝓘 changes based on trend direction: A bright green when upwards, lilac when downwards. The strength of the trend is expressed in its distance to Null. Its acceleration is found in the Heikin-Ashi (HA) candles.
The 𝓡𝓢-𝓡𝓢𝓘 in combination with the HA bars can be used to achieve earlier entries, when the former passes across the latter in an obvious divergence.
Case Study
In this example the 𝓡𝓢-𝓡𝓢𝓘 is used to make a few intra-day trades on the Ethereum 15 minute chart. Each trade was open for approximately 5 hours. On the first trade we enter a long in an early entry. The indicator gives us three confirmations which we should all check for. First we have a positive candle developing, secondly the 𝓡𝓢-𝓡𝓢𝓘 (line) rises above the Heikin-Ashi candles, thirdly the classical RSI (the saturated surface in the background) rises as well.
The trader should then calculate their position sizing responsibly and enter into a short daytrade. Please always have invalidation rules, for example a) if the initial HA candle closes negative b) you can place your stop loss at 1SD into the opposite direction.
Always use adequate risk management, never risk more than 1% of your portfolio, unless you are a seasoned trader with your own calculated position sizes.
Always forward test your rules, assets, timeframe and settings sufficiently.
It is always recommended to use multiple Quantra indicators to add confirmations to your signals - this is by design.
Recommended Settings
Please reset to defaults before enabling recommended settings.
Intra-Day Trading (15min chart)
RSI Length: 22
LR Length: 25
Smoothing: EMA
Toggle SD Bands: On
Mode for Coloring: Candles
Trend Following (4H chart)
RSI Length: 40
LR Length: 35
Smoothing: LSMA
Toggle SD Bands: Off
Mode for Coloring: Extremes or Trend Following
Notes
Quantra Standard Value Contents:
The Heikin-Ashi (HA) candle visualization smoothes out the signal line to provide more informative insights into momentum and trends. This allows earlier entries and exits by observing the indicator values transformed by the HA.
Various visualization options are available to adjust the indicator to the user’s preference: Aside from HA, a classic line, or a hybrid of both.
A special feature of Quantra’s indicators is that they are probabilistically built - therefore they work well as confluence and can easily be stacked to increase signal accuracy.
To add to Quantra's indicators’ utility we have added the option to change the price bars colors based on different signals:
Choose Mode for Coloring
Trend Following (Indicator above mid line counts as uptrend, below is downtrend)
Extremes (Everything beyond the SD bands is highlighted to signal mean reversion)
Candles (Color of HA candles as barcolor)
Reversions (Only for HA) (Reversion Signals via the triangles if HA candles change trend while beyond the SD bands, high probability entries/exits)
The 𝓡𝓢-𝓡𝓢𝓘 is finely tuned to detect divergences.
Primarily utilized for trend following, the 𝓡𝓢-𝓡𝓢𝓘 also demonstrates effectiveness in identifying reversions, intensity of movements and the navigation of range-bound markets.
Allows for easy identification of slowdowns in momentum and thus negative rate of change.
Methodology
The 𝓡𝓢-𝓡𝓢𝓘 takes the classical RSI using a specified lookback length and computes the slope of a linear regression line applied to the RSI values. This slope is used to adjust the RSI.
This sloped RSI can be further smoothed using various Moving Averages with customizable lengths.
For a more nuanced view of market trends, the 𝓡𝓢-𝓡𝓢𝓘 applies a specialized Heikin Ashi method. This transformation modifies the Sloped RSI values in order to weigh and reflect the average price, offering a smoother representation compared to traditional candlestick patterns.
The 𝓡𝓢-𝓡𝓢𝓘 calculates upper and lower bounds based on a specified standard deviation multiplier and adjustable lookback period, providing a dynamic framework to identify extrema and thus overbought and oversold conditions.
Particularly in the Heikin Ashi mode, the 𝓡𝓢-𝓡𝓢𝓘 can display reversion signals. These are plotted as shapes on the chart, indicating high probability reversal points in the market trend.

TrendFusion Pro (BETA)The TrendFusion Pro (BETA) combines advanced trend analysis, dynamic RSI insights, and price target prediction in one comprehensive tool. Here's how to customize its settings to optimize your trading strategy:
Candle Style:
Options: Traditional Candle, Super Trend Heiken Ashi Candle
Description: Select your preferred candle visualization. Traditional candles are best for classic chart analysis, while Super Trend Heiken Ashi candles help in identifying trends by smoothing price movements.
How to Use: Choose "Super Trend Heiken Ashi Candle" for trend following strategies or "Traditional Candle" for patterns and reversal strategies.
This setting allows you to match the candle visualization to your trading strategy, enhancing chart clarity and trend recognition.
Trend Analysis Settings:
Trend Strength & Smoothing Period: Adjust these to define what constitutes a trend on your chart, allowing for customization based on volatility and your trading timeframe.
How to Use: Increase the trend strength for longer-term trends or decrease it for short-term movements. Adjust the smoothing period based on the asset's volatility.
Fine-tuning these parameters helps in tailoring the trend analysis to your specific market approach, enhancing the accuracy of trend signals.
RSI Settings:
RSI Length, Overbought/Oversold Levels: Customize the RSI to fit your risk tolerance and strategy. Altering these parameters changes the frequency and sensitivity of overbought/oversold signals.
How to Use: Set your RSI length and thresholds based on the asset's historical performance and your trading strategy.
Adjusting the RSI settings allows for a more nuanced approach to momentum analysis, providing clearer signals for entry and exit points.
Price Target Interest (%):
Description: Define a percentage to calculate potential upward and downward price targets from the current price.
How to Use: Use this setting to identify potential profit targets or stop-loss levels based on your risk-reward ratio.
This feature offers a dynamic method for setting realistic and strategic price targets, aiding in risk management and profit maximization.
Multi-Timeframe Trend Analysis Table:
Description: Displays the trend direction across multiple timeframes, providing a comprehensive view of the market's momentum.
How to Use: Enable this table to align your trades with the broader market trend for higher success rates.
Understanding market direction across different timeframes can significantly improve the timing and effectiveness of your trading decisions.
Previous Day High, Low, and Average Lines:
Description: Visual markers for the previous day's high, low, and average prices.
How to Use: These markers can be used as key levels for breakout, reversal, or continuation strategies.
Incorporating these levels into your analysis provides historical context, offering critical support and resistance zones for your trades.
Signal Visibility:
Long/Short Signals, Exit Signals, RSI Signals: Customize which signals are displayed on your chart to match your trading strategy and reduce clutter.
How to Use: Enable the signals that align with your trading strategy, whether it be trend following, reversal trading, or momentum trading.
Selectively displaying signals helps in focusing on the most relevant trading opportunities, reducing distractions and improving decision-making.
Conclusion:
The TrendFusion Pro (BETA) is designed to offer traders a comprehensive, intuitive, and customizable tool for market analysis. By understanding and utilizing these settings, traders can tailor the tool to meet their specific needs, enhancing their ability to make informed trading decisions in different market conditions. Experiment with different settings in a demo account to find the optimal configuration for your trading approach.

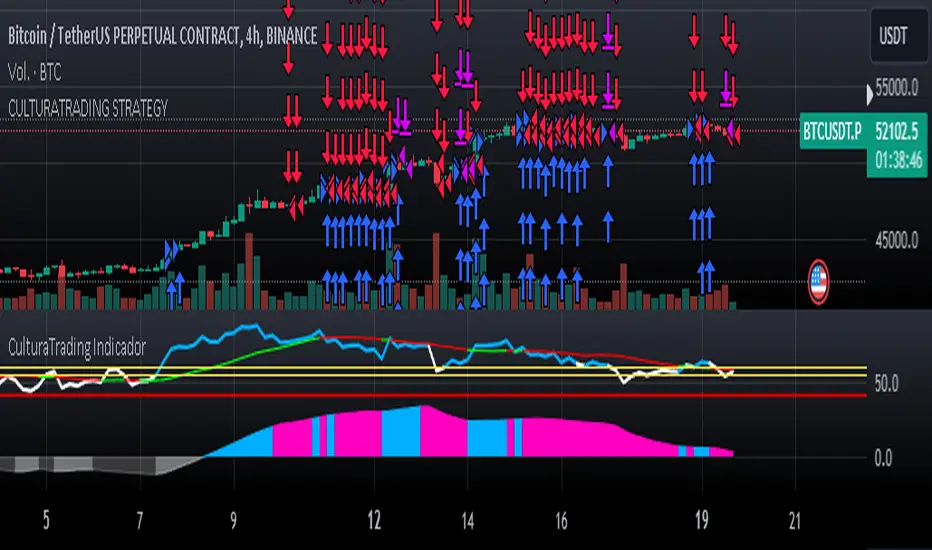
CulturaTrading IndicadorThe CULTURATRADING INDICATOR refines trading signals by integrating advanced analysis techniques across RSI, MACD, and ADX indicators. Here's a deep dive into its functionalities:
RSI Analysis:
Buying Signal Identification: The RSI component is calibrated not just to flag potential reversal points but to identify strong momentum. An RSI exceeding 60 is not merely an overbought signal; it indicates a robust buying momentum when it turns blue, aligning with CULTURATRADING STRATEGY's criteria for a potential long position.
Level 55 Significance: This level acts as a transitional threshold. When the RSI retreats below this point, it suggests a weakening momentum, prompting a reassessment of open positions.
Oversold Condition & Action: An RSI dipping below 40 signals an oversold condition, turning red, and aligning with a potential for a next long signal. staying alert when RSI stay over 40 level again and over on RSI Moving Average Following the idea CULTURATRADING STRATEGY.
Moving Average on RSI (MA RSI):
The inclusion of a Moving Average on the RSI serves as a trend filter. When the RSI is above the MA RSI, it underscores the strength of the current trend; conversely, if the RSI falls below the MA RSI, it calls for close all RSI long trade.
Volatility Histogram:
Color Coding & Market Response: The histogram changes colors based on market volatility and trend strength. Blue indicates a bullish trend continuation, where traders might consider entering long or holding positions. Rose suggests a market shift where traders should be vigilant, potentially taking profits from long or opening shorts positions. Grey denotes low volatility, signaling a period of market indecision where entering new trades may carry higher risk. staying out
Stop-Loss Placement: The histogram assists in identifying optimal stop-loss levels, providing visual cues for setting them just beyond the recent volatility extremes to protect against market whipsaws.
ADX Trend Strength Layer:
This layer offers a visual representation of the trend's strength. A rising ADX above the 25 level with a slope on the MACD line indicates a strong trend and defining directionality to trade (long if it close blue or short if its close rose), reinforcing the confidence in following the trend.
Usage & Importance:
While the CULTURATRADING STRATEGY provides a robust framework for trade execution, the CULTURATRADING INDICATOR is crucial for visualizing and confirming the signals it generates. It simplifies the complex interplay of various technical signals into a coherent visual format, aiding traders in making informed decisions.
The combination of RSI, MA RSI, and the volatility histogram offers a tri-layered approach to market analysis, enabling traders to discern between strong trends, pullbacks, and consolidations.
By integrating these elements, the CULTURATRADING INDICATOR serves as an indispensable tool for traders utilizing the CULTURATRADING STRATEGY, providing clarity and enhancing decision-making efficacy.
Disclaimer:
This indicator is designed for educational purposes to provide a visual aid in market analysis. Traders are advised to use it as part of a comprehensive risk-managed strategy. It is not intended as financial advice.
Trending RSI [ChartPrime]Trending RSI takes a new approach to RSI intended to provide all of the missing information that traditional RSI lacks. Questions such as "why does the price continue to decline even during an oversold period?" can be aided using the Trending RSI.
These types of movements are due to the market still trending and traditional RSI can not tell traders this. Trending RSI fixes this by introducing trend information back into the oscillator. By reverse engineering RSI we have been able to make a new indicator that is no longer bound between 0 and 100. Instead it provides the traditional 70 and 30 zones as bands, and 50 as a center line that still represent these zones perfectly. This transforms RSI into a centered oscillator instead of a normalized oscillator. When the market is trending our indicator represents this as the center line being below or above 0. Just like MACD the center line is colored to represent the market phases. This helps in identifying reversals more clearly by adding a layer of confluence to the already renowned RSI. We have also included a novel filtering technique that has a low lag to smoothing ratio. This is primarily used to smooth the bands by default but you can also utilize this on the RSI. Several alerts have been included to provide users with easy to configure signals.
You can use the center line as a directional filter for your trades by only picking trades in the direction of the center line. When the center line is above 0, the market is trending up. Conversely, when the center line is below 0 the market is trending down trend. Use the polarity of the center line to estimate the strength of retracements from the oversold and overbought zones. We have also included a special moving average to help you find the momentum of a move. The Binomial MA filter approximates a normal curve making it similar to a gaussian filter. We have also included standard divergences which are fully configurable in the settings. Finally, we have built this indicator to be compatible with the built in multi time frame option to allow users to freely pick the time frame they wish to use. It is worth noting that due to the limitations of the standard MTF implementation divergences will not plot as expected when using time frames outside of the charts time frame. This is standard and also affects the built in RSI.
All of the colors are fully adjustable with the option to enable or disable the glow effect. We have also designed this indicator to only display the information for plots that are enabled to reduce clutter and provide a cleaner charting experience. All alerts are built to work with the standard alert builder and do not have to be enabled or disabled inside of the indicator.
Included Alerts:
RSI Cross Over Center
RSI Cross Under Center
RSI Cross Under Upper Range
RSI Cross Over Upper Range
RSI Cross Over Lower Range
RSI Cross Under Lower Range
RSI Cross Over MA
RSI Cross Under MA
RSI Cross Over 0
RSI Cross Under 0
Center Cross Over 0
Center Cross Under 0
Center Bullish
Center Bearish
Bullish Divergence
Bearish Divergence
In wrapping up, the Trending RSI aims to enhance the conventional RSI by adding trend insights directly into the oscillator, addressing the gap that traditional RSI leaves regarding market trends. This version of RSI breaks away from the 0 to 100 range, offering bands and a center line that better represent market conditions. It includes a set of features like the Binomial MA for momentum analysis, configurable settings for divergence detection, and compatibility with multi-time frame analysis. The color customization and glow effects aim to improve visual clarity, and the inclusion of alerts is designed to streamline alert configuration. Overall, this indicator is designed to provide a more view of the markets, suitable for traders looking to incorporate trend analysis into their RSI-based strategies.
Enjoy

Rate of Change RSIIndicator Name: Rate of Change RSI
Description:
The Rate of Change (ROC) of the Relative Strength Index (RSI) is a technical indicator designed to provide insights into the momentum of an asset's price movement. It combines the Relative Strength Index (RSI), a popular momentum oscillator, with the Rate of Change (ROC) concept to assess the speed at which RSI values are changing.
How It Works:
Relative Strength Index (RSI): The RSI measures the magnitude of recent price changes to evaluate overbought or oversold conditions in an asset. It oscillates between 0 and 100, with readings above 70 typically indicating overbought conditions and readings below 30 indicating oversold conditions.
Rate of Change (ROC): The ROC calculates the percentage change in a given indicator over a specified period. In this indicator, we apply the ROC to the RSI values to determine how quickly the RSI is changing over time.
Key Features:
Acceleration and Deceleration: The ROC of RSI helps traders identify whether the momentum of the RSI is accelerating or decelerating. Positive values suggest increasing momentum, while negative values indicate decreasing momentum.
Dynamic Color Change: The color of the ROC RSI line changes dynamically based on the RSI level. When the RSI is between 0 and 40, the line color is blue, indicating potential oversold conditions. When the RSI is between 40 and 60, the line color is yellow, suggesting neutral conditions. When the RSI is above 60, the line color changes to green, indicating potential overbought conditions.
How to Use:
Acceleration: When the ROC RSI is positive and increasing while the RSI is above 60 (green), it may signal strong upward momentum.
Deceleration: Conversely, if the ROC RSI is negative and decreasing while the RSI is below 40 (blue), it may indicate weakening downward momentum.
Originality and Usefulness:
This indicator combines the RSI, a well-known momentum oscillator, with the ROC concept to provide a unique perspective on momentum dynamics. By dynamically adjusting the color of the ROC RSI line based on RSI levels, traders can quickly assess potential overbought or oversold conditions in the market.
Chart:
The chart displayed alongside this script provides a clean and easy-to-understand visualization of the ROC RSI indicator. The ROC RSI line color changes dynamically based on RSI levels, allowing traders to visually identify potential market conditions at a glance.

Dynamic Momentum Oscillator (DMO) [Angel Algo]Dynamic Momentum Oscillator (DMO)
OVERVIEW: The Dynamic Momentum Oscillator (DMO) is a technical indicator designed to measure the momentum of price movements in financial markets. It combines momentum calculation with dynamic range assessment to provide insights into potential trend reversals and overbought/oversold conditions.
DMO is different from classic momentum oscillators like the RSI or Stochastic Oscillator because it looks at the momentum in relation to how much the price is moving. This helps it give signals that better match what's happening in the market, especially when the market's volatility is changing.
HOW TO USE:
Interpretation:
Thresholds: Horizontal lines mark user-defined threshold levels for overbought (OB) and oversold (OS) conditions, aiding in identifying potential trend pullbacks and reversals.
DMO Line: The primary line on the indicator plot. It reflects momentum in relation to the dynamic price range. Positive values indicate bullish momentum, while negative values indicate bearish momentum.
Filled Area: The area between the DMO line and the zero line is filled with color to enhance visualization of momentum shifts.
Trading Signals:
Thresholds: Monitor for potential trend reversals when the DMO crosses above the overbought threshold or below the oversold threshold.
Crossovers: Look for buy signals when the DMO line crosses above the zero and sell signals when it crosses below.
Filled Area: The green color indicates bullish momentum, red indicates bearish momentum and gray color indicates neutral conditions.
Signals: Circles appear on the chart when the DMO crosses the overbought or oversold thresholds, indicating conditions for potential trend pullbacks or reversals.
SETTINGS:
Length: Adjust the length parameter to vary the number of periods considered in the momentum calculation.
Smoothing: Enable or disable smoothing of the DMO line using the provided option.
Thresholds: Customize the overbought and oversold threshold levels to suit specific market conditions and trading preferences.
Disclaimer: The DMO indicator serves as part of a comprehensive trading strategy and should not be solely relied upon for trading decisions. Past performance is not indicative of future results, and trading involves inherent risks.

RSI Volatility Bands [QuantraSystems]RSI Volatility Bands
Introduction
The RSI Volatility Bands indicator introduces a unique approach to market analysis by combining the traditional Relative Strength Index (RSI) with dynamic, volatility adjusted deviation bands. It is designed to provide a highly customizable method of trend analysis, enabling investors to analyze potential entry and exit points in a new and profound way.
The deviation bands are calculated and drawn in a manner which allows investors to view them as areas of dynamic support and resistance.
Legend
Upper and Lower Bands - A dynamic plot of the volatility-adjusted range around the current price.
Signals - Generated when the RSI volatility bands indicate a trend shift.
Case Study
The chart highlights the occurrence of false signals, emphasizing the need for caution when the bands are contracted and market volatility is low.
Juxtaposing this, during volatile market phases as shown, the indicator can effectively adapt to strong trends. This keeps an investor in a position even through a minor drawdown in order to exploit the entire price movement.
Recommended Settings
The RSI Volatility Bands are highly customisable and can be adapted to many assets with diverse behaviors.
The calibrations used in the above screenshots are as follows:
Source = close
RSI Length = 8
RSI Smoothing MA = DEMA
Bandwidth Type = DEMA
Bandwidth Length = 24
Bandwidth Smooth = 25
Methodology
The indicator first calculates the RSI of the price data, and applies a custom moving average.
The deviation bands are then calculated based upon the absolute difference between the RSI and its moving average - providing a unique volatility insight.
The deviation bands are then adjusted with another smoothing function, providing clear visuals of the RSI’s trend within a volatility-adjusted context.
rsiVal = ta.rsi(close, rsiLength)
rsiEma = ma(rsiMA, rsiVal, bandLength)
bandwidth = ma(bandMA, math.abs(rsiVal - rsiEma), bandLength)
upperBand = ma(bandMA, rsiEma + bandwidth, smooth)
lowerBand = ma(bandMA, rsiEma - bandwidth, smooth)
long = upperBand > 50 and not (lowerBand < lowerBand and lowerBand < 50)
short= not (upperBand > 50 and not (lowerBand < lowerBand and lowerBand < 50))
By dynamically adjusting to market conditions, the RSI trend bands offer a unique perspective on market trends, and reversal zones.

Stoch + RSI Oscillator @shrilssThis script combines two powerful indicators, the Stochastic Oscillator and the Relative Strength Index (RSI), to offer traders a comprehensive view of market dynamics.
The Stochastic Oscillator, known for its effectiveness in identifying overbought and oversold conditions, is enhanced here with a smoothing mechanism to provide clearer signals. The script calculates the %K and %D lines of the Stochastic Oscillator, then applies a smoothing factor to %K, resulting in a smoother representation of price momentum.
Simultaneously, the RSI component offers insights into the strength of price movements. By comparing the average gains and losses over a specified period, it provides a measure of bullish and bearish sentiment within the market.
This script's innovation lies in its integration of these two indicators. The Stochastic Oscillator's smoothed %K line and the RSI are compared to dynamic thresholds, enabling traders to identify potential trend reversals and confirmations more effectively. When the RSI crosses above or below the Stochastic %D line, it can signal potential shifts in market momentum.
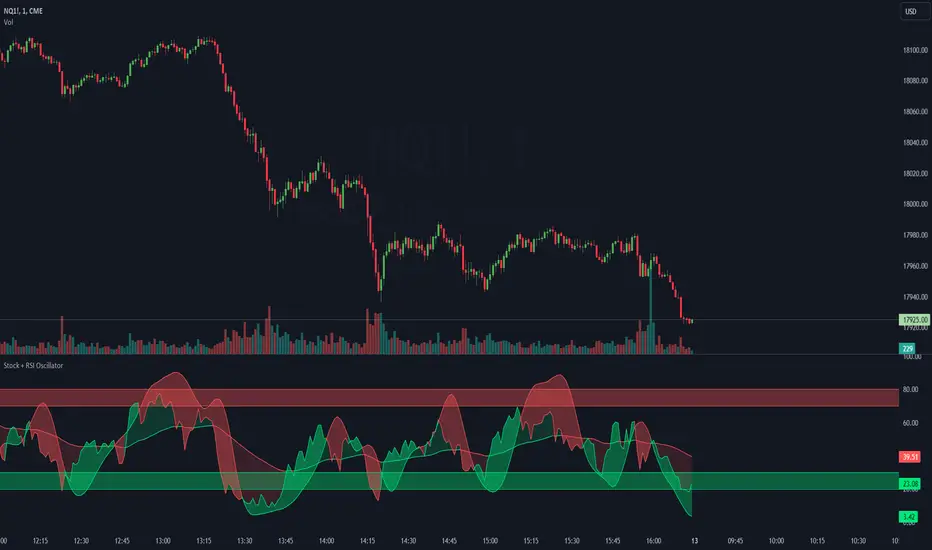
RSI Divergence AlertsIndicator Description: RSI Divergence Alerts
The RSI Divergence indicator is a technical analysis tool that identifies divergences between the Relative Strength Index (RSI) and the price of an asset. The RSI is a momentum indicator that measures the speed and magnitude of recent changes in an asset's price, while divergences occur when there is a disparity between price movements and the RSI.
Indicator Customization:
Overbought and Oversold: The indicator allows you to customize the overbought and oversold levels of the RSI. This allows traders to adjust parameters according to their preferences and the historical behavior of the asset in question.
Indicator Settings and Recommended Adjustments:
Max Bar Distance: This parameter determines the maximum distance allowed between two low or high points for a divergence to be recognized. A higher value may result in more signals, but may also increase the number of false signals. It is recommended to adjust this value based on the volatility of the asset and the time period in which it is being traded.
RSI Length: This is the time period used to calculate the RSI. A longer period smoothes the indicator, while a shorter period makes it more sensitive to price changes. The default value is 14, but traders can adjust it based on their trading strategy and the asset's volatility.
RSI Overbought and Oversold: These values determine the levels at which the RSI is considered overbought and oversold, respectively. The default value for overbought is 75 and for oversold is 35. Traders can adjust these values according to the asset's volatility and its historical analysis. For example, in more volatile assets, it may be useful to use more extreme levels, such as 80 for overbought and 20 for oversold.
When adjusting indicator settings, traders must consider the balance between sensitivity and accuracy. Careful tuning of these parameters can help filter out false signals and identify more reliable trading opportunities.
The alerts functionality in this RSI Divergence indicator is designed to notify traders when a bearish divergence or a bullish divergence is detected. Here's how it works:
Conditionally Triggered Alerts:
Alerts are triggered based on the boolean variables bearishDivergence and bullishDivergence.
If bearishDivergence is true, it indicates that a bearish divergence has been detected.
If bullishDivergence is true, it indicates that a bullish divergence has been detected.
Alert Message:
When a divergence is detected, an alert message is generated to inform the trader about the event.
The message includes details about the divergence, such as the difference in the RSI value between the two points forming the divergence.
For example, for a bearish divergence, the message will include the phrase "Bearish RSI Divergence Detected" and the RSI difference between the high and low points of the divergence.
Alert Frequency:
Alerts are configured to be triggered once per bar close (alert.freq_once_per_bar_close), which means the alert will only be sent once at the close of each bar.
This helps to avoid multiple alerts for the same divergence during the same time period.
Additional Alert Conditions:
In addition to conditionally triggered alert messages, alert conditions are defined for both bearish and bullish divergences.
These alert conditions are useful for configuring custom alerts on trading platforms that support running Pine Script code.
Overall, this alert functionality allows traders to stay informed about potential trading opportunities based on divergences detected by the indicator. This can help traders make faster and more informed decisions in their trading processes.
