Renko Velocity Meter [Chris Chapman]Here is the comprehensive copy for your Renko Velocity Meter indicator. This is structured to be used in a TradingView description, a manual, or a product listing.
Renko Velocity Meter
What is this Indicator?
The Renko Velocity Meter is a specialized momentum dashboard designed strictly for Renko Charts. Unlike standard oscillators (like RSI or MACD) which often fail on Renko due to the lack of time-based data, this tool uses "Brick Physics" to measure the actual speed and efficiency of price movement.
It answers the most critical question in Renko trading: "Is this a real trend, or just a choppy consolidation?"
Instead of giving you lagging signals, it provides a real-time Velocity Score (0-100) displayed on a dashboard directly on your chart. It automatically filters out "fake" moves and highlights high-probability "TURBO" conditions when the market enters a powerful extension phase.
How It Is Calculated
The Velocity Score is derived from a proprietary blend of three distinct mathematical checks:
1. Trend Efficiency ("The Snake Logic") The script calculates the ratio between the Net Price Move and the Total Distance Traveled over a lookback period.
High Efficiency: Price is moving in a straight line (Strong Trend).
Low Efficiency: Price is winding back and forth (Chop/Range).
2. Momentum Deviation (Auto-Brick Detection) The indicator automatically detects your specific Renko brick size (whether 2 pips, 10 points, or custom) without manual input. It then measures how many "Bricks" the price has pulled away from the baseline Moving Average.
If price is 6+ bricks away from the average, it signals a high-momentum extension.
3. HTF Trend Lock (Multi-Timeframe Filter) It internally checks a Higher Timeframe (default: 15-minute) to ensure you are trading with the dominant trend.
HTF LOCK: The Renko trend and the 15m trend are aligned (Green).
HTF MIX: The trends are conflicting. The score is automatically capped at 60 to prevent false signals.
4. The "Counter-Trend" Penalty To prevent buying tops or selling bottoms, the script instantly penalizes the score if a "Retracement Brick" forms.
Example: If the trend is UP, but a RED brick forms, the score is forced down to the "Yellow/Neutral" zone until the trend resumes.
Requirements
To use this indicator effectively, you must meet the following chart conditions:
Chart Type: Renko (This is mandatory. The math relies on fixed-size bricks).
Timeframe: Works on all timeframes, but optimized for standard scalping setups (e.g., 2-pip fixed bricks on EURUSD/Gold).
Data Feed: High-quality data is recommended. For maximum precision, use a 1-second (1s) interval setting for your Renko box generation if your TradingView plan allows it.
The Inputs (Settings)
You can customize the sensitivity of the meter to fit your specific asset class:
Trend Efficiency Period (Default: 14):
The number of bricks used to calculate how "straight" the trend is. Lower numbers make the score faster; higher numbers make it smoother.
Momentum Baseline (Default: 20):
The length of the internal Moving Average used as the "mean" price.
Max Momentum in Bricks (Default: 6):
How many bricks of extension are required to hit a "100% Score"? Increase this for volatile assets like Gold or Bitcoin.
HTF Support (Default: 15):
The Higher Timeframe used for the Trend Lock filter.
Meter Position:
Choose where the dashboard appears on your screen (Top Right, Bottom Left, etc.).
Dashboard Legend
GREEN (Score > 70): TURBO – Strong trend alignment. High probability of continuation.
YELLOW (Score 50-70): TREND – Active trend, but potentially stalling or retracing.
RED (Score < 50): CHOP – No clear direction or conflicting signals. Stay flat.
POSITION: Shows the current logic state (LONG/SHORT/FLAT).
Renko

Dynamic ATR-based Renko Overlay - Non repaintingDaily ATR-Based Renko Overlay
Overview
This Pine Script v5 indicator creates a dynamic Renko overlay on your time-based charts (optimized for 1-minute timeframes), using the previous period's ATR from a user-specified higher timeframe (default: 1-hour) to determine brick sizes. Unlike traditional Renko charts, this is an overlay that draws Renko bricks directly on top of your existing candles, allowing you to combine the noise-filtering power of Renko with the full features of time-based charts.
It's designed for traders who want Renko's trend-clarity benefits without switching chart types, especially useful for intraday trading in volatile markets like forex, stocks, or crypto.
Key Features
- Adaptive Brick Sizing: Brick size is calculated as a percentage (default 40%) of the previous period's ATR (Average True Range, default length 14) from the selected higher timeframe (default: 1-hour). This makes bricks volatility-adjusted—larger in high-vol periods to reduce noise, smaller in low-vol for more detail.
- Periodic Recalculation: Resets brick size at the start of each new period based on the user-specified reset timeframe (default: daily), using the prior period's ATR from the chosen timeframe. This ensures relevance without unwanted disruptions.
- Traditional Renko Logic: Uses 1-box reversal (a full brick against the trend to reverse). Bricks form based on closing prices, ignoring time and minor fluctuations.
- Visual Style: Stepped lines with green (up) and red (down) fills for a box-like appearance. Semi-transparent for easy overlay on candles.
- Customizable Inputs:
- ATR Length: Adjust the ATR period (default: 14).
- Percentage of ATR: Fine-tune brick sensitivity (default: 0.4 or 40%; range 0-1).
- ATR Timeframe: Specify the timeframe for ATR calculation (default: "60" for 1-hour; enter as a string like "240" for 4-hour, "D" for daily, etc.).
- Reset Timeframe: Specify the period for recalculating the brick size (default: "D" for daily; enter as a string like "W" for weekly, "M" for monthly, etc.).
How It Works
1. Fetches ATR from the user-specified timeframe via `request.security` for higher-timeframe volatility data.
2. On new periods based on the reset timeframe (or first load), sets brick size to `percent * ATR_HTF`.
3. Tracks Renko "close" and "previous close" to calculate bricks:
- Upward moves add green bricks in multiples of the size.
- Downward moves add red bricks.
- Reversals require a full brick against the direction.
4. Plots and fills create the overlay, updating on each 1-min bar close.
Add it to a 1-minute chart for best results—bricks will adapt periodically while you retain full candle visibility.
Why This Indicator is Helpful
TradingView's native Renko charts are powerful but come with limitations that can frustrate serious traders:
- No Bar Replay: Native Renko doesn't support TradingView's bar replay feature, making it hard to simulate historical trading sessions.
- Inaccurate/Repainting Strategy Testing: Strategies on native Renko can repaint or lack precision due to the non-time-based nature, leading to unreliable backtests.
- Limited Data History: Fast Renko timeframes (e.g., small bricks) often load very little historical data, restricting long-term analysis.
This overlay solves these by building Renko on a time-based chart:
- Full Bar Replay Support: Replay sessions as usual on your 1-min chart—the Renko follows along.
- Accurate, Non-Repainting Testing: Test strategies on the underlying time chart without repainting issues, as Renko is derived from closes.
- Unlimited Data Depth: Access TradingView's full historical data for 1-min charts (up to years of bars), not limited by Renko's data constraints.
- Hybrid Analysis: Overlay Renko on candles to spot trends while using volume, indicators (e.g., RSI, MAs), or drawing tools that don't work well on native Renko.
It's a game-changer for trend-following, breakout strategies, or filtering noise in short-term trades. No more switching charts—get the best of both worlds!
Usage Tips
- Best on 1-min charts for intraday precision, but experiment with others.
- Tune the percentage lower (e.g., 0.3) for more bricks/sensitivity, higher (e.g., 0.5) for fewer/false-signal reduction.
- Adjust the ATR timeframe to match your strategy—e.g., "240" for longer-term volatility or "15" for shorter.
- Customize the reset timeframe for different recalculation frequencies—e.g., "W" for weekly resets to capture broader market shifts, or "240" for every 4 hours.
- Combine with alerts: right now I am experimenting with 90 period EMA and the Renko brick pullbacks to find some EDGE
If you find this useful, give it a thumbs up or share your tweaks in the comments. Feedback welcome—happy trading! 🚀

Renko ScalperWhat it is-
A lightweight Renko Scalper that combines Renko brick direction with an internal EMA trend filter and MACD confirmation to signal high-probability short-term entries. EMAs are used internally (hidden from the chart) so the visual remains uncluttered.
Signals-
Buy arrow: Renko direction turns bullish AND EMA trend up AND MACD histogram positive.
Sell arrow: Renko direction turns bearish AND EMA trend down AND MACD histogram negative.
Consecutive same-direction signals are suppressed (only one arrow per direction until opposite signal).
Visuals-
Buy / Sell arrows (large) above/below bars.
Chart background tints green/red after the respective signal for easy glance recognition.
Inputs:-
Renko Box Size (points)
EMA Fast / EMA Slow
MACD fast/slow/signal lengths
How to use-
Add to chart
Use smaller Renko box sizes for scalping, larger for swing-like entries.
Confirm signal with price action and volume—this indicator is a signal generator, not a full automated system.
Use alerts (built in) to receive Buy / Sell arrow notifications.
Alerts-
Buy Arrow — buySignal
Sell Arrow — sellSignal
Buy Background / Sell Background — background-color state alerts
Recommended settings-
Timeframes: 1m–15m for scalping, 5m for balanced intraday.
Symbols: liquid futures/currency pairs/major crypto.
Disclaimer
This script is educational and not financial advice. Backtest and forward test on a demo account before live use. Past performance is not indicative of future results. Use proper risk management.

Superior-Range Bound Renko - Alerts - 11-29-25 - Signal LynxSuperior-Range Bound Renko – Alerts Edition with Advanced Risk Management Template
Signal Lynx | Free Scripts supporting Automation for the Night-Shift Nation 🌙
1. Overview
This is the Alerts & Indicator Edition of Superior-Range Bound Renko (RBR).
The Strategy version is built for backtesting inside TradingView.
This Alerts version is built for automation: it emits clean, discrete alert events that you can route into webhooks, bots, or relay engines (including your own Signal Lynx-style infrastructure).
Under the hood, this script contains the same core engine as the strategy:
Adaptive Range Bounding based on volatility
Renko Brick Emulation on standard candles
A stack of Laguerre Filters for impulse detection
K-Means-style Adaptive SuperTrend for trend confirmation
The full Signal Lynx Risk Management Engine (state machine, layered exits, AATS, RSIS, etc.)
The difference is in what we output:
Instead of placing historical trades, this version:
Plots the entry and RM signals in a separate pane (overlay = false)
Exposes alertconditions for:
Long Entry
Short Entry
Close Long
Close Short
TP1, TP2, TP3 hits (Staged Take Profit)
This makes it ideal as the signal source for automated execution via TradingView Alerts + Webhooks.
2. Quick Action Guide (TL;DR)
Best Timeframe:
4H and above. This is a swing-trading / position-trading style engine, not a micro-scalper.
Best Assets:
Volatile but structured markets, e.g.:
BTC, ETH, XAUUSD (Gold), GBPJPY, and similar high-volatility majors or indices.
Script Type:
indicator() – Alerts & Visualization Only
No built-in order placement
All “orders” are emitted as alerts for your external bot or manual handling
Strategy Type:
Volatility-Adaptive Trend Following + Impulse Detection
using Renko-like structure and multi-layer Laguerre filters.
Repainting:
Designed to be non-repainting on closed candles.
The underlying Risk Management engine is built around previous-bar data (close , high , low ) for execution-critical logic.
Intrabar values can move while the bar is forming (normal for any advanced signal), but once a bar closes, the alert logic is stable.
Recommended Alert Settings:
Condition: one of the built-in signals (see section 3.B)
Options: “Once Per Bar Close” is strongly recommended for automation
Message: JSON, CSV, or simple tokens – whatever your webhook / relay expects
3. Detailed Report: How the Alerts Edition Works
A. Relationship to the Strategy Version
The Alerts Edition shares the same internal logic as the strategy version:
Same Adaptive Lookback and volatility normalization
Same Range and Close Range construction
Same Renko Brick Emulator and directional memory (renkoDir)
Same Fib structures, Laguerre stack, K-Means SuperTrend, and Baseline signals (B1, B2)
Same Risk Management Engine and layered exits
In the strategy script, these signals are wired into strategy.entry, strategy.exit, and strategy.close.
In the alerts script:
We still compute the final entry/exit signals (Fin, CloseEmAll, TakeProfit1Plot, etc.)
Instead of placing trades, we:
Plot them for visual inspection
Expose them via alertcondition(...) so that TradingView can fire alerts.
This ensures that:
If you use the same settings on the same symbol/timeframe, the Alerts Edition and Strategy Edition agree on where entries and exits occur.
(Subject only to normal intrabar vs. bar-close differences.)
B. Signals & Alert Conditions
The alerts script focuses on discrete, automation-friendly events.
Internally, the main signals are:
Fin – Final entry decision from the RM engine
CloseEmAll – RM-driven “hard close” signal (for full-position exits)
TakeProfit1Plot / 2Plot / 3Plot – One-time event markers when each TP stage is hit
On the chart (in the separate indicator pane), you get:
plot(Fin) – where:
+2 = Long Entry event
-2 = Short Entry event
plot(CloseEmAll) – where:
+1 = “Close Long” event
-1 = “Close Short” event
plot(TP1/TP2/TP3) (if Staged TP is enabled) – integer tags for TP hits:
+1 / +2 / +3 = TP1 / TP2 / TP3 for Longs
-1 / -2 / -3 = TP1 / TP2 / TP3 for Shorts
The corresponding alertconditions are:
Long Entry
alertcondition(Fin == 2, title="Long Entry", message="Long Entry Triggered")
Fire this to open/scale a long position in your bot.
Short Entry
alertcondition(Fin == -2, title="Short Entry", message="Short Entry Triggered")
Fire this to open/scale a short position.
Close Long
alertcondition(CloseEmAll == 1, title="Close Long", message="Close Long Triggered")
Fire this to fully exit a long position.
Close Short
alertcondition(CloseEmAll == -1, title="Close Short", message="Close Short Triggered")
Fire this to fully exit a short position.
TP 1 Hit
alertcondition(TakeProfit1Plot != 0, title="TP 1 Hit", message="TP 1 Level Reached")
First staged take profit hit (either long or short). Your bot can interpret the direction based on position state or message tags.
TP 2 Hit
alertcondition(TakeProfit2Plot != 0, title="TP 2 Hit", message="TP 2 Level Reached")
TP 3 Hit
alertcondition(TakeProfit3Plot != 0, title="TP 3 Hit", message="TP 3 Level Reached")
Together, these give you a complete trade lifecycle:
Open Long / Short
Optionally scale out via TP1/TP2/TP3
Close remaining via Close Long / Close Short
All while the Risk Management Engine enforces the same logic as the strategy version.
C. Using This Script for Automation
This Alerts Edition is designed for:
Webhook-based bots
Execution relays (e.g., your own Lynx-Relay-style engine)
Dedicated external trade managers
Typical setup flow:
Add the script to your chart
Same symbol, timeframe, and settings you use in the Strategy Edition backtests.
Configure Inputs:
Longs / Shorts enabled
Risk Management toggles (SL, TS, Staged TP, AATS, RSIS)
Weekend filter (if you do not want weekend trades)
RBR-specific knobs (Adaptive Lookback, Brick type, ATR vs Standard Brick, etc.)
Create Alerts for Each Event Type You Need:
Long Entry
Short Entry
Close Long
Close Short
TP1 / TP2 / TP3 (optional, if your bot handles partial closes)
For each:
Condition: the corresponding alertcondition
Option: “Once Per Bar Close” is strongly recommended
Message:
You can use structured JSON or a simple token set like:
{"side":"long","event":"entry","symbol":"{{ticker}}","time":"{{timenow}}"}
or a simpler text for manual trading like:
LONG ENTRY | {{ticker}} | {{interval}}
Wire Up Your Bot / Relay:
Point TradingView’s webhook URL to your execution engine
Parse the messages and map them into:
Exchange
Symbol
Side (long/short)
Action (open/close/partial)
Size and risk model (this script does not position-size for you; it only signals when, not how much.)
Because the alerts come from a non-repainting, RM-backed engine that you’ve already validated via the Strategy Edition, you get a much cleaner automation pipeline.
D. Repainting Protection (Alerts Edition)
The same protections as the Strategy Edition apply here:
Execution-critical logic (trailing stop, TP triggers, SL, RM state changes) uses previous bar OHLC:
open , high , low , close
No security() with lookahead or future-bar dependencies.
This means:
Alerts are designed to fire on states that would have been visible at bar close, not on hypothetical “future history.”
Important practical note:
Intrabar: While a bar is forming, internal conditions can oscillate.
Bar Close: With “Once Per Bar Close” alerts, the fired signal corresponds to the final state of the engine for that candle, matching your Strategy Edition expectations.
4. For Developers & Modders
You can treat this Alerts script as an ”RM + Alert Framework” and inject any signal logic you want.
Where to plug in:
Find the section:
// BASELINE & SIGNAL GENERATION
You’ll see how B1 and B2 are built from the RBR stack and then combined:
baseSig = B2
altSig = B1
finalSig = sigSwap ? baseSig : altSig
To use your own logic:
Replace or wrap the code that sets baseSig / altSig with your own conditions:
e.g., RSI, MACD, Heikin Ashi filters, candle patterns, volume filters, etc.
Make sure your final decision is still:
2 → Long / Buy signal
-2 → Short / Sell signal
0 → No trade
finalSig is then passed into the RM engine and eventually becomes Fin, which:
Drives the Long/Short Entry alerts
Interacts with the RM state machine to integrate properly with AATS, SL, TS, TP, etc.
Because this script already exposes alertconditions for key lifecycle events, you don’t need to re-wire alerts each time — just ensure your logic feeds into finalSig correctly.
This lets you use the Signal Lynx Risk Management Engine + Alerts wrapper as a drop-in chassis for your own strategies.
5. About Signal Lynx
Automation for the Night-Shift Nation 🌙
Signal Lynx builds tools and templates that help traders move from:
“I have an indicator” → “I have a structured, automatable strategy with real risk management.”
This Superior-Range Bound Renko – Alerts Edition is the automation-focused companion to the Strategy Edition. It’s designed for:
Traders who backtest with the Strategy version
Then deploy live signals with this Alerts version via webhooks or bots
While relying on the same non-repainting, RM-driven logic
We release this code under the Mozilla Public License 2.0 (MPL-2.0) to support the Pine community with:
Transparent, inspectable logic
A reusable Risk Management template
A reference implementation of advanced adaptive logic + alerts
If you are exploring full-stack automation (TradingView → Webhooks → Exchange / VPS), keep Signal Lynx in your search.
License: Mozilla Public License 2.0 (Open Source).
If you build improvements or helpful variants, please consider sharing them back with the community.

Superior-Range Bound Renko - Strategy - 11-29-25 - SignalLynxSuperior-Range Bound Renko Strategy with Advanced Risk Management Template
Signal Lynx | Free Scripts supporting Automation for the Night-Shift Nation 🌙
1. Overview
Welcome to Superior-Range Bound Renko (RBR) — a volatility-aware, structure-respecting swing-trading system built on top of a full Risk Management (RM) Template from Signal Lynx.
Instead of relying on static lookbacks (like “14-period RSI”) or plain MA crosses, Superior RBR:
Adapts its range definition to market volatility in real time
Emulates Renko Bricks on a standard, time-based chart (no Renko chart type required)
Uses a stack of Laguerre Filters to detect genuine impulse vs. noise
Adds an Adaptive SuperTrend powered by a small k-means-style clustering routine on volatility
Under the hood, this script also includes the full Signal Lynx Risk Management Engine:
A state machine that separates “Signal” from “Execution”
Layered exit tools: Stop Loss, Trailing Stop, Staged Take Profit, Advanced Adaptive Trailing Stop (AATS), and an RSI-style stop (RSIS)
Designed for non-repainting behavior on closed candles by basing execution-critical logic on previous-bar data
We are publishing this as an open-source template so traders and developers can leverage a professional-grade RM engine while integrating their own signal logic if they wish.
2. Quick Action Guide (TL;DR)
Best Timeframe:
4 Hours (H4) and above. This is a high-conviction swing-trading system, not a scalper.
Best Assets:
Volatile instruments that still respect market structure:
Bitcoin, Ethereum, Gold (XAUUSD), high-volatility Forex pairs (e.g., GBPJPY), indices with clean ranges.
Strategy Type:
Volatility-Adaptive Trend Following + Impulse Detection.
It hunts for genuine expansion out of ranges, not tiny mean-reversion nibbles.
Key Feature:
Renko Emulation on time-based candles.
We mathematically model Renko Bricks and overlay them on your standard chart to define:
“Equilibrium” zones (inside the brick structure)
“Breakout / impulse” zones (when price AND the impulse line depart from the bricks)
Repainting:
Designed to be non-repainting on closed candles.
All RM execution logic uses confirmed historical data (no future bars, no security() lookahead). Intrabar flicker during formation is allowed, but once a bar closes the engine’s decisions are stable.
Core Toggles & Filters:
Enable Longs and Shorts independently
Optional Weekend filter (block trades on Saturday/Sunday)
Per-module toggles: Stop Loss, Trailing Stop, Staged Take Profits, AATS, RSIS
3. Detailed Report: How It Works
A. The Strategy Logic: Superior RBR
Superior RBR builds its entry signal from multiple mathematical layers working together.
1) Adaptive Lookback (Volatility Normalization)
Instead of a fixed 100-bar or 200-bar range, the script:
Computes ATR-based volatility over a user-defined period.
Normalizes that volatility relative to its recent min/max.
Maps the normalized value into a dynamic lookback window between a minimum and maximum (e.g., 4 to 100 bars).
High Volatility:
The lookback shrinks, so the system reacts faster to explosive moves.
Low Volatility:
The lookback expands, so the system sees a “bigger picture” and filters out chop.
All the core “Range High/Low” and “Range Close High/Low” boundaries are built on top of this adaptive window.
2) Range Construction & Quick Ranges
The engine constructs several nested ranges:
Outer Range:
rangeHighFinal – dynamic highest high
rangeLowFinal – dynamic lowest low
Inner Close Range:
rangeCloseHighFinal – highest close
rangeCloseLowFinal – lowest close
Quick Ranges:
“Half-length” variants of those, used to detect more responsive changes in structure and volatility.
These ranges define:
The macro box price is trading inside
Shorter-term “pressure zones” where price is coiling before expansion
3) Renko Emulation (The Bricks)
Rather than using the Renko chart type (which discards time), this script emulates Renko behavior on your normal candles:
A “brick size” is defined either:
As a standard percentage move, or
As a volatility-driven (ATR) brick, optionally inhibited by a minimum standard size
The engine tracks a base value and derives:
brickUpper – top of the emulated brick
brickLower – bottom of the emulated brick
When price moves sufficiently beyond those levels, the brick “shifts”, and the directional memory (renkoDir) updates:
renkoDir = +2 when bricks are advancing upward
renkoDir = -2 when bricks are stepping downward
You can think of this as a synthetic Renko tape overlaid on time-based candles:
Inside the brick: equilibrium / consolidation
Breaking away from the brick: momentum / expansion
4) Impulse Tracking with Laguerre Filters
The script uses multiple Laguerre Filters to smooth price and brick-derived data without traditional lag.
Key filters include:
LagF_1 / LagF_W: Based on brick upper/lower baselines
LagF_Q: Based on HLCC4 (high + low + 2×close)/4
LagF_Y / LagF_P: Complex averages combining brick structures and range averages
LagF_V (Primary Impulse Line):
A smooth, high-level impulse line derived from a blend of the above plus the outer ranges
Conceptually:
When the impulse line pushes away from the brick structure and continues in one direction, an impulse move is underway.
When its direction flips and begins to roll over, the impulse is fading, hinting at mean reversion back into the range.
5) Fib-Based Structure & Swaps
The system also layers in Fib levels derived from the adaptive ranges:
Standard levels (12%, 23.6%, 38.2%, 50%, 61%, 76.8%, 88%) from the main range
A secondary “swap” set derived from close-range dynamics (fib12Swap, fib23Swap, etc.)
These Fibs are used to:
Bucket price into structural zones (below 12, between 23–38, etc.)
Detect breakouts when price and Laguerre move beyond key Fib thresholds
Drive zSwap logic (where a secondary Fib set becomes the active structure once certain conditions are met)
6) Adaptive SuperTrend with K-Means-Style Volatility Clustering
Under the hood, the script uses a small k-means-style clustering routine on ATR:
ATR is measured over a fixed period
The range of ATR values is split into Low, Medium, High volatility centroids
Current ATR is assigned to the nearest centroid (cluster)
From that, a SuperTrend variant (STK) is computed with dynamic sensitivity:
In quiet markets, SuperTrend can afford to be tighter
In wild markets, it widens appropriately to avoid constant whipsaw
This SuperTrend-based oscillator (LagF_K and its signals) is then combined with the brick and Laguerre stack to confirm valid trend regimes.
7) Final Baseline Signals (+2 / -2)
The “brain” of Superior RBR lives in the Baseline & Signal Generation block:
Two composite signals are built: B1 and B2:
They combine:
Fib breakouts
Renko direction (renkoDir)
Expansion direction (expansionQuickDir)
Multiple Laguerre alignments (LagF_Q, LagF_W, LagF_Y, LagF_Z, LagF_P, LagF_V)
They also factor in whether Fib structures are expanding or contracting.
A user toggle selects the “Baseline” signal:
finalSig = B2 (default) or B1 (alternate baseline)
finalSig is then filtered through the RM state machine and only when everything aligns, we emit:
+2 = Long / Buy signal
-2 = Short / Sell signal
0 = No new trade
Those +2 / -2 values are what feed the Risk Management Engine.
B. The Risk Management (RM) Engine
This script features the Signal Lynx Risk Management Engine, a proprietary state machine built to separate Signal from Execution.
Instead of firing orders directly on indicator conditions, we:
Convert the raw signal into a clean integer (Fin = +2 / -2 / 0)
Feed it into a Trade State Machine that understands:
Are we flat?
Are we in a long or short?
Are we in a closing sequence?
Should we permit re-entry now or wait?
Logic Injection / Template Concept:
The RM engine expects a simple integer:
+2 → Buy
-2 → Sell
Everything else (0) is “no new trade”
This makes the script a template:
You can remove the Superior RBR block
Drop in your own logic (RSI, MACD, price action, etc.)
As long as you output +2 or -2 into the same signal channel, the RM engine can drive all exits and state transitions.
Aggressive vs Conservative Modes:
The input AgressiveRM (Aggressive RM) governs how we interpret signals:
Conservative Mode (Aggressive RM = false):
Uses a more filtered internal signal (AF) to open trades
Effectively waits for a clean trend flip / confirmation before new entries
Minimizes whipsaw at the cost of fewer trades
Aggressive Mode (Aggressive RM = true):
Reacts directly to the fresh alert (AO) pulses
Allows faster re-entries in the same direction after RM-based exits
Still respects your pyramiding setting; this script ships with pyramiding = 0 by default, so it will not stack multiple positions unless you change that parameter in the strategy() call.
The state machine enforces discipline on top of your signal logic, reducing double-fires and signal spam.
C. Advanced Exit Protocols (Layered Defense)
The exit side is where this template really shines. Instead of a single “take profit or stop loss,” it uses multiple, cooperating layers.
1) Hard Stop Loss
A classic percentage-based Stop Loss (SL) relative to the entry price.
Acts as a final “catastrophic protection” layer for unexpected moves.
2) Standard Trailing Stop
A percentage-based Trailing Stop (TS) that:
Activates only after price has moved a certain percentage in your favor (tsActivation)
Then trails price by a configurable percentage (ts)
This is a straightforward, battle-tested trailing mechanism.
3) Staged Take Profits (Three Levels)
The script supports three staged Take Profit levels (TP1, TP2, TP3):
Each stage has:
Activation percentage (how far price must move in your favor)
Trailing amount for that stage
Position percentage to close
Example setup:
TP1:
Activate at +10%
Trailing 5%
Close 10% of the position
TP2:
Activate at +20%
Trailing 10%
Close another 10%
TP3:
Activate at +30%
Trailing 5%
Close the remaining 80% (“runner”)
You can tailor these quantities for partial scaling out vs. letting a core position ride.
4) Advanced Adaptive Trailing Stop (AATS)
AATS is a sophisticated volatility- and structure-aware stop:
Uses Hirashima Sugita style levels (HSRS) to model “floors” and “ceilings” of price:
Dungeon → Lower floors → Mid → Upper floors → Penthouse
These levels classify where current price sits within a long-term distribution.
Combines HSRS with Bollinger-style envelopes and EMAs to determine:
Is price extended far into the upper structure?
Is it compressed near the lower ranges?
From this, it computes an adaptive factor that controls how tight or loose the trailing level (aATS / bATS) should be:
High Volatility / Penthouse areas:
Stop loosens to avoid getting wicked out by inevitable spikes.
Low Volatility / compressed structure:
Stop tightens to lock in and protect profit.
AATS is designed to be the “smart last line” that responds to context instead of a single fixed percentage.
5) RSI-Style Stop (RSIS)
On top of AATS, the script includes a RSI-like regime filter:
A McGinley Dynamic mean of price plus ATR bands creates a dynamic channel.
Crosses above the top band and below the lower band change a directional state.
When enabled (UseRSIS):
RSIS can confirm or veto AATS closes:
For longs: A shift to bearish RSIS can force exits sooner.
For shorts: A shift to bullish RSIS can do the same.
This extra layer helps avoid over-reactive stops in strong trends while still respecting a regime change when it happens.
D. Repainting Protection
Many strategies look incredible in the Strategy Tester but fail in live trading because they rely on intrabar values or future-knowledge functions.
This template is built with closed-candle realism in mind:
The Risk Management logic explicitly uses previous bar data (open , high , low , close ) for the key decisions on:
Trailing stop updates
TP triggers
SL hits
RM state transitions
No security() lookahead or future-bar access is used.
This means:
Backtest behavior is designed to match what you can actually get with TradingView alerts and live automation.
Signals may “flicker” intrabar while the candle is forming (as with any strategy), but on closed candles, the RM decisions are stable and non-repainting.
4. For Developers & Modders
We strongly encourage you to mod this script.
To plug your own strategy into the RM engine:
Look for the section titled:
// BASELINE & SIGNAL GENERATION
You will see composite logic building B1 and B2, and then selecting:
baseSig = B2
altSig = B1
finalSig = sigSwap ? baseSig : altSig
You can replace the content used to generate baseSig / altSig with your own logic, for example:
RSI crosses
MACD histogram flips
Candle pattern detectors
External condition flags
Requirements are simple:
Your final logic must output:
2 → Buy signal
-2 → Sell signal
0 → No new trade
That output flows into the RM engine via finalSig → AlertOpen → state machine → Fin.
Once you wire your signals into finalSig, the entire Risk Management system (Stops, TPs, AATS, RSIS, re-entry logic, weekend filters, long/short toggles) becomes available for your custom strategy without re-inventing the wheel.
This makes Superior RBR not just a strategy, but a reference architecture for serious Pine dev work.
5. About Signal Lynx
Automation for the Night-Shift Nation 🌙
Signal Lynx focuses on helping traders and developers bridge the gap between indicator logic and real-world automation. The same RM engine you see here powers multiple internal systems and templates, including other public scripts like the Super-AO Strategy with Advanced Risk Management.
We provide this code open source under the Mozilla Public License 2.0 (MPL-2.0) to:
Demonstrate how Adaptive Logic and structured Risk Management can outperform static, one-layer indicators
Give Pine Script users a battle-tested RM backbone they can reuse, remix, and extend
If you are looking to automate your TradingView strategies, route signals to exchanges, or simply want safer, smarter strategy structures, please keep Signal Lynx in your search.
License: Mozilla Public License 2.0 (Open Source).
If you make beneficial modifications, please consider releasing them back to the community so everyone can benefit.

Renko Open Range delta
Delta Renko-Style Indicator Guide (NQ Focus)
This indicator takes inspiration from the Renko Chart concept and is optimized for the RTH session (New York time zone), specifically applied to the Nasdaq futures (NQ) product.
If you’re unfamiliar with Renko charts, it may help to review their basics first, as this indicator borrows their clean, block-based perspective to simplify price interpretation.
⸻
🔧 How the Indicator Works
• At market open (9:30 AM EST), the indicator plots a horizontal open price line, referred to as 0 delta.
• From this anchor, it plots 10 incremental levels (deltas) both above and below the open, each spaced by 62.5 NQ points.
Why 62.5?
• With NQ currently trading in the 23,000–24,000 range, a 62.5-point move represents roughly 0.26% of the daily average range.
• This makes each delta step significant enough to capture movement while filtering out smaller noise.
A mini table (location adjustable) displays:
• Current delta zone
• Last touched delta level
This gives you a quick snapshot of where price sits relative to the open.
⸻
📈 How to Read the Market
• At the open, price typically oscillates between 0 and +1 / -1 delta.
• A break beyond this zone often signals stronger directional intent:
• Trending day: price can push into +2, +3, +4, +5 (or the inverse for downside).
• Range day: expect price to bounce between +1, 0, -1 deltas.
⚠️ Note: This is a visualization tool, not a trading system. Its purpose is to help you quickly recognize range vs. trend conditions.
⸻
📊 Example
• In this case, NQ reached +1 delta shortly after open.
• A retest of 0 delta followed, and price later surged to +5/+6 deltas (helped by Fed news).
⸻
🛠️ Practical Uses
This indicator can help you:
• Define profit targets
• Place hard stop levels
• Gauge whether a counter-trend trade is worth the risk
⚠️ Caution: Avoid counter-trend trades if price is aggressively pushing toward +5/+6 or -5/-6 deltas, as trend exhaustion usually hasn’t set in yet.
⸻
🔄 Adapting for ES (S&P Futures)
• On NQ, 62.5 points ≈ $1,250 per contract.
• For ES, this translates to 25 points.
• Since 1 NQ contract ≈ 2 ES contracts in dollar terms, an optimized ES delta step would be 12.5 points.
You may also experiment with different delta values (e.g., 50 or 31.25 for NQ) to align with your risk profile and trading style.
⸻
🧪 Extending Beyond NQ
You can experiment with applying this indicator to ES or even stocks, but non-futures assets may require additional calibration and testing.
⸻
✅ Bottom line: This tool provides a clean, Renko-inspired framework for quickly gauging trend vs. range conditions, setting realistic profit targets, and avoiding poor counter-trend setups.

Universal Renko Bars by SiddWolfUniversal Renko Bars or UniRenko Bars is an overlay indicator that applies the logic of Renko charting directly onto a standard candlestick chart. It generates a sequence of price-driven bricks, where each new brick is formed only when the price moves a specific amount, regardless of time. This provides a clean, price-action-focused visualization of the market's trend.
WHAT IS UNIVERSAL RENKO BARS?
For years, traders have faced a stark choice: the clean, noise-free world of Renko charts, or the rich, time-based context of Candlesticks. Choosing Renko meant giving up your favorite moving averages, volume profiles, and the fundamental sense of time. Choosing Candlesticks meant enduring the market noise that often clouds true price action.
But what if you didn't have to choose?
Universal Renko Bars is a revolutionary indicator that ends this dilemma. It's not just another charting tool; it's a powerful synthesis that overlays the pure, price-driven logic of Renko bricks directly onto your standard candlestick chart. This hybrid approach gives you the best of both worlds:
❖ The Clarity of Renko: By filtering out the insignificant noise of time, Universal Renko reveals the underlying trend with unparalleled clarity. Up trends are clean successions of green bricks; down trends are clear red bricks. No more guesswork.
❖ The Context of Candlesticks: Because the Renko logic is an overlay, you retain your time axis, your volume data, and full compatibility with every other time-based indicator in your arsenal (RSI, MACD, Moving Averages, etc.).
The true magic, however, lies in its live, Unconfirmed Renko brick. This semi-transparent box is your window into the current bar's real-time struggle. It grows, shrinks, and changes color with every tick, showing you exactly how close the price is to confirming the trend or forcing a reversal. It’s no longer a lagging indicator; it’s a live look at the current battle between buyers and sellers.
Universal Renko Bars unifies these two powerful charting methods, transforming your chart into a more intelligent, noise-free, and predictive analytical canvas.
HOW TO USE
To get the most out of Universal Renko Bars, here are a few tips and a full breakdown of the settings.
Initial Setup for the Best Experience
For the cleanest possible view, it's highly recommended that you hide the body of your standard candlesticks, that shows only the skelton of the candle. This allows the Renko bricks to become the primary focus of your chart.
→ Double click on the candles and uncheck the body checkbox.
Settings Breakdown
The indicator is designed to be powerful yet intuitive. The settings are grouped to make customization easy.
First, What is a "Tick"?
Before we dive in, it's important to understand the concept of a "Tick." In Universal Renko, a Tick is not the same as a market tick. It's a fundamental unit of price movement that you define. For example, if you set the Tick Size to $0.50, then a price move of $1.00 is equal to 2 Ticks. This is the core building block for all Renko bricks. Tick size here is dynamically determined by the settings provided in the indicator.
❖ Calculation Method (The "Tick Size" Engine)
This section determines the monetary value of a single "Tick."
`Calculation Method` : Choose your preferred engine for defining the Tick Size.
`ATR Based` (Default): The Tick Size becomes dynamic, based on market volatility (Average True Range). Bricks will get larger in volatile markets and smaller in quiet ones. Use the `ATR 14 Multiplier` to control the sensitivity.
`Percentage` : The Tick Size is a simple percentage of the current asset price, controlled by the `Percent Size (%)` input.
`Auto` : The "set it and forget it" mode. The script intelligently calculates a Tick Size based on the asset's price. Use the `Auto Sensitivity` slider to make these automatically calculated bricks thicker (value > 1.0) or thinner (value < 1.0).
❖ Parameters (The Core Renko Engine)
This group controls how the bricks are constructed based on the Tick Size.
`Tick Trend` : The number of "Ticks" the price must move in the same direction to print a new continuation brick. A smaller value means bricks form more easily.
`Tick Reversal` : The number of "Ticks" the price must move in the opposite direction to print a new reversal brick. This is typically set higher than `Tick Trend` (e.g., double) to filter out minor pullbacks and market noise.
`Open Offset` : Controls the visual overlap of the bricks. A value of `0` creates gapless bricks that start where the last one ended. A value of `2` (with a `Tick Reversal` of 4) creates the classic 50% overlap look.
❖ Visuals (Controlling What You See)
This is where you tailor the chart to your visual preference.
`Show Confirmed Renko` : Toggles the solid-colored, historical bricks. These are finalized and will never change. They represent the confirmed past trend.
`Show Unconfirmed Renko` : This is the most powerful visual feature. It toggles the live, semi-transparent box that represents the developing brick. It shows you exactly where the price is right now in relation to the levels needed to form the next brick.
`Show Max/Min Levels` : Toggles the horizontal "finish lines" on your chart. The green line is the price target for a bullish brick, and the red line is the target for a bearish brick. These are excellent for spotting breakouts.
`Show Info Label` : Toggles the on-chart label that provides key real-time stats:
🧱 Bricks: The total count of confirmed bricks.
⏳ Live: How many chart bars the current live brick has been forming. These bars forms the Renko bricks that aren't confirmed yet. Live = 0 means the latest renko brick is confirmed.
🌲 Tick Size: The current calculated value of a single Tick.
Hover over the label for a tooltip with live RSI(14), MFI(14), and CCI(20) data for additional confirmation.
TRADING STRATEGIES & IDEAS
Universal Renko Bars isn't just a visual tool; it's a foundation for building robust trading strategies.
Trend Confirmation: The primary use is to instantly identify the trend. A series of green bricks indicates a strong uptrend; a series of red bricks indicates a strong downtrend. Use this to filter out trades that go against the primary momentum.
Reversal Spotting: Pay close attention to the Unconfirmed Brick . When a strong trend is in place and the live brick starts to fight against it—changing color and growing larger—it can be an early warning that a reversal is imminent. Wait for the brick to be confirmed for a higher probability entry.
Breakout Trading: The `Max/Min Levels` are your dynamic breakout zones. A long entry can be considered when the price breaks and closes above the green Max Level, confirming a new bullish brick. A short entry can be taken when price breaks below the red Min Level.
Confluence & Indicator Synergy: This is where Universal Renko truly shines. Overlay a moving average (e.g., 20 EMA). Only take long trades when the green bricks are forming above the EMA. Combine it with RSI or MACD; a bearish reversal brick forming while the RSI shows bearish divergence is a very powerful signal.
A FINAL WORD
Universal Renko Bars was designed to solve a fundamental problem in technical analysis. It brings together the best elements of two powerful methodologies to give you a clearer, more actionable view of the market. By filtering noise while retaining context, it empowers you to make decisions with greater confidence.
Add Universal Renko Bars to your chart today and elevate your analysis. We welcome your feedback and suggestions for future updates!
Follow me to get notified when I publish New Indicator.
~ SiddWolf

MestreDoFOMO MACD VisualMasterDoFOMO MACD Visual
Description
MasterDoFOMO MACD Visual is a custom indicator that combines a unique approach to MACD with stochastic logic and simulated Renko-based direction signals. It is designed to help traders identify entry and exit opportunities based on market momentum and trend changes, with a clear and intuitive visualization.
How It Works
Stylized MACD with Stochastic: The indicator calculates the MACD using EMAs (exponential moving averages) normalized by stochastic logic. This is done by subtracting the lowest price (lowest low) from a defined period and dividing by the range between the highest and lowest price (highest high - lowest low). The result is a MACD that is more sensitive to market conditions, magnified by a factor of 10 for better visualization.
Signal Line: An EMA of the MACD is plotted as a signal line, allowing you to identify crossovers that indicate potential trend reversals or continuations.
Histogram: The difference between the MACD and the signal line is displayed as a histogram, with distinct colors (fuchsia for positive, purple for negative) to make momentum easier to read.
Simulated Renko Direction: Uses ATR (Average True Range) to calculate the size of Renko "bricks", generating signals of change in direction (bullish or bearish). These signals are displayed as arrows on the chart, helping to identify trend reversals.
Purpose
The indicator combines the sensitivity of the Stochastic MACD with the robustness of Renko signals to provide a versatile tool. It is ideal for traders looking to capture momentum-based market movements (using the MACD and histogram) while confirming trend changes with Renko signals. This combination reduces false signals and improves accuracy in volatile markets.
Settings
Stochastic Period (45): Sets the period for calculating the Stochastic range (highest high - lowest low).
Fast EMA Period (12): Period of the fast EMA used in the MACD.
Slow EMA Period (26): Period of the slow EMA used in the MACD.
Signal Line Period (9): Period of the EMA of the signal line.
Overbought/Oversold Levels (1.0/-1.0): Thresholds for identifying extreme conditions in the MACD.
ATR Period (14): Period for calculating the Renko brick size.
ATR Multiplier (1.0): Adjusts the Renko brick size.
Show Histogram: Enables/disables the histogram.
Show Renko Markers: Enables/disables the Renko direction arrows.
How to Use
MACD Crossovers: A MACD crossover above the signal line indicates potential bullishness, while below suggests bearishness.
Histogram: Fuchsia bars indicate bullish momentum; purple bars indicate bearish momentum.
Renko Arrows: Green arrows (upward triangle) signal a change to an uptrend; red arrows (downward triangle) signal a downtrend.
Overbought/Oversold Levels: Use the levels to identify potential reversals when the MACD reaches extreme values.
Notes
The chart should be set up with this indicator in isolation for better clarity.
Adjust the periods and ATR multiplier according to the asset and timeframe used.
Use the built-in alerts ("Renko Up Signal" and "Renko Down Signal") to set up notifications of direction changes.
This indicator is ideal for day traders and swing traders who want a visually clear and functional tool for trading based on momentum and trends.

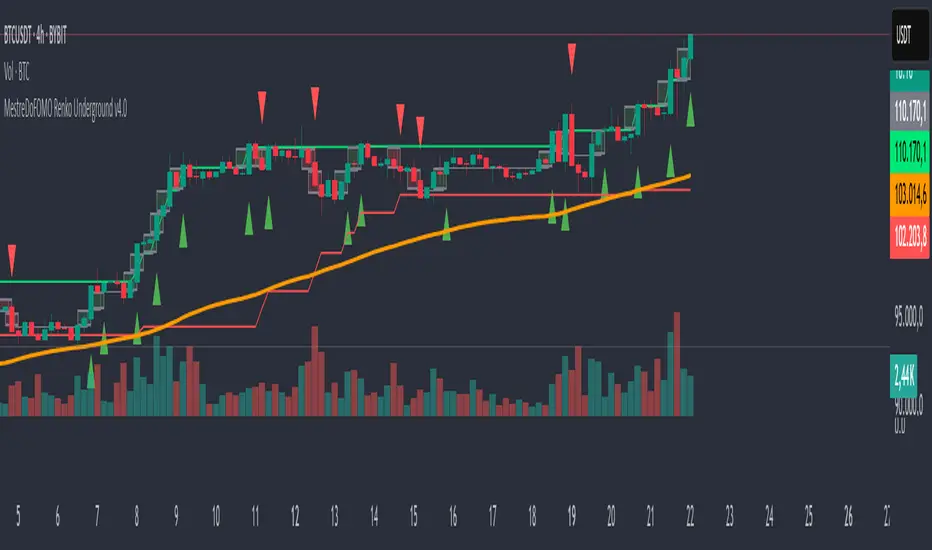
MestreDoFOMO Renko Underground v4.0Description:
The "MestreDoFOMO Renko Underground v4.0" is a custom indicator for TradingView that creates a dynamic Renko chart to help identify trends and reversal points in the market. Unlike traditional candlestick charts, Renko focuses solely on significant price movements, ignoring time and market noise. This script includes advanced features like support and resistance channels, moving averages, and alerts to assist with your trading decisions.
How It Works:
Dynamic Renko Bricks:
The brick size (price units to form each "box" on the chart) is calculated automatically using the ATR (Average True Range) with an adjustable multiplier. This means the size adapts to the asset's volatility (e.g., BTC/USDT). When the price moves up or down by the brick size, a new brick is created (green for up, red for down).
Reversal Signals:
Green triangles (🔼) appear below bars when the trend shifts to bullish, and red triangles (🔽) appear above when it shifts to bearish. These signals only appear on direction changes, reducing false signals.
Renko Channel:
The script draws two lines (green for resistance and red for support) based on the highs and lows of the last 10 bricks (or the value you set). This helps identify key price zones.
Moving Average on Bricks:
An orange line shows the moving average (EMA or SMA, your choice) of the last 20 bricks, helping confirm the overall trend.
Alerts:
You can set up alerts in TradingView to be notified when the trend shifts to bullish or bearish, perfect for active trading.
Visualization:
A gray dashed line shows the level of the last brick, providing a clear reference for the next expected move.
How to Use:
Add the indicator to your chart (e.g., BTC/USDT 1D).
Adjust parameters like the ATR multiplier, channel length, and moving average type in the settings menu.
Watch the bricks and signals to identify trends, and use the channels and moving average to plan entries and exits.
Enable alerts to receive real-time notifications.
Tip:
Test on different timeframes (1H, 4H, 1D) and adjust the ATR multiplier to match the volatility of the asset you're trading. Combine with other indicators (like RSI) for better results!
Non-Repainting Renko Emulation Strategy [PineIndicators]Introduction: The Repainting Problem in Renko Strategies
Renko charts are widely used in technical analysis for their ability to filter out market noise and emphasize price trends. Unlike traditional candlestick charts, which are based on fixed time intervals, Renko charts construct bricks only when price moves by a predefined amount. This makes them useful for trend identification while reducing small fluctuations.
However, Renko-based trading strategies often fail in live trading due to a fundamental issue: repainting .
Why Do Renko Strategies Repaint?
Most trading platforms, including TradingView, generate Renko charts retrospectively based on historical price data. This leads to the following issues:
Renko bricks can change or disappear when new data arrives.
Backtesting results do not reflect real market conditions. Strategies may appear highly profitable in backtests because historical data is recalculated with hindsight.
Live trading produces different results than backtesting. Traders cannot know in advance whether a new Renko brick will form until price moves far enough.
Objective of the Renko Emulator
This script simulates Renko behavior on a standard time-based chart without repainting. Instead of using TradingView’s built-in Renko charting, which recalculates past bricks, this approach ensures that once a Renko brick is formed, it remains unchanged .
Key benefits:
No past bricks are recalculated or removed.
Trading strategies can execute reliably without false signals.
Renko-based logic can be applied on a time-based chart.
How the Renko Emulator Works
1. Parameter Configuration & Initialization
The script defines key user inputs and variables:
brickSize : Defines the Renko brick size in price points, adjustable by the user.
renkoPrice : Stores the closing price of the last completed Renko brick.
prevRenkoPrice : Stores the price level of the previous Renko brick.
brickDir : Tracks the direction of Renko bricks (1 = up, -1 = down).
newBrick : A boolean flag that indicates whether a new Renko brick has been formed.
brickStart : Stores the bar index at which the current Renko brick started.
2. Identifying Renko Brick Formation Without Repainting
To ensure that the strategy does not repaint, Renko calculations are performed only on confirmed bars.
The script calculates the difference between the current price and the last Renko brick level.
If the absolute price difference meets or exceeds the brick size, a new Renko brick is formed.
The new Renko price level is updated based on the number of bricks that would fit within the price movement.
The direction (brickDir) is updated , and a flag ( newBrick ) is set to indicate that a new brick has been formed.
3. Visualizing Renko Bricks on a Time-Based Chart
Since TradingView does not support live Renko charts without repainting, the script uses graphical elements to draw Renko-style bricks on a standard chart.
Each time a new Renko brick forms, a colored rectangle (box) is drawn:
Green boxes → Represent bullish Renko bricks.
Red boxes → Represent bearish Renko bricks.
This allows traders to see Renko-like formations on a time-based chart, while ensuring that past bricks do not change.
Trading Strategy Implementation
Since the Renko emulator provides a stable price structure, it is possible to apply a consistent trading strategy that would otherwise fail on a traditional Renko chart.
1. Entry Conditions
A long trade is entered when:
The previous Renko brick was bearish .
The new Renko brick confirms an upward trend .
There is no existing long position .
A short trade is entered when:
The previous Renko brick was bullish .
The new Renko brick confirms a downward trend .
There is no existing short position .
2. Exit Conditions
Trades are closed when a trend reversal is detected:
Long trades are closed when a new bearish brick forms.
Short trades are closed when a new bullish brick forms.
Key Characteristics of This Approach
1. No Historical Recalculation
Once a Renko brick forms, it remains fixed and does not change.
Past price action does not shift based on future data.
2. Trading Strategies Operate Consistently
Since the Renko structure is stable, strategies can execute without unexpected changes in signals.
Live trading results align more closely with backtesting performance.
3. Allows Renko Analysis Without Switching Chart Types
Traders can apply Renko logic without leaving a standard time-based chart.
This enables integration with indicators that normally cannot be used on traditional Renko charts.
Considerations When Using This Strategy
Trade execution may be delayed compared to standard Renko charts. Since new bricks are only confirmed on closed bars, entries may occur slightly later.
Brick size selection is important. A smaller brickSize results in more frequent trades, while a larger brickSize reduces signals.
Conclusion
This Renko Emulation Strategy provides a method for using Renko-based trading strategies on a time-based chart without repainting. By ensuring that bricks do not change once formed, it allows traders to use stable Renko logic while avoiding the issues associated with traditional Renko charts.
This approach enables accurate backtesting and reliable live execution, making it suitable for trend-following and swing trading strategies that rely on Renko price action.

HKM - Renko Emulator with EMA TrendThis is a Renko based Emulator to plot on any chart type which prints the box as printed on a Renko charts and is a Non-Repaint version. You can use either Traditional or ATR Method on current chart Timeframe. Option to plot an EMA Line is provided with Trend indication.

pseudorenko█ CALCULATE PSEUDO-RENKO VALUE
Calculates and returns the Pseudo-Renko Stabilized value (or close price) based on a given input value, along with the direction of the current Renko brick. This function adapts the traditional Renko brick size dynamically based on the volatility of the input value using a combination of SMA and EMA calculations. The calculated price represents the closing price of the most recent Pseudo-Renko brick, while the direction indicates the trend ( 1 for uptrend, -1 for downtrend).
Parameters:
* `val` :
* Type: ` float `
* Description: The input value upon which the Pseudo-Renko calculations are performed. You can use any price series or custom value as input.
* `sensitivity` :
* Type: ` float `
* Default Value: ` 1.0 `
* Description: Controls the sensitivity of the brick size to the volatility of the `val`. Higher values lead to larger bricks, resulting in a smoother Renko chart. Lower values produce smaller bricks, leading to a more reactive chart.
* Possible Values: Any positive float.
* `length` :
* Type: ` int `
* Default Value: ` 7 `
* Description: The length used for calculating the EMA and SMA in the dynamic brick size calculation. It influences how quickly the brick size adapts to changing volatility of the `val`.
* Possible Values: Any positive integer.
Return Values:
* `lastRenkoClose` :
* Type: ` float `
* Description: The closing price of the last completed Pseudo-Renko brick based on the `val`.
* `renkoDirection` :
* Type: ` int `
* Description: The direction of the current Pseudo-Renko brick based on the `val`:
* ` 1 `: Uptrend
* ` -1 `: Downtrend
* ` 0 `: No change (initially, or no brick change since the previous bar)
Example Usage:
//@version=5
indicator("Pseudo-Renko Stabilized (Val)", overlay=true)
// Get user inputs
sensitivityInput = input.float(0.1, "Sensitivity",0.01,step=0.01)
lengthInput = input.int(5, "Length",2)
// Example usage with the 'close' price as the input value
= pseudo_renko(math.avg(close,open), sensitivityInput, lengthInput)
// Plot the Renko close price
plot(renkoClose, "Renko Close", renkoDirection>0?color.aqua:color.orange,2)
// You can also use other values as input, such as:
// = pseudo_renko(high, sensitivityInput, lengthInput)
// = pseudo_renko(low, sensitivityInput, lengthInput)
This example demonstrates how to use the `pseudo_renko` function within an indicator. It takes user inputs for `sensitivity` and `length`, then calculates the Pseudo-Renko values using the average of the `close` and `open` prices as the `val`. The resulting `renkoClose` price is plotted on the chart, with a color change based on the `renkoDirection`. It also illustrates how you can use other values, like `high` and `low`, as input to the function.
Note: The Pseudo-Renko algorithm is based on adapting the Renko brick size dynamically based on the input `val`. This provides more flexibility compared to the normal, but is experimental. The `sensitivity` and `length` parameters, along with the choice of the `val`, offer further customization to tune the algorithm's behavior to your preference and trading style.
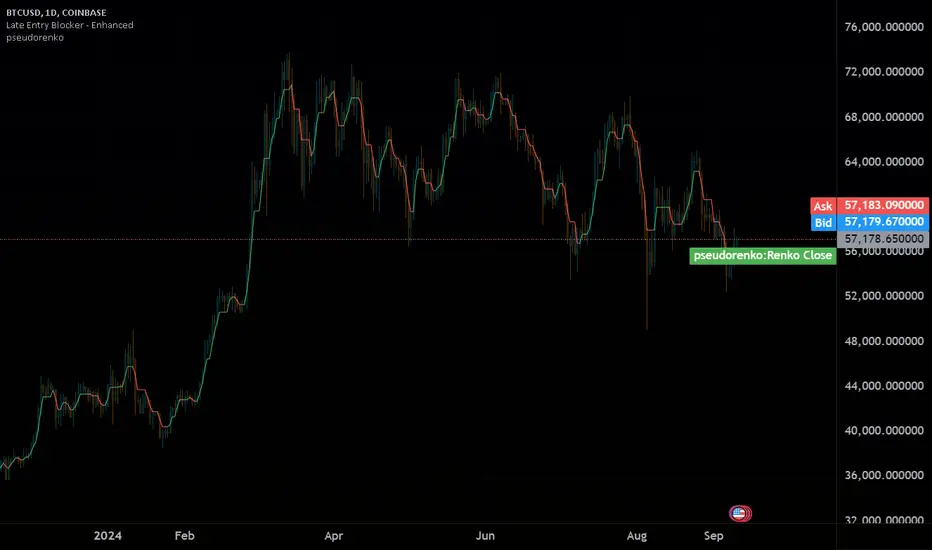
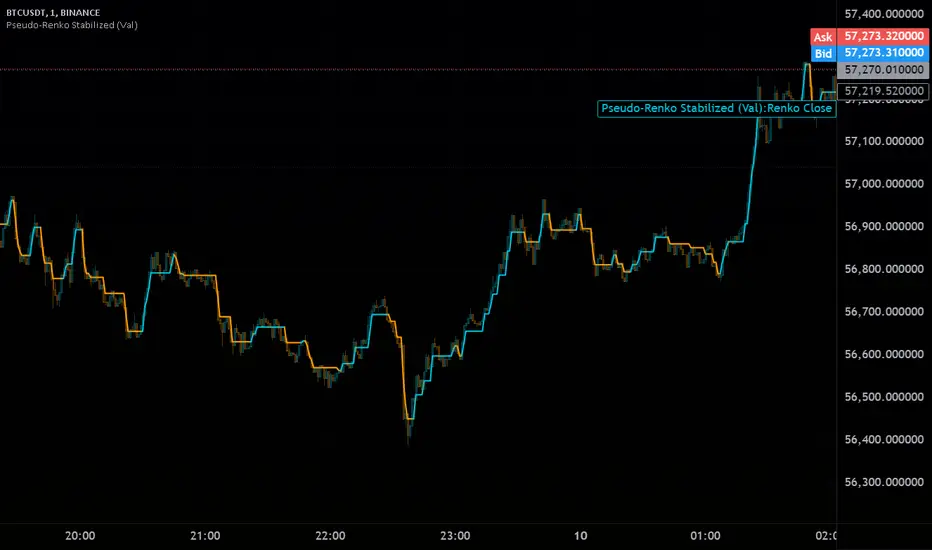
Pseudo-Renko Stabilized (Val)█ CALCULATE PSEUDO-RENKO VALUE
Calculates and returns the Pseudo-Renko Stabilized value (or close price) based on a given input value, along with the direction of the current Renko brick. This function adapts the traditional Renko brick size dynamically based on the volatility of the input value using a combination of SMA and EMA calculations. The calculated price represents the closing price of the most recent Pseudo-Renko brick, while the direction indicates the trend ( 1 for uptrend, -1 for downtrend).
Parameters:
* `val` :
* Type: ` float `
* Description: The input value upon which the Pseudo-Renko calculations are performed. You can use any price series or custom value as input.
* `sensitivity` :
* Type: ` float `
* Default Value: ` 1.0 `
* Description: Controls the sensitivity of the brick size to the volatility of the `val`. Higher values lead to larger bricks, resulting in a smoother Renko chart. Lower values produce smaller bricks, leading to a more reactive chart.
* Possible Values: Any positive float.
* `length` :
* Type: ` int `
* Default Value: ` 7 `
* Description: The length used for calculating the EMA and SMA in the dynamic brick size calculation. It influences how quickly the brick size adapts to changing volatility of the `val`.
* Possible Values: Any positive integer.
Return Values:
* `lastRenkoClose` :
* Type: ` float `
* Description: The closing price of the last completed Pseudo-Renko brick based on the `val`.
* `renkoDirection` :
* Type: ` int `
* Description: The direction of the current Pseudo-Renko brick based on the `val`:
* ` 1 `: Uptrend
* ` -1 `: Downtrend
* ` 0 `: No change (initially, or no brick change since the previous bar)
Example Usage:
//@version=5
indicator("Pseudo-Renko Stabilized (Val)", overlay=true)
// Get user inputs
sensitivityInput = input.float(0.1, "Sensitivity",0.01,step=0.01)
lengthInput = input.int(5, "Length",2)
// Example usage with the 'close' price as the input value
= pseudo_renko(math.avg(close,open), sensitivityInput, lengthInput)
// Plot the Renko close price
plot(renkoClose, "Renko Close", renkoDirection>0?color.aqua:color.orange,2)
// You can also use other values as input, such as:
// = pseudo_renko(high, sensitivityInput, lengthInput)
// = pseudo_renko(low, sensitivityInput, lengthInput)
This example demonstrates how to use the `pseudo_renko` function within an indicator. It takes user inputs for `sensitivity` and `length`, then calculates the Pseudo-Renko values using the average of the `close` and `open` prices as the `val`. The resulting `renkoClose` price is plotted on the chart, with a color change based on the `renkoDirection`. It also illustrates how you can use other values, like `high` and `low`, as input to the function.
Note: The Pseudo-Renko algorithm is based on adapting the Renko brick size dynamically based on the input `val`. This provides more flexibility compared to the normal, but is experimental. The `sensitivity` and `length` parameters, along with the choice of the `val`, offer further customization to tune the algorithm's behavior to your preference and trading style.
Renko Box Chart Overlay by BDThis is Renko chart overlay for Candles chart. You can use it to identify market direction and potential key points.
To use it simply select box size and any timeframe you want.
With this overlay you can be sure that you'll see every brick on a chart showing general market direction with all the details of a candles chart.
Alternatives Renko overlay charts:
If you don't have access to 1s timeframe or you don't want to use low TF here is the situation with built in Renko chart on 5m TF:
This Renko boxes are linked to chart by time(candle) and price. It will draw a box even if price didn't close above(or below) of box level:
But be careful when setting box size too small because it will produce bad results:
The issue is known and I'll work on fixing it in next update, for now use box size at least the size of a body of a candle, after all renko is for general market movement and not for marking up every tick.
Let me know if you want to see any additions.
[tradinghook] - Renko Trend Reversal Strategy V2Title: Renko Trend Reversal Strategy
Short Title: - Renko TRS
> Special thanks to for manually calculating `renkoClose` and `renkoOpen` values in order to remove the infamous repaint issue
Description:
The Renko Trend Reversal Strategy ( - Renko TRS) is a powerful and original trading approach designed to identify trend reversals in financial markets using Renko charts. Renko charts differ from traditional time-based charts, as they focus solely on price movements and ignore time, resulting in a clearer representation of market trends. This strategy leverages Renko charts in conjunction with the Average True Range (ATR) to capture trend reversals with high precision and effectiveness.
Key Concepts:
Renko Charts: Renko charts are unique chart types that only plot price movements beyond a predefined brick size, ignoring time and noise. By doing so, they provide a more straightforward depiction of market trends, eliminating insignificant price fluctuations and making it easier to spot trend reversals.
Average True Range (ATR): The strategy utilizes the ATR indicator, which measures market volatility and provides valuable insights into potential price movements. By setting the brick size of the Renko chart based on the ATR, the strategy adapts to changing market conditions, ensuring optimal performance across various instruments and timeframes.
How it Works:
The Renko Trend Reversal Strategy is designed to identify trend reversal points and generate buy or sell signals based on the following principles:
Renko Brick Generation: The strategy calculates the ATR over a user-defined period (ATR Length) and utilizes this value to determine the size of Renko bricks. Larger ATR values result in bigger bricks, capturing higher market volatility, while smaller ATR values create smaller bricks for calmer market conditions.
Buy and Sell Signals: The strategy generates buy signals when the Renko chart's open price crosses below the close price, indicating a potential bullish trend reversal. Conversely, sell signals are generated when the open price crosses above the close price, suggesting a bearish trend reversal. These signals help traders identify potential entry points to capitalize on market movements.
Stop Loss and Take Profit Management: To manage risk and protect profits, the strategy incorporates dynamic stop-loss and take-profit levels. The stop-loss level is calculated as a percentage of the Renko open price, ensuring a fixed risk amount for each trade. Similarly, the take-profit level is set as a percentage of the Renko open price to secure potential gains.
How to Use:
Inputs: Before using the strategy, traders can customize several parameters to suit their trading preferences. These inputs include the ATR Length, Stop Loss Percentage, Take Profit Percentage, Start Date, and End Date. Adjusting these settings allows users to optimize the strategy for different market conditions and risk tolerances.
Chart Setup: Apply the - Renko TRS script to your desired financial instrument and timeframe on TradingView. The Renko chart will dynamically adjust its brick size based on the ATR Length parameter.
Buy and Sell Signals: The strategy will generate green "Buy" labels below bullish reversal points and red "Sell" labels above bearish reversal points on the Renko chart. These labels indicate potential entry points for long and short trades, respectively.
Risk Management: The strategy automatically calculates stop-loss and take-profit levels based on the user-defined percentages. Traders can ensure proper risk management by using these levels to protect their capital and secure profits.
Backtesting and Optimization: Before implementing the strategy live, traders are encouraged to backtest it on historical data to assess its performance across various market conditions. Adjust the input parameters through optimization to find the most suitable settings for specific instruments and timeframes.
Conclusion:
The - Renko Trend Reversal Strategy is a unique and versatile tool for traders looking to identify trend reversals with greater accuracy. By combining Renko charts and the Average True Range (ATR) indicator, this strategy adapts to market dynamics and provides clear entry and exit signals. Traders can harness the power of Renko charts while effectively managing risk through stop-loss and take-profit levels. Before using the strategy in live trading, backtesting and optimization will help traders fine-tune the parameters for optimal performance. Start exploring trend reversals with the - Renko TRS and take your trading to the next level.
(Note: This description is for illustrative purposes only and does not constitute financial advice. Traders are advised to thoroughly test the strategy and exercise sound risk management practices when trading in real markets.)

[tradinghook] - Renko Trend Reversal Strategy - Renko Trend Reversal Strategy
Short Title: - Renko TRS
Description:
The Renko Trend Reversal Strategy ( - Renko TRS) is a powerful and original trading approach designed to identify trend reversals in financial markets using Renko charts. Renko charts differ from traditional time-based charts, as they focus solely on price movements and ignore time, resulting in a clearer representation of market trends. This strategy leverages Renko charts in conjunction with the Average True Range (ATR) to capture trend reversals with high precision and effectiveness.
Key Concepts:
Renko Charts: Renko charts are unique chart types that only plot price movements beyond a predefined brick size, ignoring time and noise. By doing so, they provide a more straightforward depiction of market trends, eliminating insignificant price fluctuations and making it easier to spot trend reversals.
Average True Range (ATR): The strategy utilizes the ATR indicator, which measures market volatility and provides valuable insights into potential price movements. By setting the brick size of the Renko chart based on the ATR, the strategy adapts to changing market conditions, ensuring optimal performance across various instruments and timeframes.
How it Works:
The Renko Trend Reversal Strategy is designed to identify trend reversal points and generate buy or sell signals based on the following principles:
Renko Brick Generation: The strategy calculates the ATR over a user-defined period (ATR Length) and utilizes this value to determine the size of Renko bricks. Larger ATR values result in bigger bricks, capturing higher market volatility, while smaller ATR values create smaller bricks for calmer market conditions.
Buy and Sell Signals: The strategy generates buy signals when the Renko chart's open price crosses below the close price, indicating a potential bullish trend reversal. Conversely, sell signals are generated when the open price crosses above the close price, suggesting a bearish trend reversal. These signals help traders identify potential entry points to capitalize on market movements.
Stop Loss and Take Profit Management: To manage risk and protect profits, the strategy incorporates dynamic stop-loss and take-profit levels. The stop-loss level is calculated as a percentage of the Renko open price, ensuring a fixed risk amount for each trade. Similarly, the take-profit level is set as a percentage of the Renko open price to secure potential gains.
How to Use:
Inputs: Before using the strategy, traders can customize several parameters to suit their trading preferences. These inputs include the ATR Length, Stop Loss Percentage, Take Profit Percentage, Start Date, and End Date. Adjusting these settings allows users to optimize the strategy for different market conditions and risk tolerances.
Chart Setup: Apply the - Renko TRS script to your desired financial instrument and timeframe on TradingView. The Renko chart will dynamically adjust its brick size based on the ATR Length parameter.
Buy and Sell Signals: The strategy will generate green "Buy" labels below bullish reversal points and red "Sell" labels above bearish reversal points on the Renko chart. These labels indicate potential entry points for long and short trades, respectively.
Risk Management: The strategy automatically calculates stop-loss and take-profit levels based on the user-defined percentages. Traders can ensure proper risk management by using these levels to protect their capital and secure profits.
Backtesting and Optimization: Before implementing the strategy live, traders are encouraged to backtest it on historical data to assess its performance across various market conditions. Adjust the input parameters through optimization to find the most suitable settings for specific instruments and timeframes.
Conclusion:
The - Renko Trend Reversal Strategy is a unique and versatile tool for traders looking to identify trend reversals with greater accuracy. By combining Renko charts and the Average True Range (ATR) indicator, this strategy adapts to market dynamics and provides clear entry and exit signals. Traders can harness the power of Renko charts while effectively managing risk through stop-loss and take-profit levels. Before using the strategy in live trading, backtesting and optimization will help traders fine-tune the parameters for optimal performance. Start exploring trend reversals with the - Renko TRS and take your trading to the next level.
(Note: This description is for illustrative purposes only and does not constitute financial advice. Traders are advised to thoroughly test the strategy and exercise sound risk management practices when trading in real markets.)

Customizable Moving Average RibbonThis indicator is a highly customizable moving average ribbon with some unique features.
This script can utilize multiple unique sources, including a non-repainting renko closing price. Renko charts focus solely on price movement and minimize the impacts of time and the extra noise time creates. Employing the renko close helps smooth out the MA ribbon. Insignificant price movements will not cause a change in the plotted lines of the indicator unless a new threshold is breached or a "brick" is created. This is highly useful for quickly identifying consolidation areas or overall flat price movement.
There are two methods for selecting the box size when utilizing the renko source. Box size is critical for the overall function and efficacy of the plots you will visually see with this indicator. Box size is set automatically using the Average True Range "ATR" or manually using the "Traditional" setting. The simplest way to determine a manual box size is to take the ATR of the given instrument and round it to the nearest decimal place. As an example, if the ATR for the asset is 0.18, you would round that number to 0.2 and utilize this as your traditional box size.
The MA ribbon contains eleven adjustable moving average lines. Users can choose to turn off as many as they would like. Users can also adjust the length of the individual moving averages and the source for all moving averages. There are nine types of moving averages to choose from for the ribbon. The MA options are:
Exponential Moving Average = 'EMA'
Double Exponential Moving Average= 'DEMA'
Triple Exponential Moving Average = 'TEMA'
Simple Moving Average = 'SMA'
Relative Moving Average = 'RMA'
Volume Weighted Moving Average = 'VWMA'
Weighted Moving Average = 'WMA'
Smoothed Simple Moving Average = 'SSMA'
Hull Moving Average = 'HULL'
We believe that the ribbons features, including the line color change, help quickly identify trends and give users optimum customization. Users can select from five different color schemes including:
Green/Red
Purple/White
White/Blue
Silver / Orange
Teal/ Orange

Renko Ichimoku CloudThis script utilizes its source from a non-repainting renko closing price. Renko charts focus solely on price movement and minimize the impacts of time and the extra noise time creates. Employing the renko close helps smooth out the Ichimoku Cloud. Insignificant price movements will not cause a change in the plotted lines of the indicator unless a new threshold is breached or a "brick" is created.
This Ichmoku Cloud includes all standard lines with standard lengths. These include:
Tenken Sen
Kiju Sen
Senkou A/B
Chikou Span
We have also included plotted marks for when there is a Tenken Sen/ Kiju Sen cross and for the Kumo cloud twist.
There are two methods for selecting the box size. Box size is critical for the overall function and efficacy of the plots you will visually see with this indicator. Box size is set automatically using the Average True Range "ATR" or manually using the "Traditional" setting. The simplest way to determine a manual box six is to take the ATR of the given instrument and round it to the nearest decimal place. As an example, if the ATR for the asset is 0.017, you would round that number to 0.02 and utilize this as your traditional box size.
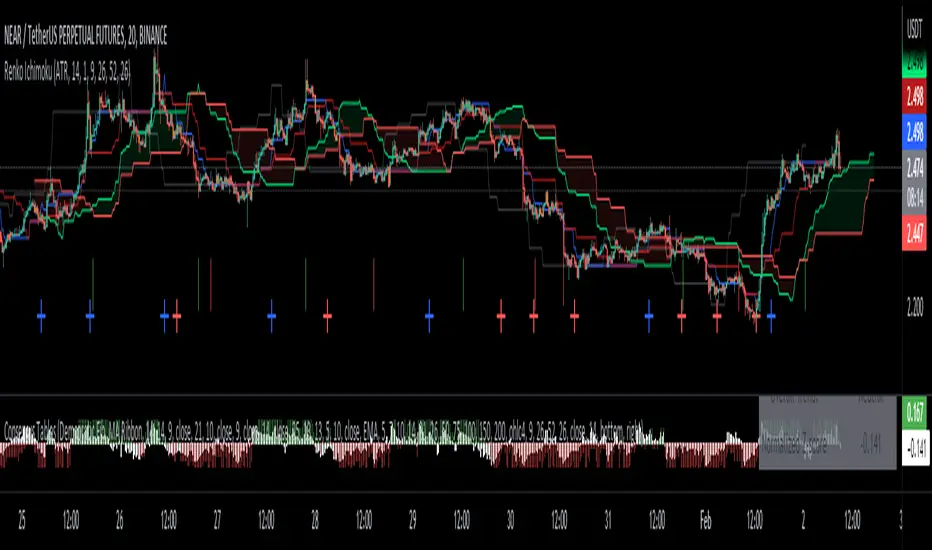
Renko Stop and GoSimilar to crossover systems, this indicator uses the renko calculation of the brick open position instead of the slow average in a crossover system, it also generates a signal marker on the crossover of the price and renko lines, both can be smoothed in the optional parameters.
update version to V5 for this script:

Numbers RenkoRenko with Volume and Time in the box was developed by David Weis (Authority on Wyckoff method) and his student.
I like this style (I don't know what it is officially called) because it brings out the potential of Wyckoff method and Renko, and looks beautiful.
I can't find this style Indicator anywhere, so I made something like it, then I named "Numbers Renko" (数字 練行足 in Japanese).
Caution : This indicator only works exactly in Renko Chart.
////////// Numbers Renko General Settings //////////
Volume Divisor : To make good looking Volume Number.
ex) You set 100. When Volume is 0.056, 0.05 x 100 = 5.6. 6 is plotted in the box (Decimal are round off).
Show Only Large Renko Volume : show only Renko Volume which is larger than Average Renko Volume (it is calculated by user selected moving average, option below).
Show Renko Time : "Only Large Renko Time" show only Renko Time which is larger than Average Renko Time (it is calculated by user selected moving average, option below).
EMA period for calculation : This is used to calculate Average Renko Time and Average Renko Volume (These are used to decide Numbers colors and Candles colors). Default is EMA, You can choice SMA.
////////// Numbers Renko Coloring //////////
The Numbers in the box are color coded by compared the current Renko Volume with the Average Renko Volume.
If the current Renko Volume is 2 times larger than the ARV, Color2 will be used. If the current Renko Volume is 1.5 times larger than the ARV, Color1.5 will be used. Color1 If the current Renko Volume is larger than the ARV . Color0.5 is larger than half Athe RV and Color0 is less than or equal to half the ARV. Color1, Color1.5 and Color2 are Large Value, so only these colored Numbers are showed when use "Show Only ~ " option.
Default is Renko Volume based Color coding, You can choice Renko Time based Color coding. Therefore you can use two type coloring at the same time. ex) The Numbers Colors are Renko Volume based. Candle body, border and wick Colors are Renko Time based.
////////// Weis Wave Volume //////////
Show Effort vs Result : Weis Wave Volume divided by Wave Length.
ex) If 100 Up WWV is accumulated between 30 Up Renko Box, 100 / 30 = 3.33... will be 3.3 (Second decimal will be rounded off).
No Result Ratio : If current "Effort vs Result" is "No Result Ratio" times larger than Average Effort vs Result, Square Mark will be show. AEvsR is calculated by 5SMA.
ex) You set 1.5. If Current EvsR is 20 and AEvsR is 10, 20 > 10 x 1.5 then Square Mark will be show.
If the left and right arrows are in the same direction, the right arrow is omitted.
Show Comparison Marks : Show left side arrow by compare current value to previous previous value and show right side small arrow by compare current value to previous value.
ex) Current Up WWV is 17 and Previous Up WWV (previous previous value) is 12, left side arrow is Up. Previous Dn WWV is 20, right side small arrow is Dn.
Large Volume Ratio : If current WWV is "Large Volume Ratio" times larger than Average WWV, Large WWV color is used.
Sample layout

Renko Candles OverlayHello All,
For long time I got many request for Renko Candles and now here it's, Renko Candles Overlay . I tried to make almost everything optional, so you can play with the options as you want.
Let see the options:
Method: the option for brick scaling method: ATR, ATR/2, ATR/4, Percent, Traditional
- ATR Period: period for Average True Range and it's valid if the method is ATR
- ATR/2 Period: period for Average True Range and it's valid if the method is ATR/2
- ATR/4 Period: period for Average True Range and it's valid if the method is ATR/4
- Traditional: User-defined brick size, it's valid if the method is Traditional
- Percent: Percent of Close price, it's valid if the method is Percent
if the method is not Traditional (fixed brick size) then Brick size is calculated/updated when new bricks added. so The box sizes may be different because of the calculation is dynamic.
Levels & Lines for new Bricks: if you enable this option then the script shows the levels for new brick
Change Bar Color: optionally the script changes the bar color by using direction of the bricks
and some other options for coloring.
The script shows the bricks for visible area, which is approximately 280 candles. so if you change the width and number of the bricks then number of bricks that is shown is adjusted automatically to fit the screen. you can see the examples below:
The script shows the levels to new brick as a line and label:
Because of real-time bar is not confirmed until the candle close, the script shows the bricks as Unconfirmed , and unconfirmed bricks shown in different color:
You can change the width of the bricks (width is 10 in following example):
Optionally candle colors are changde by the direction of the bricks:
If you have any recommendation then please drop a comment under the script ;)
Enjoy!

Last Available Bar InfoLibrary "Last_Available_Bar_Info"
getLastBarTimeStamp()
getAvailableBars()
This simple library is built with an aim of getting the last available bar information for the chart. This returns a constant value that doesn't change on bar change.
For backtesting with accurate results on non standard charts, it will be helpful. (Especially if you are using non standard charts like Renko Chart).
Methods
getLastBarTimeStamp()
: Returns Timestamp of the last available bar (Constant)
getAvailableBars()
:Returns Number of Available Bars on the chart (Constant)
Example
import paragjyoti2012/Last_Available_Bar_Info/v1 as LastBarInfo
last_bar_timestamp=LastBarInfo.getLastBarTimeStamp()
no_of_bars=LastBarInfo.getAvailableBars()
If you are using Renko Charts, for backtesting, it's necesary to filter out the historical bars that are not of this timeframe.
In Renko charts, once the available bars of the current timeframe (based on your Tradingview active plan) are exhausted,
previous bars are filled in with historical bars of higher timeframe. Which is detrimental for backtesting, and it leads to unrealistic results.
To get the actual number of bars available of that timeframe, you should use this security function to get the timestamp for the last (real) bar available.
tf=timeframe.period
real_available_bars = request.security(syminfo.ticker, tf , LastBarInfo.getAvailableBars() , lookahead = barmerge.lookahead_off)
last_available_bar_timestamp = request.security(syminfo.ticker, tf , LastBarInfo.getLastBarTimeStamp() , lookahead = barmerge.lookahead_off)
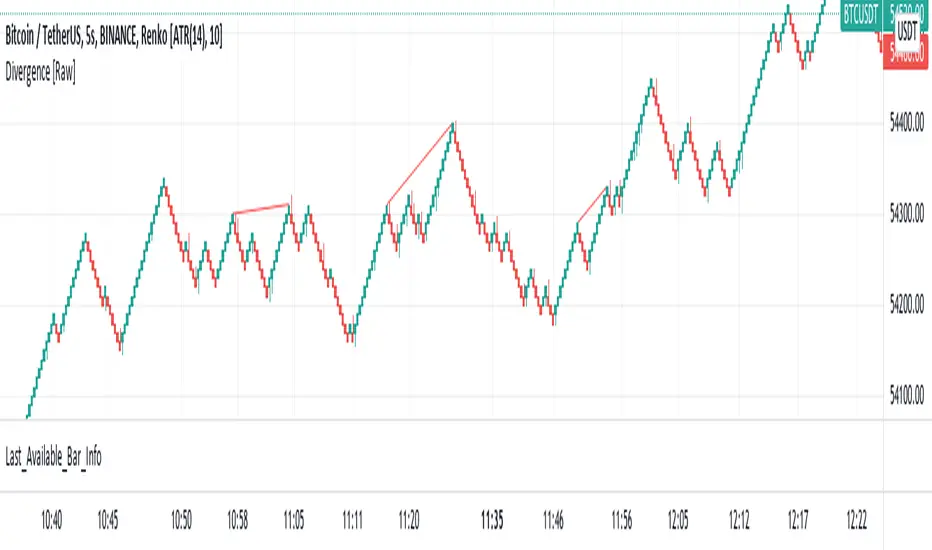
st_renkoThe indicator has two parameters: the period and the number of splits. For the selected period, the maximum and minimum are calculated, and the scope of the market is determined by the difference between the maximum and minimum. The scope is divided by the number of partitions, thereby determining the step of the levels. If the average price (ohlc4) falls within the range between levels, this range is drawn. A simpler analogy: we have a local minimum. and the local maximum for the selected period, we build a ladder between them, the number of steps of which is equal to the number of splits, and if the price is on some step of this ladder, then this step is drawn, so we can see how many steps separate us from the maximum and minimum.
