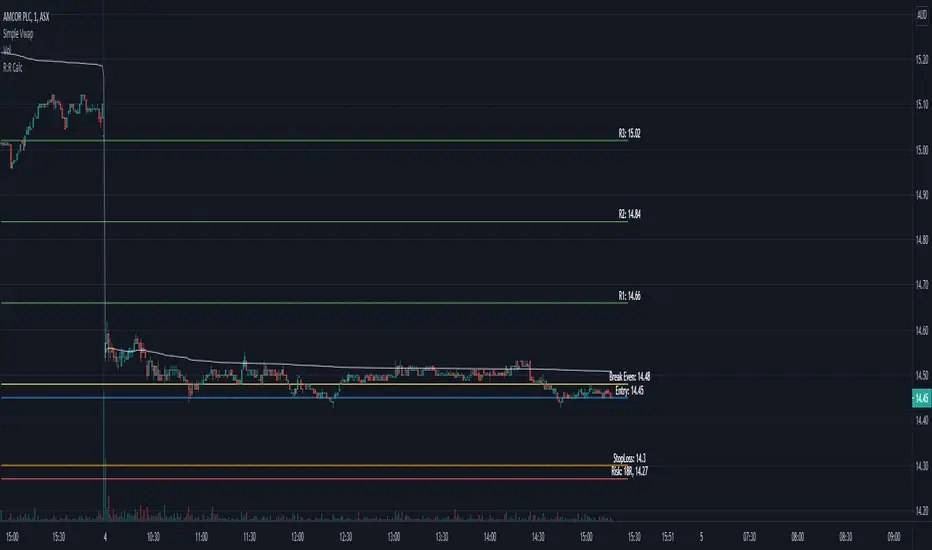
Risk & Reward Position PlannerDescription
This script is a trade architecture tool designed to help traders calculate position sizes and visualize risk-reward ratios dynamically on the chart. It focuses on functional precision and clean aesthetics, offering two distinct visual styles: "Cyber" for modern high-tech charts and "Classic" for a traditional look.
Key Features
Interactive Setup: Upon adding the script or resetting, it prompts you to click directly on the chart to set your Entry and Stop Loss levels.
Dynamic Position Sizing: Calculates the total risk in currency (USD) based on your custom unit size.
Multi-Target Planning: Visualizes four customizable Take Profit targets based on specific RR ratios.
Cyber UI Aesthetics: Full control over colors, neon glow effects, and horizontal alignment to fit any chart layout.
Comprehensive Data: Displays price, percentage distance, currency risk, and RR ratios at a single glance.
User Guide (How to use)
To ensure the most efficient workflow, here are the essential steps for operating the tool:
Setting a New Trade (Resetting)
If you change your symbol or want to plan a completely new trade, you can clear the current setup and trigger the interactive selection again:
Right-click on the indicator in the chart OR click the three dots (...) next to the indicator name in the legend.
Select "Reset Points".
The indicator will prompt you to click two new points on the chart: first for the Entry, then for the Stop Loss.
Moving Entry and Stop Loss
Move the mouse over the line of the Entry or the StopLoss and grab the grip of the line to move it up or down. Drop it to the price you want to set.
RR

Live Position Sizer (LPS)Description (EN)
(Magyar leíráshoz görgess lejjebb!)
Live Position Sizer (LPS) is a discretionary trading utility designed to visualize risk, reward, and position size directly on the chart in real time.
The indicator draws a TradingView-style long or short position box and calculates the required position size based on your defined capital, maximum risk, stop-loss distance, and a user-defined lot conversion factor.
LPS is intended strictly as a decision-support and risk management tool. It does not place trades or generate automated signals.
Core features:
Automatic Long / Short position visualization
Dynamic Entry, Stop Loss, and Take Profit levels
Real-time position size calculation
Configurable Risk/Reward ratio
Fully customizable colors, transparency, and line styles
Clean, minimal on-chart labels showing direction, RR, and lot size
Only one active position box at a time for a clutter-free chart
Position sizing logic:
TradingView internally calculates position size in units, not broker-specific lots.
To bridge this difference, LPS uses a user-defined “Units per 1 Lot” multiplier.
Examples:
Forex (standard lot): 100000
Gold (XAUUSD): 1 or 100 (broker dependent)
Indices (e.g. NAS100): 1
The indicator first calculates the position size in TradingView units and then converts it to lots using this multiplier.
The displayed lot size is rounded to 0.01 lots.
Stop Loss logic:
The Stop Loss level is derived from the High or Low of a selectable previous candle.
Increasing the bar-back value places the Stop Loss further away, which:
increases stop distance
reduces position size for the same risk
Intended use:
Manual / discretionary trading
Risk management and position sizing
Trade planning and visualization
Educational purposes
Important notes:
This indicator does not execute trades
No alerts or automation by default
Lot size and contract specifications vary by broker
Always verify the exact lot or contract size with your broker before trading
------------------------------------
Description (HU)
A Live Position Sizer (LPS) egy diszkrecionális kereskedést támogató segédindikátor, amely valós időben jeleníti meg a kockázatot, a célárat és a pozícióméretet közvetlenül a charton.
Az indikátor TradingView-stílusú long vagy short pozíció boxot rajzol, és kiszámolja a szükséges pozícióméretet a megadott tőke, maximális kockázat, stop-loss távolság és egy felhasználó által definiált LOT szorzó alapján.
Az LPS nem stratégia, kizárólag döntéstámogató és kockázatkezelési eszköz.
Fő funkciók:
Automatikus Long / Short pozíció megjelenítés
Entry, Stop Loss és Take Profit szintek vizuális ábrázolása
Valós idejű pozícióméret számítás
Állítható Risk/Reward arány
Teljesen testreszabható színek, átlátszóság és vonalstílus
Letisztult chart label (irány, RR, lot méret)
Egyszerre csak egy aktív pozíció box
Pozícióméretezési logika:
A TradingView belsőleg egységekben (units) számol, nem bróker-specifikus LOT-okban.
Ennek kezelésére az LPS egy „Units per 1 Lot” beállítást használ.
Példák:
Forex standard lot: 100000
Arany (XAUUSD): 1 vagy 100 (brókertől függ)
Indexek (pl. NAS100): 1
Az indikátor először TradingView egységekben számol, majd ezt átváltja LOT-ra a megadott szorzó segítségével.
A kijelzett LOT méret 0.01-re van kerekítve.
Stop Loss logika:
A Stop Loss szint a kiválasztott korábbi gyertya high vagy low értékéből kerül meghatározásra.
Nagyobb bar-back érték:
távolabb helyezi a stopot
azonos kockázat mellett kisebb pozícióméretet eredményez
Ajánlott felhasználás:
Manuális, diszkrecionális kereskedés
Kockázatkezelés és pozícióméretezés
Trade tervezés
Oktatási célok
Fontos megjegyzések:
Az indikátor nem köt automatikusan
Alapértelmezetten nincs alert vagy automatizmus
A LOT és contract méret brókerenként eltérhet
Kereskedés előtt mindig ellenőrizd a pontos LOT / contract specifikációt a brókerednél

Simple Risk-to-Reward (R) Indicator (TP1–TP2)What this indicator does:
This tool helps traders clearly visualize their risk and reward on any trade by plotting their entry, stop loss, and take-profit (TP) levels directly on the chart. It’s designed to make manual trade planning more visual and systematic.
How it works:
You set your planned entry price, whether you want to plot a Long or Short setup, and your stop-loss distance (in ticks).
The indicator calculates your stop-loss level and automatically plots it on the chart.
It then draws take-profit levels at 1R and 2R (where “R” is your risk, the distance between entry and stop).
You can toggle the TP1 and TP2 lines on or off to suit your preference.
How to use it:
Open the settings and enter your intended entry price.
Select “Long Setup” for a buy trade, or turn it off for a sell/short trade.
Enter your desired stop loss in ticks.
Choose which take-profit levels to display by toggling TP1 and TP2.
The indicator will show entry, stop, and take-profit levels right on your chart so you can easily see your planned risk/reward.
What makes it unique and useful:
This indicator is designed for manual trade planning, giving you full control over your inputs and letting you instantly see your risk/reward on any instrument or timeframe. Unlike some built-in tools, it supports both long and short trades, lets you set all levels manually, and keeps your charts clean and easy to interpret.

Max RR CalculatorAutomatically calculates the maximum RR reached during trade. Entry is at the candle close. There is an option available that takes another trade after getting stopped out on the next candle that is in same bias as first trade.
(If the first trade is a long and gets stopped out, then the second trade will wait until the next up candle to enter long again)

ATR-based TP/SL with Dynamic RREnglish
This indicator combines the power of the Average True Range (ATR) with dynamic calculations for Take Profit (TP) and Stop Loss (SL) levels, offering a clear visualization of trading opportunities and their respective Risk-Reward Ratios (RRR).
Features:
Dynamic TP/SL Calculation:
TP and SL levels are derived using user-defined ATR multipliers for precise positioning.
Multipliers are flexible, allowing traders to adjust according to their strategies.
Risk-Reward Ratio (RRR):
Automatically calculates and displays the RRR for each trade signal.
Helps traders quickly assess if a trade aligns with their risk management plan.
Entry Conditions:
Buy signals occur when the closing price crosses above the 20-period Simple Moving Average (SMA).
Sell signals occur when the closing price crosses below the 20-period SMA.
Visual Aids:
Red and green lines indicate Stop Loss and Take Profit levels.
Blue and orange labels show the RRR for long and short trades, respectively.
How It Works:
The indicator uses the ATR to calculate TP and SL levels:
TP: Adjusted based on the desired Risk-Reward Ratio (RR).
SL: Proportional to the ATR multiplier.
Entry signals are plotted with "BUY" or "SELL" markers, while the respective TP/SL levels are drawn as horizontal lines.
Why Use This Indicator?
Perfect for traders who value precise risk management.
Helps identify trades with favorable RRR (e.g., greater than 1.5 or 2.0).
Ideal for swing traders, day traders, and scalpers looking to automate their decision-making process.
Customization:
ATR Length: Control the sensitivity of ATR-based calculations.
ATR Multipliers: Set the TP and SL distances relative to the ATR.
Desired RRR: Define the risk/reward ratio you aim to achieve.
Important Notes:
The indicator does not place trades automatically; it is for visual and analytical purposes.
Always backtest and combine it with additional analysis for best results.
French
Cet indicateur combine la puissance de l’Average True Range (ATR) avec des calculs dynamiques pour les niveaux de Take Profit (TP) et de Stop Loss (SL), tout en offrant une visualisation claire des opportunités de trading et de leurs Ratios Risque/Rendement (RRR).
Fonctionnalités :
Calcul Dynamique des TP/SL :
Les niveaux de TP et SL sont calculés à l'aide de multiplicateurs ATR définis par l’utilisateur pour une position précise.
Les multiplicateurs sont personnalisables pour s'adapter à votre stratégie de trading.
Ratio Risque/Rendement (RRR) :
Calcule et affiche automatiquement le ratio RRR pour chaque signal de trade.
Permet aux traders d’évaluer rapidement si un trade correspond à leur plan de gestion des risques.
Conditions d'Entrée :
Les signaux d'achat apparaissent lorsque le prix de clôture traverse au-dessus de la moyenne mobile simple (SMA) à 20 périodes.
Les signaux de vente apparaissent lorsque le prix de clôture traverse en dessous de la SMA à 20 périodes.
Aides Visuelles :
Lignes rouges et vertes pour indiquer les niveaux de Stop Loss et de Take Profit.
Étiquettes bleues et orange pour afficher le RRR des trades longs et courts, respectivement.
Comment Cela Fonctionne :
L'indicateur utilise l’ATR pour calculer les niveaux TP et SL :
TP : Calculé dynamiquement en fonction du ratio risque/rendement souhaité (RRR).
SL : Proportionnel au multiplicateur ATR défini par l’utilisateur.
Les signaux d’entrée sont représentés par des étiquettes "BUY" ou "SELL", tandis que les niveaux de TP/SL sont tracés sous forme de lignes horizontales.
Pourquoi Utiliser Cet Indicateur ?
Idéal pour les traders soucieux d’une gestion rigoureuse des risques.
Identifie les opportunités de trades avec des RRR favorables (par exemple, supérieurs à 1.5 ou 2.0).
Convient aux swing traders, day traders et scalpeurs souhaitant automatiser leur processus de décision.
Personnalisation :
Longueur de l’ATR : Contrôlez la sensibilité des calculs basés sur l’ATR.
Multiplicateurs ATR : Ajustez les distances TP et SL par rapport à l’ATR.
Ratio RRR souhaité : Définissez le ratio risque/rendement que vous visez.
Remarques Importantes :
Cet indicateur n’exécute pas de trades automatiquement ; il est destiné à un usage visuel et analytique uniquement.
Toujours backtester et combiner avec une analyse supplémentaire pour de meilleurs résultats.
parametre par type de trading:
1. Pour les Scalpers :
Style de trading : Trades rapides sur de petites variations de prix, souvent sur des unités de temps courtes (1 min, 5 min).
Recommandations de paramètres :
ATR Length : 7 (plus court pour réagir rapidement à la volatilité).
Multiplicateur SL : 1.0 (Stop Loss proche pour limiter les pertes).
RR souhaité : 1.5 à 2.0 (bon équilibre entre risque et récompense).
Résultat attendu : Des trades fréquents, avec une probabilité raisonnable de toucher le TP tout en limitant les pertes.
2. Pour les Day Traders :
Style de trading : Trades qui durent plusieurs heures dans la journée, souvent sur des unités de temps moyennes (15 min, 1h).
Recommandations de paramètres :
ATR Length : 14 (standard pour capturer une volatilité modérée).
Multiplicateur SL : 1.5 (Stop Loss à distance raisonnable pour supporter les fluctuations intrajournalières).
RR souhaité : 2.0 à 3.0 (ciblez une bonne récompense par rapport au risque).
Résultat attendu : Moins de trades, mais un RR élevé pour compenser les pertes potentielles.
3. Pour les Swing Traders :
Style de trading : Trades qui durent plusieurs jours, souvent sur des unités de temps longues (4h, 1 jour).
Recommandations de paramètres :
ATR Length : 20 (pour capturer des mouvements de volatilité plus larges).
Multiplicateur SL : 2.0 (Stop Loss large pour supporter des fluctuations importantes).
RR souhaité : 3.0 ou plus (ciblez de gros mouvements de prix).
Résultat attendu : Des trades moins fréquents mais potentiellement très lucratifs.
4. Pour les Actifs Volatils (Crypto, Commodités) :
Problème spécifique : Les actifs volatils ont souvent des mouvements brusques.
Recommandations de paramètres :
ATR Length : 7 ou 10 (plus court pour suivre rapidement les variations).
Multiplicateur SL : 1.5 à 2.0 (assez large pour ne pas être déclenché prématurément).
RR souhaité : 1.5 à 2.0 (favorisez des récompenses réalistes sur des mouvements volatils).
Résultat attendu : Trades qui s’adaptent à la volatilité sans sortir trop tôt.
5. Pour les Marchés Stables (Indices, Actions Blue Chip) :
Problème spécifique : Les mouvements sont souvent lents et prévisibles.
Recommandations de paramètres :
ATR Length : 14 ou 20 (capture une volatilité modérée).
Multiplicateur SL : 1.0 à 1.5 (Stop Loss serré pour maximiser l’efficacité).
RR souhaité : 2.0 à 3.0 (ciblez des ratios plus élevés sur des mouvements moins fréquents).
Résultat attendu : Maximisation des profits sur des tendances claires.
Recommandation Générale :
Si vous ne savez pas par où commencer, utilisez ces paramètres par défaut :
ATR Length : 14
Multiplicateur SL : 1.5
RR souhaité : 2.0

Risk/Reward CalculatorJust a simple risk reward calculator to help indicate the R:R levels of your risk on a trade. The drawing tool doesn't have multiple R capabilities.