AnchorPulse RWAP Universal ScalperWhat it is
AnchorPulse Scalper is an intraday indicator that reads price in real time through three ideas working together.
A live pivot engine that detects the current micro leg.
An Anchored Range Weighted Average Price that starts at each new leg or session.
An adaptive rhythm score that communicates a simple bias: Buy, Sell, or Wait.
The goal is clarity. You get one anchor line, soft bands that show stretch, discrete Buy and Sell marks, and a plain-language dashboard that says Trend, Phase, Bias, Momentum, Volatility, Stretch, ETA to next turn, and Regime. No external dependencies and no lookahead. It is designed for standard chart types on one to five minute timeframes across liquid symbols such as major FX, index futures, large cap stocks, and mainstream crypto pairs.
What makes it original
Most scalpers either track a fixed moving average or draw from a session VWAP. AnchorPulse does neither. The anchor resets at every new micro leg detected by a real time pivot engine that measures distance in units of ATR rather than in fixed points. This produces a responsive anchor that updates only when the market proves a leg has turned. On top of that, the rhythm timer keeps an average of how long legs usually last, so the indicator can treat the start and the end of a leg differently. Early in a leg it favors continuation signals. Late in a leg it watches for mean reversion. This mix of an ATR-based leg detector, a leg-anchored RWAP, and a rhythm aware bias is the core originality.
Plain explanation of the calculations
Pivot engine. While price travels up, the script tracks the highest high reached since the last pivot. If price pulls back from that extreme by at least a user defined fraction of ATR, the leg flips down. The reverse applies to down legs. The distance threshold is adaptive because ATR changes with volatility. A short cooldown in bars can prevent double flips on violent bars.
Anchored Range Weighted Average Price. From the first bar of each new leg the script accumulates a weighted average of the typical price, where the weight is the true range of each bar. The anchor can also reset at the start of a session and can ignore the very first session bar to avoid overweighting the open gap.
Progress and phase. The script measures how far price traveled from the last pivot relative to the reversal threshold. That is progress. At the same time it maintains an exponential average of leg duration in bars. The current leg age divided by that average is the age ratio. An age ratio below an adaptive early threshold means Early. Above an adaptive late threshold means Late. The thresholds drift with recent variability in leg length so they match the rhythm of the market.
Wick pressure and intrabar skew. Lower wick minus upper wick, normalized by ATR and smoothed, acts as tape pressure. The sign of close minus open, smoothed, is intrabar skew. They are combined into a compact momentum read.
Bands and stretch. The script computes the deviation of typical price from the anchor and builds soft bands around the anchor. Standard deviation is capped by a multiple of mean absolute error to avoid inflated bands just after a pivot.
Regime filter. You may optionally gate continuation entries when the higher timeframe EMA disagrees, or gate reversals when ADX shows strong trend.
Adaptive edge score. Progress and momentum are turned into percentile scores using a normal CDF of their rolling z scores. This yields a familiar zero to one hundred scale that is easier to read than raw values. Early in an up leg adds a small bonus to long bias. Early in a down leg adds a small bonus to short bias.
Gap cap. Signals are rejected if price is too far from the anchor. The cap is expressed as a fraction of price, which scales across symbols.
What you see on the chart
One white anchor line. Two transparent bands. Subtle green or orange background when a bias is active. Buy marks below bars and Sell marks above bars. Small triangles at pivots. Bar tint softly aligned with momentum. A compact table in the corner that tells you the state in plain language. On alert, a single JSON line can be sent to your alert channel with ticker, timeframe, trend, phase, bias, edge score, stretch, ETA in bars, and regime note.
How to use it in practice
Choose a liquid symbol and a one to five minute timeframe.
Keep the mode on Hybrid until you learn the personality of the market. If you notice long directional pushes, try Continuation mode. If you see frequent fades near the end of legs, try Reversal mode.
Read the table. Trend shows Up or Down according to the current leg. Phase shows Early, Mid, or Late from the rhythm timer. Bias shows Buy, Sell, or Wait once the signal rules and the gap cap are satisfied. Momentum reads Strong Up, Neutral, or Strong Down from wick pressure and skew. Volatility shows Calm, Average, or Wild relative to an ATR baseline. Stretch vs anchor prints the distance between close and the anchor as a percent of price. ETA shows how many bars remain to the average leg length if such a read is meaningful. Regime reflects the optional gate: None, HTF Up, HTF Down, Strong, or Soft.
Focus on the anchor. Continuation longs are stronger when price holds above the anchor in the first part of an up leg with positive momentum and adequate progress. Continuation shorts are the mirror case below the anchor. Reversal longs are stronger when a down leg is late, price crosses the anchor, and momentum flips positive. Reversal shorts are the mirror case in late up legs.
Respect the gap cap. When price is stretched far away from the anchor, skip signals and wait for re-alignment or a fresh leg.
Keep the chart clean. The script is designed to work on its own. If you add other tools, make sure they do not paint multiple backgrounds or heavy drawings that obscure the anchor and the bands.
Inputs explained with practical defaults
The script ships with sensible defaults and all inputs provide tooltips inside the indicator. The description here is included so traders who do not read code can still understand how to tune it.
Signal mode. Continuation uses early leg logic. Reversal uses late leg logic at anchor crosses. Hybrid allows both and lets the edge score decide.
ATR length and Pivot reversal in ATR. These govern flips. Shorter ATR and smaller reversal multiples yield faster turns and more signals. Longer and larger do the opposite. A middle ground such as ATR 50 with reversal 0.75 often reads well across liquid markets.
Rhythm smoothing length and Freeze bars after flip. The first sets how quickly the average leg length adapts. The second prevents double flips on wide bars. Values around 20 and 1 to 3 bars work well for most symbols.
Session hours, Session reset, and Skip first session bar. These are optional. Day sessions in equities can benefit from a reset and from skipping the first bar so the anchor is not dragged by the open gap. Round the session to your venue.
Wick pressure length and Intrabar skew length. They control how quickly the micro momentum reacts. Values between 6 and 12 for wick pressure and 4 to 10 for skew are common.
Early and Late thresholds and the Adaptive option. If you turn adaptation on, the thresholds drift with leg variability. The adaptiveness setting controls the strength of that drift.
Minimum progress and Maximum stretch vs anchor. The first ensures that continuation signals only occur once the leg moved a minimum distance from the last pivot. The second prevents chasing far from the anchor. As a rule, raise minimum progress when the market chops and reduce it on trend days. Keep stretch around one to two percent for many symbols, then adjust by product.
Regime filter. Higher timeframe EMA supports trend alignment. ADX supports a simple read on the strength of trend. Use one at a time or none, depending on your preference.
Adaptive scoring lookback. The percentile logic needs a modest window. Values near one hundred twenty bars tend to give stable ranks without lagging too much.
Band settings. Band length and width control the look of the soft channel around the anchor. The cap versus mean absolute error is there to keep the bands realistic just after flips.
Visual controls. Pick labels, triangles, or circles, and choose to mark only state changes if you prefer a very clean chart.
Why the dashboard uses plain language
Many traders prefer to reason in simple terms rather than in raw values. The table abstracts the math into natural categories such as Early versus Late, Calm versus Wild, or Strong Up versus Strong Down. The only numeric reads are Stretch and Edge score because these help in threshold decisions. Stretch is a percent of price so it scales across markets. Edge is a normalized score from zero to one hundred that reflects the combined progress, momentum, and phase. The table is intended to be the only element you need to glance at during a fast session once you learn the anchor and the band cues.
Design choices and integrity
No repaint. The script uses bar closes and standard Pine semantics with lookahead off in security calls. There are no offset tricks that move plotted values after the fact.
One background painter. Background tint is created by a single call to avoid vertical stripes.
Reset logic is explicit. The anchor resets at a pivot or at session start if that option is enabled. This is written to be transparent so you know why the anchor restarted.
Conservative defaults. Out of the box, the script is not tuned to over trade. It communicates bias rather than forcing entries.
Clean chart guidance. The tool is meant to be used on standard bars or candles. It is not intended for synthetic chart types such as Heikin Ashi, Renko, Kagi, Point and Figure, or Range for the purpose of signal generation.
How to read a few common situations
Breakout with strong follow through. Trend reads Up. Phase reads Early. Momentum reads Strong Up. Stretch sits inside the band. Bias shows Buy. This is the typical continuation long.
Extended push into exhaustion. Trend reads Up. Phase reads Late. Momentum cools. Stretch prints a high positive percent of price. Bias flips to Wait, sometimes to Sell after an anchor cross. This is the potential reversal short.
Mean reverting chop. Trend flips often. Phase hangs around Mid. Momentum flips sign frequently. Stretch hovers near zero. Bias often prints Wait. In this case you let the market speak and only act when the leg matures or when stretch spikes away from the anchor.
Trend day with strength. ADX filter reads Strong. Continuation is allowed. Reversal attempts are blocked. Bias favors the dominant direction.
Session open. If you selected a session reset and chose to skip the first bar, the anchor starts at the second bar and the first prints do not dominate the anchor.
Limits and realistic expectations
This indicator measures leg structure and micro pressure to suggest a bias. It is not a self-contained trading system. It does not size positions, pick stops, or set take profits. It does not promise accuracy or profits. In violent markets the pivot detector can flip and then flip back. Cooldown reduces this effect but cannot remove it. During news and illiquid hours the anchor can move very quickly. Wide slippage and spread can make any intraday approach impractical. These are standard realities of intraday trading and they also apply here.
Suggested workflows
Discretionary scalper. Keep the chart clean. Use the table to decide whether to engage, then work entries at the anchor or inside the band. Focus on position risk and a predefined stop level independent of the script.
Session specialist. If you trade a venue with strong sessions such as US equities or major FX sessions, enable the session reset. Many traders find the tool shines in the first two hours and the last hour of an active session.
Multi timeframe monitor. Keep AnchorPulse on one to five minutes and a simple higher timeframe EMA on a separate chart. If you prefer a single chart, switch the regime filter to HTF Trend and let the indicator handle it.
Alert driven workflow. Create alerts on Buy or Sell. The payload contains the essential context so you can log and review. Use the payload fields to build a small notebook of cases you like to take.
Why it is published as protected
The script contains original logic that relies on a compact set of calculations not commonly seen together. Publishing as protected keeps the logic intact while still giving the community full access through the Public Library.
Frequently asked questions
Does it repaint
No. The pivot flips on confirmed bars using ATR distance. The anchor, bands, and dashboard read from that state and do not shift after the bar closes.
What settings should I change first
Try the reversal distance in ATR and the minimum progress. These two govern how active or selective the tool becomes. If you see too many flips, raise the ATR multiple or the freeze bars. If you want faster action, lower them slightly.
What is a reasonable stretch cap
One to two percent of price is a useful starting point for many symbols. Thin products may need a larger cap. Extremely liquid products can often work with a smaller cap.
Should I use the regime filter
On days with persistent trend, the higher timeframe EMA filter or the ADX filter can help keep you with the flow. On rotational days, consider turning the filter off to allow more two sided action.
Can I use it on higher timeframes
The logic works on any timeframe, but the design and defaults target one to five minutes. If you go higher, adjust the ATR length, reversal distance, and rank lookback accordingly.
Can I combine it with volume
Yes. A simple volume filter that marks above average volume near the anchor can help you time entries. Keep the chart readable.
Risk notice and user responsibility
This indicator is a tool for research and education. It does not give investment advice, trade recommendations, or any guarantee of outcomes. All trading carries risk including the loss of capital. Past performance is not a reliable guide to future results. You are solely responsible for your trading decisions, for verifying that the indicator behaves as you expect on your data and platform settings, and for selecting appropriate risk controls such as position sizing, stops, and loss limits.
Summary
AnchorPulse Scalper is a concise way to read the market’s current leg, its anchor, and its rhythm. The pivot engine tells you direction. The leg-anchored RWAP shows where value sits for this micro move. The adaptive score simplifies momentum and progress into a familiar scale. The dashboard translates complex calculations into the plain words that scalpers actually use. If you prefer simple signals, enable alerts and let them flow into your log. If you prefer context, watch the anchor and bands as the leg evolves and let the rhythm guide your timing. Use it respectfully on a clean chart, stay realistic, and keep your own rules for risk.
Scalpers

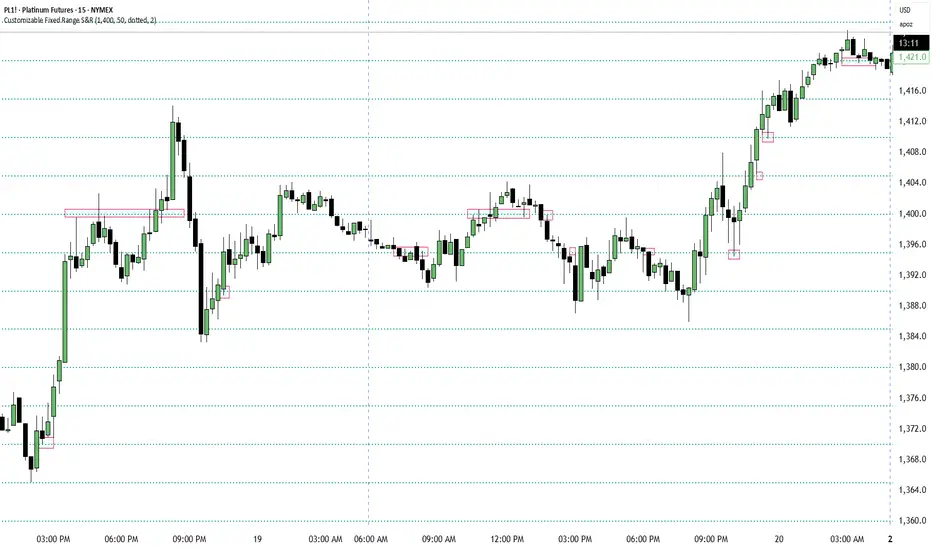
Customizable Fixed Range Support & ResistanceTraders often overlook the fixed range support and resistance, especially if they are round numbers. If you make some observations, you will see that buyers and sellers engage in numerous transactions at those levels. You can have a look at the screenshots presented here (find the red boxes!) or check it out for yourselves on the instrument's chart that you prefer. This indicator will be a big help for day traders and scalpers to set their entries, profit targets, and stop loss levels.
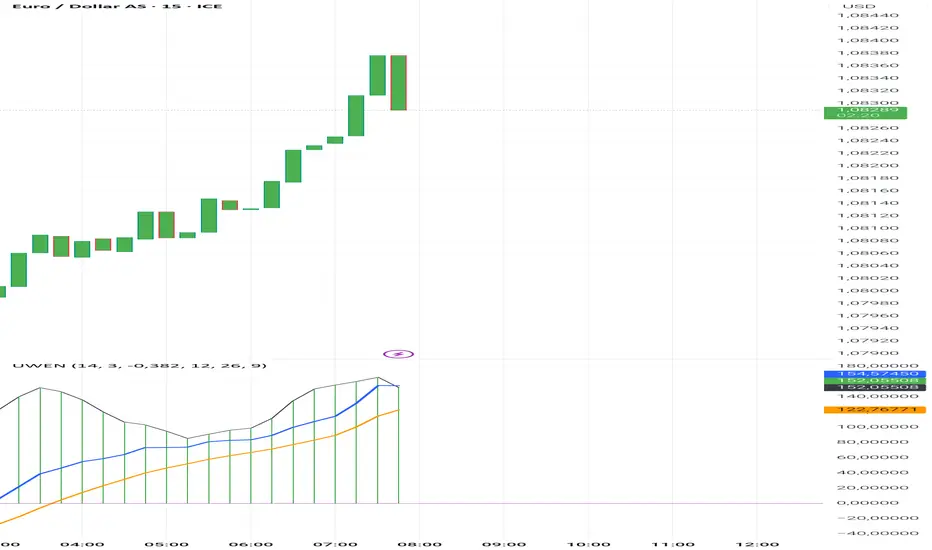
Uwen FX: UWEN StrategyThis Pine Script defines a trading indicator called "Uwen FX: UWEN Strategy" Where ideas coming from Arab Syaukani and modified by Fiki Hafana. It combines a CCI-based T3 Smoothed Indicator with a MACD overlay. Here's a breakdown of what it does:
Key Components of the Script:
1. CCI (Commodity Channel Index) with T3 Smoothing
Uses a T3 smoothing algorithm on the CCI to generate a smoother momentum signal. The smoothing formula is applied iteratively using weighted averages. The final result (xccir) is plotted as a histogram, colored green for bullish signals and red for bearish signals.
2. MACD (Moving Average Convergence Divergence)
The MACD is scaled to match the range of the smoothed CCI for better visualization. Signal Line and MACD Line are plotted if showMACD is enabled. The normalization ensures that MACD values align with the CCI-based indicator.
3. Bar Coloring for Trend Indication
Green bars indicate a positive trend (pos = 1).
Red bars indicate a negative trend (pos = -1).
Blue bars appear when the trend is neutral.
How It Can Be Used:
Buy Signal: When the xccir (smoothed CCI) turns green, indicating bullish momentum.
Sell Signal: When xccir turns red, indicating bearish momentum.
MACD Confirmation: Helps confirm the trend direction by aligning with xccir.
I will add more interesting features if this indicator seems profitable
Altcoins DCA ScalperIntroduction
The Altcoins DCA Scalper is a Pine Strategy Script designed to automate Altcoins trading through 3Commas integration. It implements a Dollar-Cost Averaging (DCA) strategy that expands upon 3Commas' standard DCA capabilities, helping to manage risk while trading both long and short positions automatically.
This tool aims to assist both beginners exploring automated trading and experienced 3Commas users seeking dynamic DCA automation. The script is specifically designed for the 1-minute timeframe , where it has shown a good balance between performance and risk management. Complete setup typically takes less than 10 minutes, with a detailed guide making configuration straightforward for users of all experience levels.
------------------------------
🔶 What is DCA?
------------------------------
Dollar-cost averaging (DCA) refers to the practice of gradually increasing your position size at lower prices when trading long, or at higher prices when trading short, to achieve a better average entry price if the market moves against the initial entry . Instead of investing all capital at once, which could result in a significant drawdown if the price moves unfavorably, DCA spreads entries across different price levels to help manage potential drawdowns as they occur.
In this script, DCA is implemented through a system that:
🔹 Triggers safety orders only when/if needed (if take profit isn't reached quickly)
🔹 Dynamically adjusts order sizing based on market volatility
🔹 Automatically reduces take profit targets after each DCA order to increase the likelihood of a positive outcome
🔹 Can handle drawdowns depending on market volatility and settings
The images below illustrate two scenarios: one where an entry reaches the take profit directly, without activating DCA orders, and another where DCA is utilized, with the order closing positively after two DCA orders.
Case 1: Order closes in profit after entry
Case 2: Order closes in profit after 2 DCA orders (dynamically placed based on trend and volatility)
This DCA implementation aims to enhance standard 3Commas DCA by adding market-adaptive features while maintaining risk management principles.
------------------------------
🔶 Could this strategy script benefit you?
------------------------------
This script may be helpful if you are:
✅ Looking to automate your trading through 3Commas integration while maintaining full control of your assets
✅ Wanting to enhance 3Commas' standard DCA with market-adaptive features that consider:
Multi-timeframe trend analysis
Real-time volatility assessment
Dynamic safety order sizing and timing
✅ Seeking to minimize chart monitoring through full automation of:
Entry and exit decisions
Safety order management
Risk controls
✅ Interested in comprehensive performance tracking with:
Real-time position metrics
Detailed backtesting capabilities
Risk/reward analysis
Backtesting Metrics (script performance over the backtesting period - which is approx. 15 days on the 1min timeframe with the TradingView Pro Plan):
Current/Open Deal Metrics (the deal is currently under DCA, and waiting for further actions to close):
✅ Looking for trading automation that remains easy to set up and use
Note: While this script provides trading automation, successful trading requires proper education, risk management, and regular performance monitoring. No automated tool can guarantee trading success or profits.
------------------------------
🔶 How it Works
------------------------------
The Altcoins DCA Scalper provides trading automation through:
Market Analysis
* Multi-timeframe trend analysis (1m to 1d) for market direction and entry validation
* Volatility assessment (1h, 4h, 24h) benchmarked against TOTAL3 (excluding Top10 Altcoins and Stablecoins)
* Real-time adjustment of DCA parameters based on:
* Current volatility class (low/medium/high) vs. overall Altcoins market
* Market trend strength
* Price action dynamics
Trading Execution
* Position opening aligned with detected market trends
* "Beast Mode" base order sizing that increases position size during strong trends
* Dynamic take-profit targets that automatically reduce after each safety order to increase the likelihood of positive exits
* Dynamic DCA with safety orders that can:
* Adapt timing based on volatility
* Scale order sizes based on market conditions
* Handle 30-50% drawdowns depending on volatility class
* Execute up to 6 safety orders per position
Risk Management
* Emergency exits during extreme market events:
* "Black Swan" protection for long positions
* "God-Candle" protection for short positions
* Configurable stop-loss with volatility-based placement
* Trend-switch management with automated position reversal
* Position aging controls to prevent capital lock-up
* Leveraged trading protection with a pre-liquidation exit system
Integration & Automation
* Quick setup with two 3Commas bots (typically under 10 minutes)
* Fully automated signal generation and execution through 3Commas
* Detailed performance tracking including:
* Real-time position metrics
* DCA depth analysis
* Win rate and ROE calculations
* Pre-configured settings optimized for most pairs
* Multiple customization options for experienced users
Note: While this strategy employs automation and risk management, trading always carries the risk of loss. No system can guarantee profits, and market conditions significantly impact performance. Always do your own research and monitor your positions closely.
------------------------------
How to Use
------------------------------
Setting up the Altcoins DCA Scalper is quick and facilitated by the User Interface:
1️⃣ 3Commas/TradingView Setup
* Create two 3Commas accounts if using the FREE plan:
* One account for Long Bot
* One account for Short Bot
* This split allows full functionality while staying within 3Commas' free tier limits
* You do not need two separate accounts if you have a Paid 3Commas subscription
* While a free TradingView account works with the script, it limits you to one trading pair and a 4-day backtesting history. A paid TradingView subscription removes these limitations (such as the "Essential" plan).
2️⃣ Bot Configuration
* Create one Long and one Short DCA Bot in 3Commas
* Follow the setup guide available in the script itself for hassle-free configuration
* Copy Bot IDs and Email Token for script connection
* No complex settings needed - the script manages all DCA parameters by itself
3️⃣ Script Implementation
* Apply the script to your TradingView charts
* Use the built-in backtesting to analyze performance on different pairs
* Focus on USDT.P futures pairs with good volatility
4️⃣ Trading Activation
* Create TradingView alerts for each trading pair you want to activate
* Example: Set an alert for BINANCE: XRPUSDT.P following the in-script guide
* The script automatically manages all aspects:
* Entry and exit decisions
* DCA execution
* Risk management
* Position monitoring
Capital Requirements
* Important: Ensure sufficient capital to cover all activated pairs
* Consider volatility class when allocating capital to specific pairs
Once setup is complete, the script operates fully automatically while you maintain complete control of your funds through 3Commas and your exchange.
Note: While the setup is straightforward, always start with a small number of pairs and monitor performance before expanding. Trade responsibly and never risk more than you can afford to lose.
------------------------------
Explaining the Settings
------------------------------
The Altcoins DCA Scalper offers mulitple customization options during the setup process. All settings include detailed tooltips and default values.
Core Settings Sections:
1️⃣ 3Commas Connection
* Bot IDs and Email Token configuration
* Leverage settings (1x to 5x supported)
* Detailed 3Commas bot setup guide included
* Automatic bot control configuration
2️⃣ Trading Parameters
* Capital allocation per trade
* Timeframe verification
* Alert system setup
* Backtesting period control
* Performance tracking preferences
3️⃣ Advanced Features
🔹 Risk Management Suite
* Emergency exit controls (to strengthen protection against extraordinary market events)
* Customizable stop-loss system
* Trend-based exit management
* Position aging controls
* Liquidation protection features
* Advanced DCA controls
🔹 Performance Analytics
* Real-time position monitoring
* Comprehensive backtesting metrics
* DCA depth analysis
* Win rate calculations
* Capital efficiency tracking
🔹 Technical Optimizations
* Exchange minimum order adjustment
* Trading pair name override capability
* System stability controls
* Error handling mechanisms
🔹 Interface Customization
* Theme selection
* Chart overlay options
* Warning display preferences
* Performance metrics visibility
All settings come pre-configured but can be fully customized based on your trading preferences and risk tolerance. The script includes tooltips and setup guides for each option.
Note: While default settings may be tested, market conditions vary and all trading involves risk. Monitor performance and adjust settings according to your risk management requirements.
------------------------------
Frequently Asked Questions
------------------------------
Here are some common questions you may have, and our answers:
❓ Is this tool only for experts? I'm new to algo trading, can I use it?
No, the Altcoins DCA Scalper could be used by both beginners and experienced traders. The setup process is guided, and the algorithm handles all the calculations in the background.
❓ I'm not familiar with 3Commas. Is that a problem?
While the script is designed to work with 3Commas, a step-by-step guide is provided within the script to help you set up your 3Commas accounts and bots, if needed.
❓ Do I need to constantly monitor the script after it's set up?
No, after the initial setup and configuration, the script operates autonomously. It handles all aspects of trading including entries, exits, DCA management, and risk controls. However, we recommend:
* Checking performance metrics daily
* Reviewing position statistics weekly
* Adjusting pair selection monthly based on performance
* Monitoring overall market conditions that might require adjustments
❓ Can I use it with leverage?
Yes, the script is designed to work with leverage up to 5x on perpetual futures pairs (USDT.P). It includes specific features for leveraged trading:
* Dynamic safety order placement based on distance to liquidation
* Pre-liquidation exit system to minimize exchange fees
* Adjustable take-profit targets optimized for leveraged positions
* Emergency exit system for extreme market movements
* Optional risk controls specific to leverage:
* Automatic exit in the liquidation danger zone
* Position size scaling based on leverage level
* Safety order adjustments for different leverage settings
While leverage can amplify returns, it also increases risk. We recommend starting with lower leverage (2x), or no leverage at all, until familiar with the script's operation.
❓ Does this script guarantee profits?
No, no script or trading strategy can guarantee profits. The Altcoins DCA Scalper provides a framework for implementing an automated DCA strategy, but your success will depend on many different factors and conditions.
❓ Do I need to understand the complex algorithms used in the script?
No, it’s not necessary. The logic is handled by the script, and you do not need to understand every detail to use it effectively. However, a basic knowledge of DCA concepts will be beneficial.
❓ Can I use this script with spot or leveraged trades?
The script is optimized for USDT.P pairs (perpetual futures) with leverage up to 5x. This allows:
* Automatic long/short position management
* Increased capital utilization
* Full DCA functionality without holding the underlying assets
* Enhanced risk management features specific to futures
While spot trading is possible, it requires holding underlying assets for shorts and doesn't access the script's full capabilities.
❓What timeframe should I use?
This script is optimized for the 1-minute timeframe , which is the recommended setting for the best balance between performance, capital efficiency, and risk. While we recommend using the tool on the 1 minute TF, it would work on other timeframes too.
❓ What happens if my internet/computer goes down?
Since the script sends signals from Tradingview to 3Commas (which executes trades on your exchange), your positions and DCA management continue to function even if your TradingView chart is closed or your computer is off. The script only needs to be active to generate new signals.
❓ How are the DCA parameters determined?
The script dynamically adjusts DCA parameters based on:
* The pair's volatility class (compared to the overall altcoin market)
* Current market conditions and volatility
* Position direction (long/short)
* Leverage settings
* Number of safety orders already executed
This allows for adaptive/dynamic DCA compared to static or %-based parameters.
❓ What exchanges are supported?
The script works with any exchange supported by 3Commas for futures trading (approximately 15 different crypto Exchanges). However, it's optimized for Binance Futures (USDT.P pairs) due to its high liquidity and for consistency.
❓ What happens during extreme market conditions?
The script includes some (optional) protective measures that can be activated:
* Emergency exits during sharp and abnormal market moves
* Automatic adjustment of DCA parameters during high volatility
* Position closure on significant trend changes
* Special handling of aged positions
These features aim to protect capital during unusual market conditions.
❓How many pairs can I trade simultaneously?
This depends on your total capital. As a general indication, define the number of pairs to activate based on:
* Total available capital
* Desired position size per pair
* Risk tolerance
* Pairs' volatility class
------------------------------
Final Thoughts
------------------------------
We believe that your trading performance will greatly depend on your selection of appropriate trading pairs for this script (high volatility), and your commitment to regularly monitoring its performance and adjust the settings, rather than on the script alone.
------------------------------
⚠️ Risk Disclaimer
------------------------------
Remember that trading involves risk, and most day traders experience losses. This script is for educational and informational purposes only. Past performance does not guarantee future results. This is not financial advice, and you should always do your own research (DYOR). Trade responsibly with capital you can afford to lose.
The Altcoins DCA Scalper is an independent tool and is not endorsed, connected, or validated by TradingView.
3Commas is a third-party service, and TradingView is not responsible for the 3Commas integration or the performance of 3Commas bots. You are solely responsible for the security and management of your 3Commas account. Do not share your 3Commas access credentials (like login information, Bots-ID, Email Token) with anyone. The Author of the script has no access to such information, and nobody (but you) should.

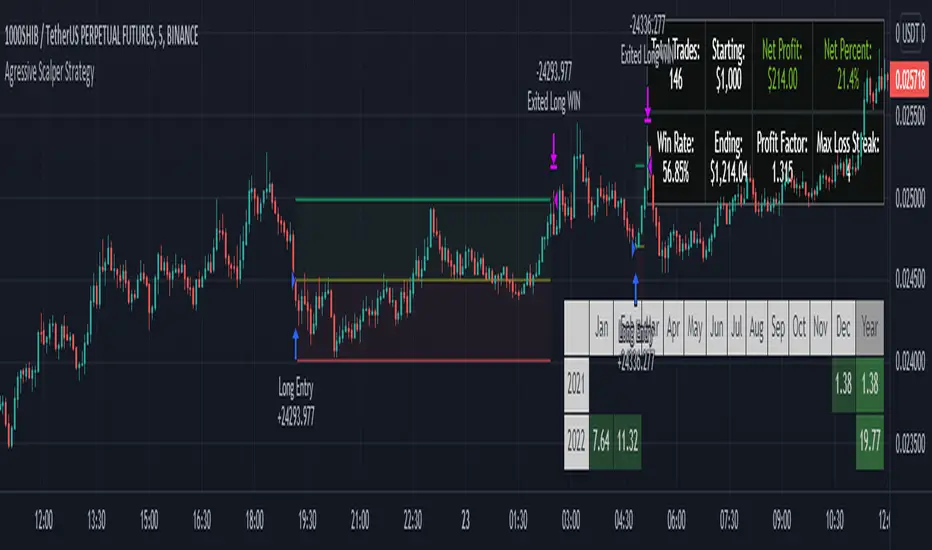
Agressive Scalper StrategyAfter many different tests and tries we found a strategy which is suited for people that likes to trade in shorter time frames. It uses multiple indications for entries. Entries include indications like Double ATR, Consolidation Detection, Dynamic RSI Calculation with Overbought and Oversold lines and also previous bars highs and lows. Although this strategy has been coded and tested on short time frames, after many additions it turns out it can be very profitable in every time frame if you play with the settings. Also it has some helpers for people that likes to optimize and see how their choices affects the outcome.
The strategy calculates the entry with the rules below:
LONG ENTRY RULES
- Price must be in consolidation zone
- Fast ATR Must be higher than Slow ATR
- Dynamic RSI must be below the oversold line (Green Line as Default)
- The Signal lookback must allow entry. (For example if you set signal lookback to 5, if the LOW of current price is LOWEST point of last 5 bars it is okay to enter LONG) If you check the lookback helper it will show you as green arrow at the bottom.
SHORT ENTRY RULES
- Price must be in consolidation zone
- Fast ATR Must be higher than Slow ATR
- Dynamic RSI must be above the overbought line (Red Line as Default)
- The Signal lookback must allow entry. (For example if you set signal lookback to 5, if the HIGHEST of current price is HIGHEST point of last 5 bars it is okay to enter SHORT) If you check the lookback helper it will show you as red arrow at the top.
This strategy has additional settings that are not available in indicator version that is previously released so i suggest everyone to use this instead.
Happy trading everyone!
YSG Scalper V2Ysg Scalper
A powerful scalping indicator that generates multiple buy and sell signals with a good amount of accuracy
How does it work?
As we all know the markets/scripts are not always in trending, many times it moves in a tight range, ysg scalping indicator helps you in identifying the trading opportunities by giving you trading zones and non-trading zones by paining the candles in three different colors Red, Yellow, and Green. When the candles are red it means the script is in the selling zone and when the candles are green the script is in the buying zone, when the candles in yellow it means the script is in no trading zone.
How to trade?
Trading with ysg scalper is very easy as it gives two zones called the trading zone and non-trading zone. If the candles are green or red the script is in trading zone and if the candles are yellow the script is in the non-trading zone.
Buy: when the candles change color to green wait for the first arrow and enter the trade after closing of the candle.
Sell: when the candles change color to red wait for the first arrow and enter the trade after closing of the candle.
What markets does it work best?
Works on indices, forex, and high beta stocks.
What's the best time frame to use?
3mins or 5mins (for forex and commodities)
How to get access?
Please click on the link in the signature or send me a private message to get access.

Scalper Pro Pivot - Scalpers WeaponToday I feel good to share with my all pals a new "Pivot Point" indicator which I never thought that it could be that easily done. I have been trading for years but I am, to be honest, new to pine script. I used to code other programming languages in the past like HTML, CSS, javascript, PHP, etc web-based programming language which luckily helped me to understand pinescript. It was a bit of my history about coding now talking to the main reason why I created this script in the first place? The answer is simple "I mean who the hell don't want to make their own indicators which work to accomplish own goals". There are lots of indicators which I saw in the public library as well as inside build in but, to be honest, I didn't found any pivot point indicator which calculates the "Fibonacci" method. Even if there are hundreds of pivot point indicators out there in public and built-in but they were either in higher timeframe (daily or above resolution) and weren't on a lower timeframe like starting from 1-minute resolution. There are some lower timeframe pivot point indicators but they aren't using the same method of calculation which I wished and if I ever figure out one then they just end up being repaints which didn't work properly as I wanted. The last but not least reason to create this indicator was obviously for all those short term traders (Scalpers) which I believe this indicator will be a game-changer by adding more support on their current trading strategies. It is so flexible that we can change the resolution from 1min to 1month and, to be honest with you all Fibonacci method used pivot points works most of the time with my own years of personal experience using them in higher timeframes and that is mainly one reason why I was eager to make one which can be used in lower timeframes. It will be useful for all types of traders (short-mid-long). The indicator was specially created for my own scalping purposes and indeed at the end, the creation of this indicator became like if I was mean to dedicate this to my fellow scalper's out there who value the pivot point! Lastly, I would like to give credit to pine script who gave support and knowledge for pine script as well as 'LonesomeTheBlue ' my friend who fixed some issue within the code and without him, my imagination wouldn't have been a reality. Inbox me if you are interested in it. Cheers!

Scalp Master V 1.0The Scalp Master is designed for new and experienced trainers to get a better understanding of sudden direction changes in the cryptocurrencies markets, by displaying just 2 basic signals: "Up" or "Down".
It combines the T.A of a group of indicators to give you the most sensitive tool to catch a Pump or Dump before it happens. It also includes one of the most basic and powerful tools to understand how the market is going to behave: Bollinger Bands, if we get an "Up" signal near the lower Bollinger band, we might be close to a good pump and if we get a "Down" signal near the top Bollinger band a dump in the price will most likely happen.
Enjoy!!!

Market Cycle & Scalping entry / exitCycle indicator is an oscillator commonly used to identify market trends and provide buy and sell signals to traders. The Cyle indicator is based on the assumption that currency trends accelerate and decelerate in cyclical patterns that may reflect the dominant price cycle of any stock, during any time frame. It works best on a 1 min chart for quick scalp plays.

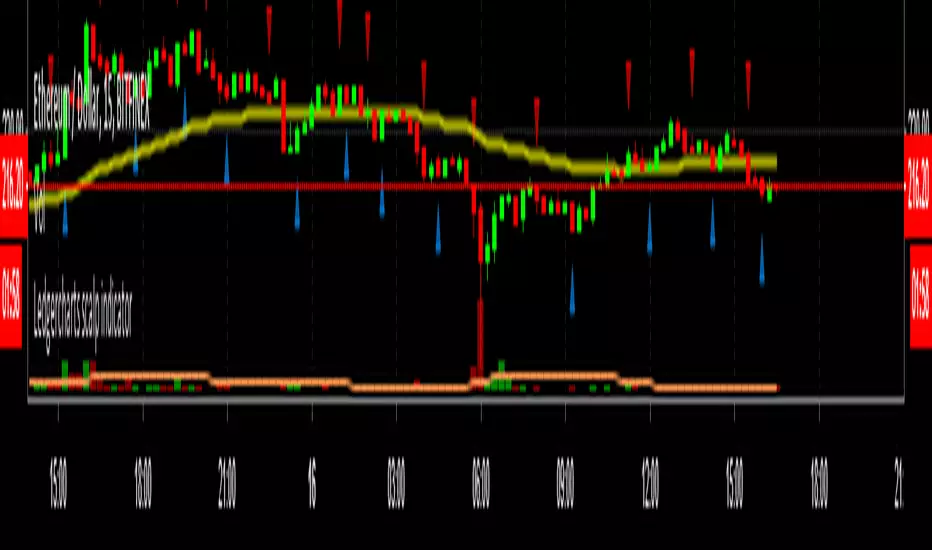
Ledgercharts scalp indicatorI'm using this indicator for finding scalp opportunities with high volume crypto coins. To be used in combination with support & resistance levels and/or other indicators.
Works best on a 15-minute timeframe.
DISCLAIMER:
This script is not intended as financial advice and is for educational purposes only. Do your own research by verifying the accuracy of the information and know that your decisions are your own.

John Carter's Buy/Sell Scalper V2After a couple adjustments, double signals are now being ignore.
Here's how this script works:
Based entirely on a John Carter scalping setup, a candle will be painted purple if the next two closes are in a opposite direction of the past trend.
Green triangles indicates that the reversal is bullish, red triangles indicates that the reversal is bearish. Both are entry/exit points if you want to follow this set up.
Personally, I find this setup to work best in trending days, but it does a great job on choppy days if you use it as a confirmation.
John Carter's Buy/Sell Scalper (with alert)Basic indicator with signals. Con: Presents multiple signals in the same direction (should be ignored, according with the strategy).
