BB + RSI double strategy developeI'm Korean, and it may not be enough to explain this script in English. I feel sorry for the users of TradingView for this lack of English skills. If you are Korean, please return it to the translator using Papago. It will be a useful manual for you.
This script referenced Chartart's Double Strategy. But there are some changes in his script.
0. Basically, when you break through the top or bottom of the 100th period balliser band and come back into the band, you track the overbuying and overselling of the RSI to determine your position entry. The order is triggered only when both conditions are satisfied at the same time. However, only one condition applies to clearing the position. This is because it is most effective in reducing risk and increasing assets in terms of profit and loss.
1. This script is optimized for 15 minutes of bitcoin futures chart and API via webbook alert. By default, 10x leverage usage and 10 pyramids are applied.
2. Setting a chart period other than 15 minutes will not guarantee sufficient effectiveness. It can also be applied to Ethereum , but it is not recommended to apply to other symbols.
3. I added Enable Date Filter because Chartart's script could not apply the strategy to the user's desired period. This feature allows you to set a period of time when you do not want to use the strategy. You can also uncheck it if you don't want to fully use this feature. Please remember that it is an exclusion period, not a usage period. With this feature, we can see the effectiveness of the strategy from a point in time, not from the entire period. You can also clearly differentiate the effectiveness of the strategy from the point you use it.
4. You can also stop using strategies at certain times of the day when you don't want to apply them. This works similarly to the Enalbe Date Filter described above. This allows you to sleep comfortably even if you don't fully trust this strategy.
5. The period, overbuying, and overselling figures of RSI can be set individually. For example, when you take a long position, you can set the RSI to a period of 7, and at the same time, the RSI entering the short position can be set to a period of 14. You can also set the base figures for overbuying and overselling to levels that you think are reasonable. This figure works in conjunction with the Bollinger Band and affects position entry when it is crossed or returned.
6. Based on API futures trading, basic Sleepy and commission are applied. This is geared towards market price transactions. This makes your revenue look more reasonable.
Thank you very much, Chartart. You are a genius.
-
저는 한국인이고, 영어로 이 스크립트를 설명하는 것이 어렵기 때문에 설명이 부족할 수 있습니다. 이런 영어 능력 부족에 대해서 TradingView 사용자들에게 미안하게 생각합니다. 만약 당신이 한국인이라면 파파고를 사용하여 번역기에 돌려주십시오. 당신에게 유익한 설명서가 될 것입니다.
이 스크립트는 Chart art의 Double Strategy를 참조했습니다. 그러나 그의 스크립트에서 달라진 점이 몇 가지 있습니다.
0. 기본적으로 100기간의 볼린져밴드의 상단 또는 하단을 돌파한 뒤 다시 밴드 안으로 들어올 때 RSI의 과매수, 과매도를 추적하여 포지션 진입을 결정합니다. 두 가지 조건이 동시에 만족되어야만 주문이 트리거 됩니다. 그러나 포지션을 청산하는 것에는 볼린져밴드 하나의 조건만 적용합니다. 여러가지 테스트를 거친 결과 이것이 손익 면에서 가장 효과적으로 리스크를 줄이고 자산을 늘리는 것에 효율적이기 때문입니다.
1. 이 스크립트는 15분의 비트코인 선물 차트와 webhook alert을 통한 API에 최적화되어 있습니다. 기본적으로 10배의 레버리지 사용과 10개의 피라미딩이 적용되어 있습니다.
2. 15분 외에 다른 차트 기간을 설정한다면 충분한 효과를 보장할 수 없습니다. 또한 이더리움에도 적용할 수 있지만, 그 외에 다른 심볼에는 적용하지 않는 것을 권장합니다.
3. Chart art의 스크립트는 전략을 사용자가 원하는 기간에 적용할 수 없었기 때문에, 저는 Enable Date Filter를 추가하였습니다. 이 기능을 통해 전략 사용을 원하지 않는 기간을 설정할 수 있습니다. 또한 이 기능을 완전히 사용하고싶지 않다면 체크를 해제할 수 있습니다. 사용 기간이 아닌 제외 기간인 점을 상기하시길 바랍니다. 이 기능을 통해 우리는 전체 기간이 아닌 가까운 특정 시점부터의 전략 적용 효과를 확인할 수 있습니다. 또한 사용자가 전략을 사용한 시점부터의 효과를 명백히 구분할 수 있습니다.
4. 또한 사용자가 적용을 원하지 않는 하루 중의 특정 시간대에 전략 사용을 멈출 수도 있습니다. 이는 위에 설명한 Enalbe Date Filter와 유사하게 작동합니다. 이를 통해 당신이 온전히 이 전략을 신뢰하지 못하여도 당신은 마음 편하게 잠에 들 수 있습니다.
5. RSI의 기간 및 과매수, 과매도 수치를 개별적으로 설정할 수 있습니다. 예를 들어 당신이 롱 포지션을 취할 때에는 RSI를 7의 기간으로 설정할 수 있고, 동시에 숏 포지션을 진입하는 RSI는 14의 기간으로 설정될 수 있습니다. 또한 과매수 및 과매도의 기준 수치를 당신이 합리적이라고 생각하는 수준으로 설정할 수 있습니다. 이 수치는 볼린져밴드와 함께 작동하여 그것을 넘어서거나 다시 되돌아올 때 포지션 진입에 영향을 미칩니다.
6. API 선물거래를 기준으로 하여 기본적인 슬리피지와 커미션이 적용되어있습니다. 이는 시장가 거래에 맞춰져 있습니다. 이는 당신의 수익을 좀 더 합리적인 수치로 보일 수 있게 합니다.
Chartart에게 특별히 감사합니다. 당신은 천재입니다.
חפש סקריפטים עבור "弘历投教boll指标代码分析"

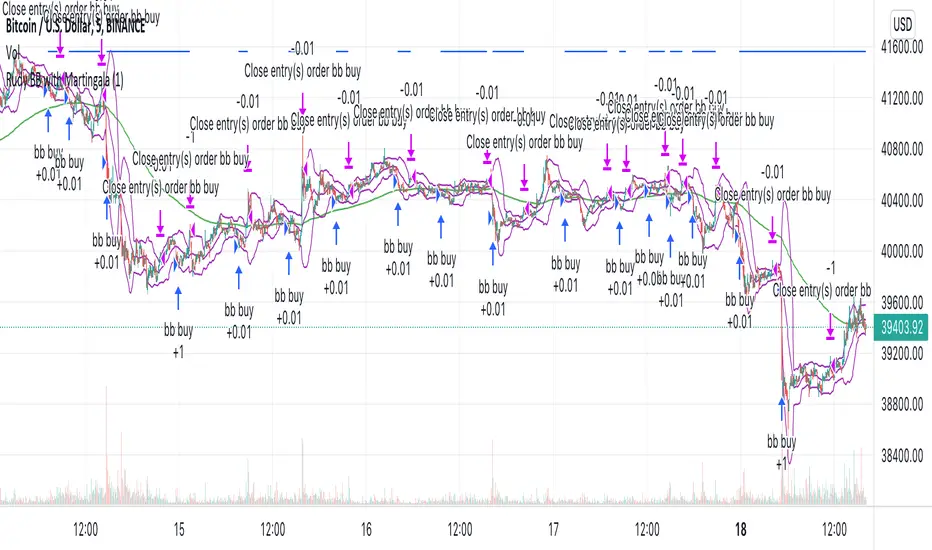
Rudy's BB with MartingaleMy first strategy script that uses Bollinger Bands and Martingale to increase contract size after negative profit.
Open Interest with Bollinger Bands and some moving averages!!! This indicator only shows Binance Perpetuals Open Interest !!!
!!!!! When Binance Spot pair charts is selected, It still shows the perpetual contract Open Interest, if the pair on the chart is tradeble on perpetual contracts. I assume you know what Open Interest is. !!!!!
ZLEMA, Tillson, VAR MAs codes are coming from @KivancOzbilgic => SuperTrended Moving Averages

SuperJump Turn Back Bollinger BandThis is a simple indicator using bolinger band return.
After the candle's bolinger band broke out,
Turn back inside BB is the entry point.
Usually there are more than two triangles, so you can wait after ordering a better price.
As you already know about it, it is very dangerous for the bolinger band to enter in the reverse direction when a strong trend is created.
That's why I made the Red Line. It is calculated by ATR and will suggest you an appropriate StopLoss value.

MA Bollinger Bands + RSI This script uses the standard deviation of a given moving average along with an RSI direction.
When: rsi crossover neutral line + price crossover lower deviation boundary => long
When: rsi crossunder neutral line + price crossunder upper deviation boundary => short

Contrarian Scalping Counter Trend Bb Envelope Adx and StochasticContrarian Scalping is an trading strategy designed to take advanted of a counter-trend.
The advantage of these strrategies types is that they have a good profitability but with do not great gain (in relation at the time frame).
Indicators used:
Bollinger
Envelope
ADX
Stochastic
Rules for entry
For short: close of the price is above upper band from bb and envelope, adx is below 30 and stochastic is above 50
For long: close of the price is below lower band from bb and envelope, adx is below 30 and stochastic is below 50
Rules for exit
For short: either close of the candle is below lower band of bb or enveloper or stochastic is below 50
For long: either close o the candle is above upper band of bb or envelope or stochastic is above 50
If there are any questions let me know !

Swing Assassin's Consolidated ScriptI put this script together to essentially consolidate a number of scripts that I use on a daily basis into one script. This is an ongoing improvement effort, so there may be some garbage in here right now so keep that in mind if you intend to use this to help in your trading.
There are 5 moving averages (Hull). I use the Fast, Mid and Slow to find entries after I us the Medium Slow and Super Slow to identify a trend. Otherwise, I have those three turned off.
This script also uses Bollinger Bands which I literally cannot trade without.
The script also has anchored VWAP , automated support/resistance lines, and a homebrewed Volume Profile that is a copy from Ildar Akhmetgaleev's indicator "Poor Man's Volume Profile" used under Mozilla Public License Version 2.0.

EXAMPLES:enhanced_taThis script is created to demonstrate usage of enhanced ta library which is present here :
Following custom indicators are populated in this script:
ma (Select moving average)
atr/atrpercent (With custom moving average)
bands - Bollinger Band, Keltner Channel, Donchian Channel (All with enhanced versions and additional options)
bandwidth - Bandwidth for the bands available. Uses same input as that of bands
bandpercent - Percentage in relation to band upper and lower levels. Uses same input as that of bands.
oscillator (oscillatorRange) - Generating custom overbought oversold regions.
Display Options
Display individual indicator by selecting them through dropdown. If you select all, we also look at overlay and non-overlay parameters to show/hide only those indicators which are applicable on candle overlay or as separate window.

MACD + BB + RSI Strategy [Alorse]A very simple and highly effective strategy that combines 3 famous indicators:
MACD
Bollinger Bands
RSI
Entry conditions are:
The MACD line crosses over the signal line.
RSI less than 50
Price below the BB baseline
Exit conditions are:
RSI greater than 70
Closing price higher than the upper BB
Or when the price hits the Stop Loss defined by you (Feature).

RSI in Bollinger bandsI added Bolinger bands to the RSI indicator.
This shows you the area of reversal for the RSI. Generally, when the indicator falls out of the bands, you'll see a quick reversal. Indeed this is a better way to find the overbought and oversold areas.

RSI+ChannelbandsThis Indicator displays a normal RSI with overbought/-sold lines which is calculated with donchian channels, pivot channel, bollinger bands and three horizontal lines.
You can averaged the channels, bands and h-lines in any combination or you can use just one of them for calculating the overbought/-sold lines.
The midline is colored in default settings in yellow for upptrending and blue for downtrending.

Tradingview ToolkitA new trader's biggest barrier to entry is lack of understanding where they are in terms of time and price and with tradingview free they are often limited to just 1 or 2 extra indicators as many new traders slap on RSI and MACD as 2/3 free ones. While these indicators are fine for trend analysis, its important to know where the price is in relation to time. Thus, this all-in-one script is meant to have a lot of customizable utility to save on indicator spots and act as a hotspot for many common needs.
-2 Sets of VWAP line w/ standard deviation bands with customizable timeframes.
-1 more customizable timeframe VWAP line (no std dev bands) to use as a long time frame reference
-Ability to plot previous VWAP close prices over current timeframe on all VWAP lines w/ basic color changing if price closes above/below
-2 Sets of Bollinger Bands with customizable source length and MA type
-3 customizable moving averages with custom timeframe/resolutions
-Inside candle barcolor repainter to easily notice if a candle was inside the range of the previous candle (price contraction)
Not meant to have everything on at once, but simply a place to enable and disable different things and save spots for more important things

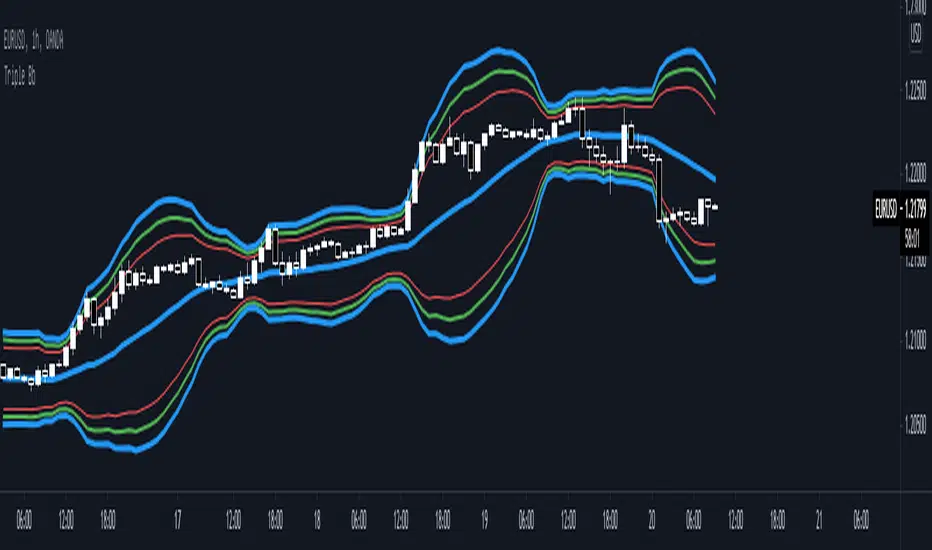
Triple Bb* Triple Bb display maximum 3 Bollinger Bands and each bands could be easily adjust.
* Each Bands Adjustable:
1. Source
2. Period
3. Standard Deviation
4. Color
5. Width
6. Show / Not Show
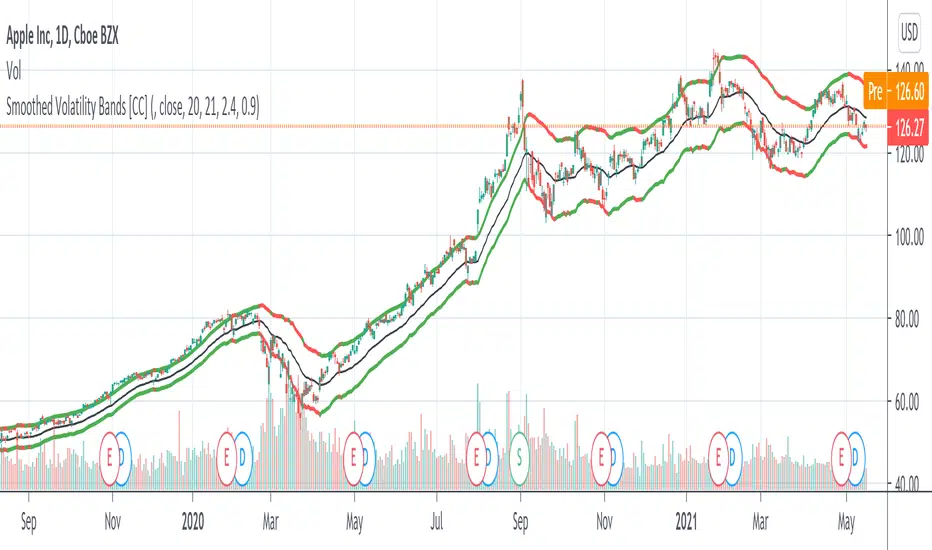
Smoothed Volatility Bands [CC]The Smoothed Volatility Bands were created by Sylvain Vervoort (Stocks and Commodities Sep 2020 pg 19) and this is a heavily customized version of regular Bollinger Bands that take volatility into account. Feel free to change the moving average since Vervoort recommended trying that out. Buy when the indicator line turns green and sell when it turns red.
Let me know if there are any other indicators you want me to publish!
VWMACDV2 w/Intraday Intensity Index Histogram & VBCB Hello traders! In this script i tried to combine Kıvanç Özbilgiç's Volume Based Coloured Bars, Volume Weighted Macd V2 and Intraday Intensity Index developed by Dave Bostian and added to Tradingview by Kıvanç Özbilgiç. Let's see what we got here;
VBCB, Paints candlestick bars according to the volume of that bar. Period is 30 by default. If you're trading stocks, 21 should be better.
Volume Weighted Macd V2, "Here in this version; Exponential Moving Averages used and Weighted by Volume instead of using only vwma (Volume Weighted Moving Averages)." Says, Kıvanç Özbilgiç.
III, "A technical indicator that approximates the volume of trading for a specified security in a given day. It is designed to help track the activity of institutional block traders and is calculated by subtracting the day's high and low from double the closing price, divided by the volume and multiplied by the difference between the high and the low."
*Histogram of vwmacd changes color according to the value of III. (Green if positive, yellow if negative value)*
VWMACD also comes with the values of 21,13,3... Which are fibonacci numbers and that's how i use it. You can always go back to the good old 26,12,9.
Other options according to the fibonacci numbers might be= 21,13,5-13,8,3-13,8,5... (For shorter terms of trading)
Trading combined with the bollinger bands is strongly advised for both VWMACD and III. VBCB is just the candy on top :)
Enjoy!

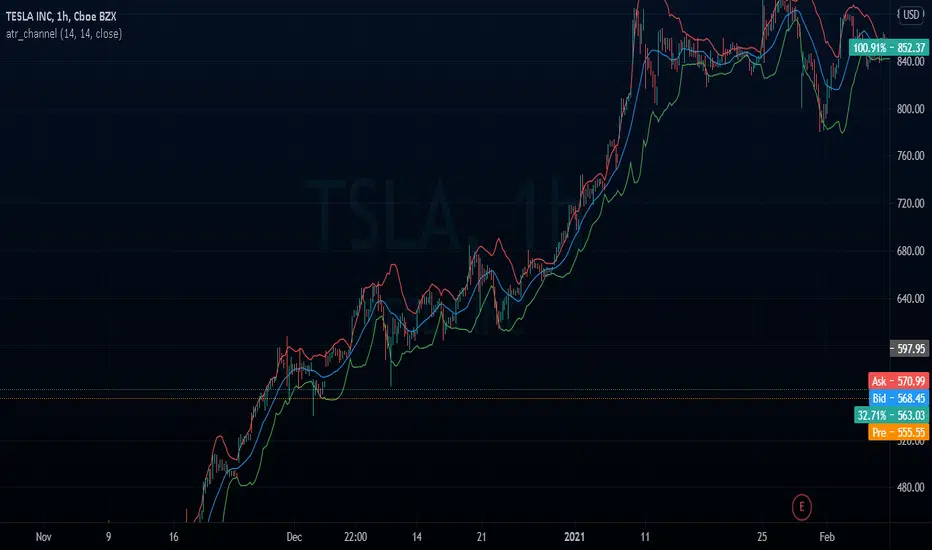
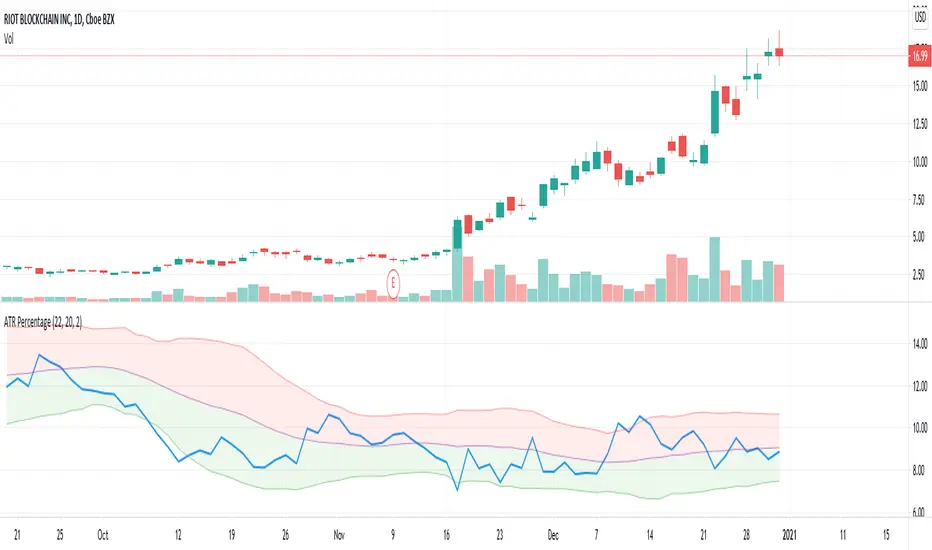
atr_channelThe original bollinger bands have a fixed deviation of 2%, this channel calculates the ATR % (Atr Percentage) and places the upper and lower bands
RSI + Kijun/Standard Deviation on RSIThe script is inspired by Bollinger bands but instead of applying them on the price, they are applied on a RSI oscillator. The standard deviation is not plotted against the average like in normal BBs but instead is based on median values (equivalent of a Kijun in Ichimoku ). The goal is to better identify excess in prices that offer good entering points. The usage of a median provides a clearer view of ranging market (ie. the line will be flat).
I use it for long-term investments on stocks to find "fair" entry points. After picking a list of stocks of interest based on fundamentals, I switch to a weekly view. If the stock RSI is under the bands, it indicates that we are in favorable conditions for a buy. For an accurate timing, you can switch to the daily chart and watch out for either a break or a reintegration in the bands. This is your signal.

ATR PercentageThis indicator plots ATR as percentage of close price. Also applying bollinger bands on it to visualize it is relatively high or low.
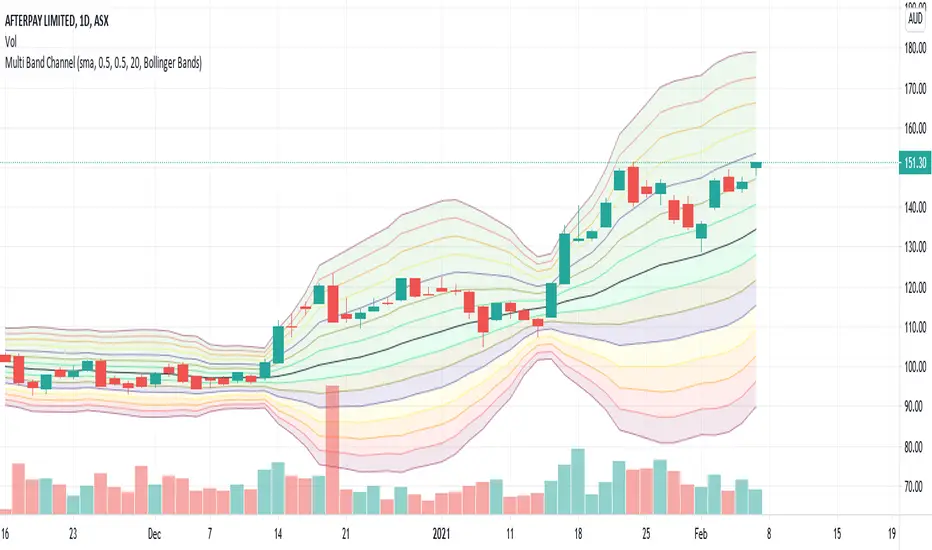
Multi Band ChannelPutting multiple bollinger bands/keltener channels together helps visualize the relative price movement. I have also used this in my BuyTheDip V2 strategy to measure dip and bounce back. 7 Standard deviation is used here. These are calculated based on the input fields StdDevStart and StdDevStep .
Cosmic BB SRThis script is based on Bollinger Bands/Bandwidth data and displays support and resistance levels (thick horizontal lines), the direction/volatility of the levels (thin dynamic lines), and the testing of the levels (cross markers).

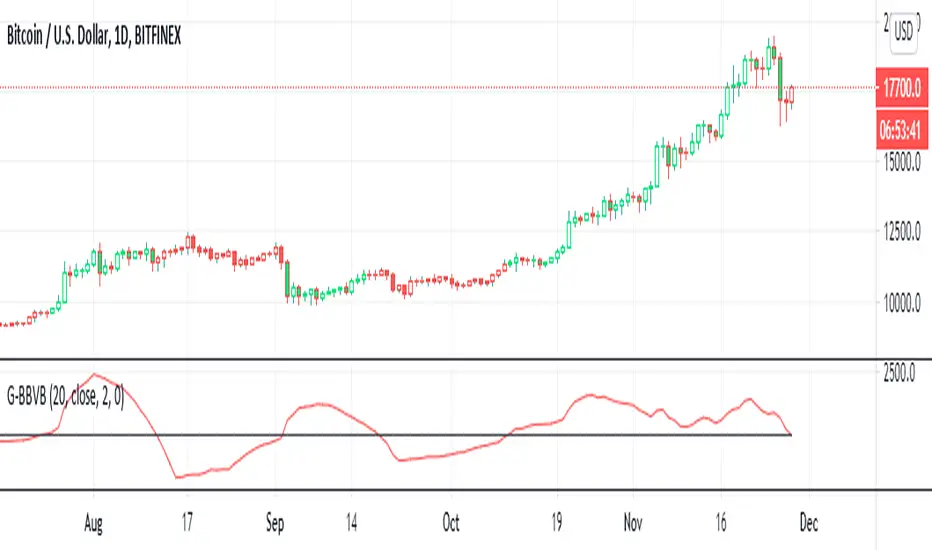
G-Bollinger bands volatility breakout v.1This is my frist publish scrpit. I developed this indicator origin is BB. It make from easy idea but powerful for sideway to breakout
1. I findout volatility by upper band of BB - lower band of BB (I called "Aline")
2. I created SMA of Aline (I called Bline)
3. I created the special line is "Cline" from Aline - Bline
4. I created 0 line " Baseline "
G-BBvB is the very good indicator to detect low volatility to begin the volatility = Buy signal
Now I can't find the sell signal form indicator. I try backtest sell at Cline cross zeroline but it not work.
I'll develop "G" indicator for free .
Goodluck :D
Horcrux OscilatorDoes your oscilator give exit signal on time? Mine does. However worst the idea is, I had to come up with a horcrux plan :P
Concept is as below:
I use 7 standard deviation Bollinger bands to identify which level current price is in. Standard deviations used are from 0.5 (lowest level) to 3.5(highest level) with 0.5 step . This creates overall 16 levels ranging from 0 to 15 with 0 being the highest level and 15 being the lowest.
LookbackPeriod is used to calculate max and min values of these threshold over certain bars. Average of max and min constitutes threshold.
Horcrux value is difference between max state and current state in LookbackPeriod.
Lower the horcrux much closer the current state to the highest state. Hence, horcrux higher than threshold is considered as green region where prices are moving up. Decrease in number of horcruxes means price state moving closer to highest state (which is the lower level). Hence, indicates reduced momentum or reversal.
Use higher LookbackPeriod for increased accuracy. Increase BBLength for long term trades. Adjustment is used to adjust threshold line by up to + or - 20%

Stock Market Strategy : VWAP, MACD, EMA, Breakout, BBHello there,
Today I bring you a stock market strategy, specialized in NASDAQ stocks.
Its a daytrading strategy, that can only do a max of 1 trade per day. In this case it only trades the first 2 opening hours of the market.
The rules are simple :
We follow the trend based on a big EMA, in this case 200, after that, we check for VWAP direction , then, we check histogram from MACD. This is the simple logic of the strategy.
Inside there is another strategy, that not just do the above, but also uses Bollinger bands, and checks for breakout of bottom or top line. Also it uses Average directional Index, for even a bigger criteria .
So for example a long condition it would be : candle is above the ema, and candle is above vwap, and histogram is positive, and candle break the top bb level and ADI < 40 -> long signal . The opposite works for short(ADI > 20).
In this case all this criterias are between the first 2 hours of market. So we enter between the first hour, and exit in the next hour. For this we need to use very short time frames.
Hope you enjoy it.
Let me know if you have any questions
