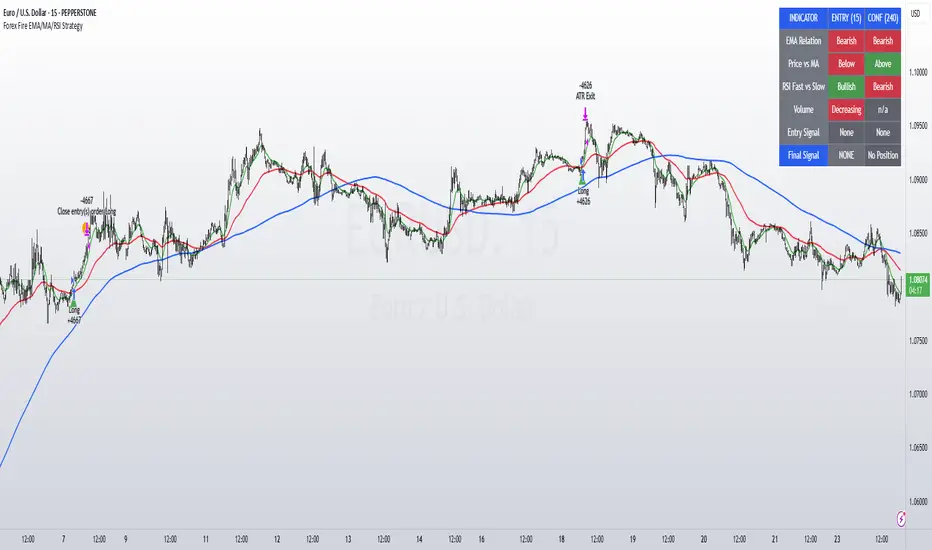
Forex Fire EMA/MA/RSI StrategyEURUSD
The entry method in the Forex Fire EMA/MA/RSI Strategy combines several conditions across two timeframes. Here's a breakdown of how entries are determined:
Long Entry Conditions:
15-Minute Timeframe Conditions:
EMA 13 > EMA 62 (short-term momentum is bullish)
Price > MA 200 (trading above the major trend indicator)
Fast RSI (7) > Slow RSI (28) (momentum is increasing)
Fast RSI > 50 (showing bullish momentum)
Volume is increasing compared to 20-period average
4-Hour Timeframe Confluence:
EMA 13 > EMA 62 (larger timeframe confirms bullish trend)
Price > MA 200 (confirming overall uptrend)
Slow RSI (28) > 40 (showing bullish bias)
Fast RSI > Slow RSI (momentum is supporting the move)
Additional Precision Requirement:
Either EMA 13 has just crossed above EMA 62 (crossover)
OR price has just crossed above MA 200
Short Entry Conditions:
15-Minute Timeframe Conditions:
EMA 13 < EMA 62 (short-term momentum is bearish)
Price < MA 200 (trading below the major trend indicator)
Fast RSI (7) < Slow RSI (28) (momentum is decreasing)
Fast RSI < 50 (showing bearish momentum)
Volume is increasing compared to 20-period average
4-Hour Timeframe Confluence:
EMA 13 < EMA 62 (larger timeframe confirms bearish trend)
Price < MA 200 (confirming overall downtrend)
Slow RSI (28) < 60 (showing bearish bias)
Fast RSI < Slow RSI (momentum is supporting the move)
Additional Precision Requirement:
Either EMA 13 has just crossed under EMA 62 (crossunder)
OR price has just crossed under MA 200
The key aspect of this strategy is that it requires alignment between the shorter timeframe (15m) and the larger timeframe (4h), which helps filter out false signals and focuses on trades that have strong multi-timeframe support. The crossover/crossunder requirement further refines entries by looking for actual changes in direction rather than just conditions that might have been in place for a long time.
חפש סקריפטים עבור "泰国一寺庙被曝藏有40多具尸体"
StatPivot- Dynamic Range Analyzer - indicator [PresentTrading]Hello everyone! In the following few open scripts, I would like to share various statistical tools that benefit trading. For this time, it is a powerful indicator called StatPivot- Dynamic Range Analyzer that brings a whole new dimension to your technical analysis toolkit.
This tool goes beyond traditional pivot point analysis by providing comprehensive statistical insights about price movements, helping you identify high-probability trading opportunities based on historical data patterns rather than subjective interpretations. Whether you're a day trader, swing trader, or position trader, StatPivot's real-time percentile rankings give you a statistical edge in understanding exactly where current price action stands within historical contexts.
Welcome to share your opinions! Looking forward to sharing the next tool soon!
█ Introduction and How it is Different
StatPivot is an advanced technical analysis tool that revolutionizes retracement analysis. Unlike traditional pivot indicators that only show static support/resistance levels, StatPivot delivers dynamic statistical insights based on historical pivot patterns.
Its key innovation is real-time percentile calculation - while conventional tools require new pivot formations before updating (often too late for trading decisions), StatPivot continuously analyzes where current price stands within historical retracement distributions.
Furthermore, StatPivot provides comprehensive statistical metrics including mean, median, standard deviation, and percentile distributions of price movements, giving traders a probabilistic edge by revealing which price levels represent statistically significant zones for potential reversals or continuations. By transforming raw price data into statistical insights, StatPivot helps traders move beyond subjective price analysis to evidence-based decision making.
█ Strategy, How it Works: Detailed Explanation
🔶 Pivot Point Detection and Analysis
The core of StatPivot's functionality begins with identifying significant pivot points in the price structure. Using the parameters left and right, the indicator locates pivot highs and lows by examining a specified number of bars to the left and right of each potential pivot point:
Copyp_low = ta.pivotlow(low, left, right)
p_high = ta.pivothigh(high, left, right)
For a point to qualify as a pivot low, it must have left higher lows to its left and right higher lows to its right. Similarly, a pivot high must have left lower highs to its left and right lower highs to its right. This approach ensures that only significant turning points are recognized.
🔶 Percentage Change Calculation
Once pivot points are identified, StatPivot calculates the percentage changes between consecutive pivot points:
For drops (when a pivot low is lower than the previous pivot low):
CopydropPercent = (previous_pivot_low - current_pivot_low) / previous_pivot_low * 100
For rises (when a pivot high is higher than the previous pivot high):
CopyrisePercent = (current_pivot_high - previous_pivot_high) / previous_pivot_high * 100
These calculations quantify the magnitude of each market swing, allowing for statistical analysis of historical price movements.
🔶 Statistical Distribution Analysis
StatPivot computes comprehensive statistics on the historical distribution of drops and rises:
Average (Mean): The arithmetic mean of all recorded percentage changes
CopyavgDrop = array.avg(dropValues)
Median: The middle value when all percentage changes are arranged in order
CopymedianDrop = array.median(dropValues)
Standard Deviation: Measures the dispersion of percentage changes from the average
CopystdDevDrop = array.stdev(dropValues)
Percentiles (25th, 75th): Values below which 25% and 75% of observations fall
Copyq1 = array.get(sorted, math.floor(cnt * 0.25))
q3 = array.get(sorted, math.floor(cnt * 0.75))
VaR95: The maximum expected percentage drop with 95% confidence
Copyvar95D = array.get(sortedD, math.floor(nD * 0.95))
Coefficient of Variation (CV): Measures relative variability
CopycvD = stdDevDrop / avgDrop
These statistics provide a comprehensive view of market behavior, enabling traders to understand the typical ranges and extreme moves.
🔶 Real-time Percentile Ranking
StatPivot's most innovative feature is its real-time percentile calculation. For each current price, it calculates:
The percentage drop from the latest pivot high:
CopycurrentDropPct = (latestPivotHigh - close) / latestPivotHigh * 100
The percentage rise from the latest pivot low:
CopycurrentRisePct = (close - latestPivotLow) / latestPivotLow * 100
The percentile ranks of these values within the historical distribution:
CopyrealtimeDropRank = (count of historical drops <= currentDropPct) / total drops * 100
This calculation reveals exactly where the current price movement stands in relation to all historical movements, providing crucial context for decision-making.
🔶 Cluster Analysis
To identify the most common retracement zones, StatPivot performs a cluster analysis by dividing the range of historical drops into five equal intervals:
CopyrangeSize = maxVal - minVal
For each interval boundary:
Copyboundaries = minVal + rangeSize * i / 5
By counting the number of observations in each interval, the indicator identifies the most frequently occurring retracement zones, which often serve as significant support or resistance areas.
🔶 Expected Price Targets
Using the statistical data, StatPivot calculates expected price targets:
CopytargetBuyPrice = close * (1 - avgDrop / 100)
targetSellPrice = close * (1 + avgRise / 100)
These targets represent statistically probable price levels for potential entries and exits based on the average historical behavior of the market.
█ Trade Direction
StatPivot functions as an analytical tool rather than a direct trading signal generator, providing statistical insights that can be applied to various trading strategies. However, the data it generates can be interpreted for different trade directions:
For Long Trades:
Entry considerations: Look for price drops that reach the 70-80th percentile range in the historical distribution, suggesting a statistically significant retracement
Target setting: Use the Expected Sell price or consider the average rise percentage as a reasonable target
Risk management: Set stop losses below recent pivot lows or at a distance related to the statistical volatility (standard deviation)
For Short Trades:
Entry considerations: Look for price rises that reach the 70-80th percentile range, indicating an unusual extension
Target setting: Use the Expected Buy price or average drop percentage as a target
Risk management: Set stop losses above recent pivot highs or based on statistical measures of volatility
For Range Trading:
Use the most common drop and rise clusters to identify probable reversal zones
Trade bounces between these statistically significant levels
For Trend Following:
Confirm trend strength by analyzing consecutive higher pivot lows (uptrend) or lower pivot highs (downtrend)
Use lower percentile retracements (20-30th percentile) as entry opportunities in established trends
█ Usage
StatPivot offers multiple ways to integrate its statistical insights into your trading workflow:
Statistical Table Analysis: Review the comprehensive statistics displayed in the data table to understand the market's behavior. Pay particular attention to:
Average drop and rise percentages to set reasonable expectations
Standard deviation to gauge volatility
VaR95 for risk assessment
Real-time Percentile Monitoring: Watch the real-time percentile display to see where the current price movement stands within the historical distribution. This can help identify:
Extreme movements (90th+ percentile) that might indicate reversal opportunities
Typical retracements (40-60th percentile) that might continue further
Shallow pullbacks (10-30th percentile) that might represent continuation opportunities in trends
Support and Resistance Identification: Utilize the plotted pivot points as key support and resistance levels, especially when they align with statistically significant percentile ranges.
Target Price Setting: Use the expected buy and sell prices calculated from historical averages as initial targets for your trades.
Risk Management: Apply the statistical measurements like standard deviation and VaR95 to set appropriate stop loss levels that account for the market's historical volatility.
Pattern Recognition: Over time, learn to recognize when certain percentile levels consistently lead to reversals or continuations in your specific market, and develop personalized strategies based on these observations.
█ Default Settings
The default settings of StatPivot have been carefully calibrated to provide reliable statistical analysis across a variety of markets and timeframes, but understanding their effects allows for optimal customization:
Left Bars (30) and Right Bars (30): These parameters determine how pivot points are identified. With both set to 30 by default:
A pivot low must be the lowest point among 30 bars to its left and 30 bars to its right
A pivot high must be the highest point among 30 bars to its left and 30 bars to its right
Effect on performance: Larger values create fewer but more significant pivot points, reducing noise but potentially missing important market structures. Smaller values generate more pivot points, capturing more nuanced movements but potentially including noise.
Table Position (Top Right): Determines where the statistical data table appears on the chart.
Effect on performance: No impact on analytical performance, purely a visual preference.
Show Distribution Histogram (False): Controls whether the distribution histogram of drop percentages is displayed.
Effect on performance: Enabling this provides visual insight into the distribution of retracements but can clutter the chart.
Show Real-time Percentile (True): Toggles the display of real-time percentile rankings.
Effect on performance: A critical setting that enables the dynamic analysis of current price movements. Disabling this removes one of the key advantages of the indicator.
Real-time Percentile Display Mode (Label): Chooses between label display or indicator line for percentile rankings.
Effect on performance: Labels provide precise information at the current price point, while indicator lines show the evolution of percentile rankings over time.
Advanced Considerations for Settings Optimization:
Timeframe Adjustment: Higher timeframes generally benefit from larger Left/Right values to identify truly significant pivots, while lower timeframes may require smaller values to capture shorter-term swings.
Volatility-Based Tuning: In highly volatile markets, consider increasing the Left/Right values to filter out noise. In less volatile conditions, lower values can help identify more potential entry and exit points.
Market-Specific Optimization: Different markets (forex, stocks, commodities) display different retracement patterns. Monitor the statistics table to see if your market typically shows larger or smaller retracements than the current settings are optimized for.
Trading Style Alignment: Adjust the settings to match your trading timeframe. Day traders might prefer settings that identify shorter-term pivots (smaller Left/Right values), while swing traders benefit from more significant pivots (larger Left/Right values).
By understanding how these settings affect the analysis and customizing them to your specific market and trading style, you can maximize the effectiveness of StatPivot as a powerful statistical tool for identifying high-probability trading opportunities.

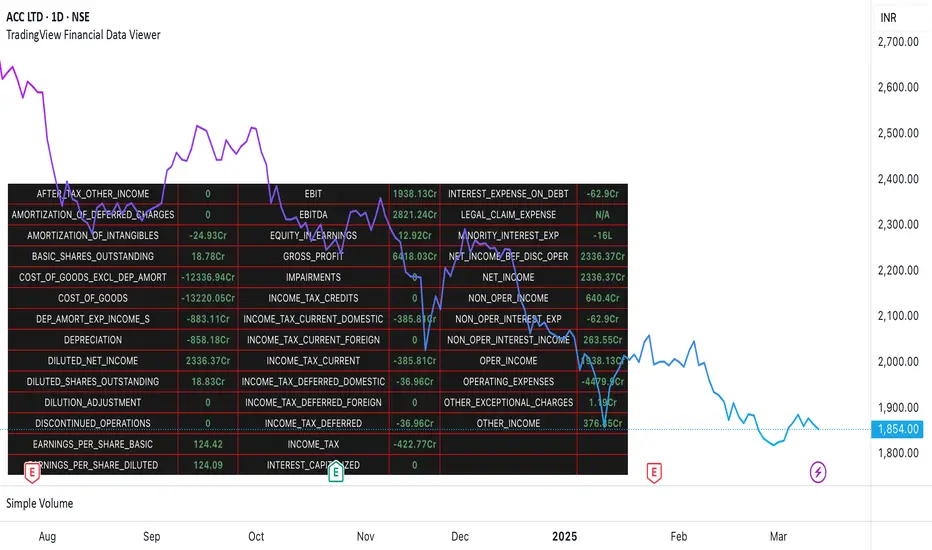
TradingView Financial Data ViewerTrading view provides request.security function to view the financial information of a script. The available sets of data is documented on below link
www.tradingview.com
The problem is there is no easy way to view this data as there are limitations to the # of unique requests that can be made. The limit is 40 for general paid accounts. So its makes it impossible to view the data in case you are looking to build a plugin related to some financial analysis.
So I came up with this trading view plugin which based on the documentation bifurcates the values available in the FQ, TTM and FY periods. Then you can select which period you would like to see. How many values you want to see at a time. And then next set of data can be viewed by increasing the Set # from 1 to which ever number keeps giving you the data.
Notes:
This is a data view only indicator and it will only display the latest data available for which quarter was there.
In case you want to view past data then you should go to replay mode and cut to the relative earning tags where you want to view the data
This is again for educational or study purpose only and is majorly helpful for those who want to create indicators based on Trading view supported financials and want to view what values are given for specific financial ids
The documentation reference and source of the plugin can be checked
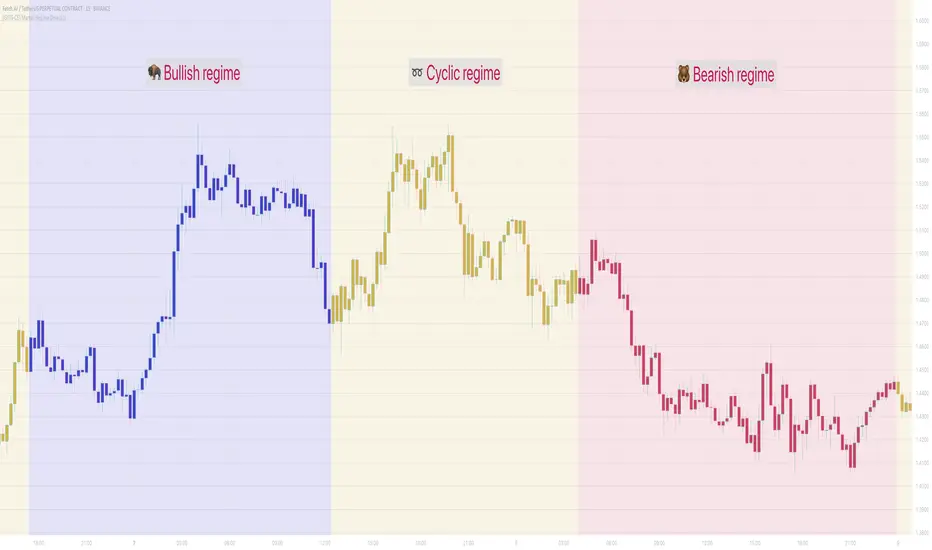
[GYTS-CE] Market Regime Detector🧊 Market Regime Detector (Community Edition)
🌸 Part of GoemonYae Trading System (GYTS) 🌸
🌸 --------- INTRODUCTION --------- 🌸
💮 What is the Market Regime Detector?
The Market Regime Detector is an advanced, consensus-based indicator that identifies the current market state to increase the probability of profitable trades. By distinguishing between trending (bullish or bearish) and cyclic (range-bound) market conditions, this detector helps you select appropriate tactics for different environments. Instead of forcing a single strategy across all market conditions, our detector allows you to adapt your approach based on real-time market behaviour.
💮 The Importance of Market Regimes
Markets constantly shift between different behavioural states or "regimes":
• Bullish trending markets - characterised by sustained upward price movement
• Bearish trending markets - characterised by sustained downward price movement
• Cyclic markets - characterised by range-bound, oscillating behaviour
Each regime requires fundamentally different trading approaches. Trend-following strategies excel in trending markets but fail in cyclic ones, while mean-reversion strategies shine in cyclic markets but underperform in trending conditions. Detecting these regimes is essential for successful trading, which is why we've developed the Market Regime Detector to accurately identify market states using complementary detection methods.
🌸 --------- KEY FEATURES --------- 🌸
💮 Consensus-Based Detection
Rather than relying on a single method, our detector employs two complementary detection methodologies that analyse different aspects of market behaviour:
• Dominant Cycle Average (DCA) - analyzes price movement relative to its lookback period, a proxy for the dominant cycle
• Volatility Channel - examines price behaviour within adaptive volatility bands
These diverse perspectives are synthesised into a robust consensus that minimises false signals while maintaining responsiveness to genuine regime changes.
💮 Dominant Cycle Framework
The Market Regime Detector uses the concept of dominant cycles to establish a reference framework. You can input the dominant cycle period that best represents the natural rhythm of your market, providing a stable foundation for regime detection across different timeframes.
💮 Intuitive Parameter System
We've distilled complex technical parameters into intuitive controls that traders can easily understand:
• Adaptability - how quickly the detector responds to changing market conditions
• Sensitivity - how readily the detector identifies transitions between regimes
• Consensus requirement - how much agreement is needed among detection methods
This approach makes the detector accessible to traders of all experience levels while preserving the power of the underlying algorithms.
💮 Visual Market Feedback
The detector provides clear visual feedback about the current market regime through:
• Colour-coded chart backgrounds (purple shades for bullish, pink for bearish, yellow for cyclic)
• Colour-coded price bars
• Strength indicators showing the degree of consensus
• Customizable colour schemes to match your preferences or trading system
💮 Integration in the GYTS suite
The Market Regime Detector is compatible with the GYTS Suite , i.e. it passes the regime into the 🎼 Order Orchestrator where you can set how to trade the trending and cyclic regime.
🌸 --------- CONFIGURATION SETTINGS --------- 🌸
💮 Adaptability
Controls how quickly the Market Regime detector adapts to changing market conditions. You can see it as a low-frequency, long-term change parameter:
Very Low: Very slow adaptation, most stable but may miss regime changes
Low: Slower adaptation, more stability but less responsiveness
Normal: Balanced between stability and responsiveness
High: Faster adaptation, more responsive but less stable
Very High: Very fast adaptation, highly responsive but may generate false signals
This setting affects lookback periods and filter parameters across all detection methods.
💮 Sensitivity
Controls how sensitive the detector is to market regime transitions. This acts as a high-frequency, short-term change parameter:
Very Low: Requires substantial evidence to identify a regime change
Low: Less sensitive, reduces false signals but may miss some transitions
Normal: Balanced sensitivity suitable for most markets
High: More sensitive, detects subtle regime changes but may have more noise
Very High: Very sensitive, detects minor fluctuations but may produce frequent changes
This setting affects thresholds for regime detection across all methods.
💮 Dominant Cycle Period
This parameter allows you to specify the market's natural rhythm in bars. This represents a complete market cycle (up and down movement). Finding the right value for your specific market and timeframe might require some experimentation, but it's a crucial parameter that helps the detector accurately identify regime changes. Most of the times the cycle is between 20 and 40 bars.
💮 Consensus Mode
Determines how the signals from both detection methods are combined to produce the final market regime:
• Any Method (OR) : Signals bullish/bearish if either method detects that regime. If methods conflict (one bullish, one bearish), the stronger signal wins. More sensitive, catches more regime changes but may produce more false signals.
• All Methods (AND) : Signals only when both methods agree on the regime. More conservative, reduces false signals but might miss some legitimate regime changes.
• Weighted Decision : Balances both methods with equal weighting. Provides a middle ground between sensitivity and stability.
Each mode also calculates a continuous regime strength value that's used for colour intensity in the 'unconstrained' display mode.
💮 Display Mode
Choose how to display the market regime colours:
• Unconstrained regime: Shows the regime strength as a continuous gradient. This provides more nuanced visualisation where the intensity of the colour indicates the strength of the trend.
• Consensus only: Shows only the final consensus regime with fixed colours based on the detected regime type.
The background and bar colours will change to indicate the current market regime:
• Purple shades: Bullish trending market (darker purple indicates stronger bullish trend)
• Pink shades: Bearish trending market (darker pink indicates stronger bearish trend)
• Yellow: Cyclic (range-bound) market
💮 Custom Colour Options
The Market Regime Detector allows you to customize the colour scheme to match your personal preferences or to coordinate with other indicators:
• Use custom colours: Toggle to enable your own colour choices instead of the default scheme
• Transparency: Adjust the transparency level of all regime colours
• Bullish colours: Define custom colours for strong, medium, weak, and very weak bullish trends
• Bearish colours: Define custom colours for strong, medium, weak, and very weak bearish trends
• Cyclic colour: Define a custom colour for cyclic (range-bound) market conditions
🌸 --------- DETECTION METHODS --------- 🌸
💮 Dominant Cycle Average (DCA)
The Dominant Cycle Average method forms a key part of our detection system:
1. Theoretical Foundation :
The DCA method builds on cycle analysis and the observation that in trending markets, price consistently remains on one side of a moving average calculated using the dominant cycle period. In contrast, during cyclic markets, price oscillates around this average.
2. Calculation Process :
• We calculate a Simple Moving Average (SMA) using the specified lookback period - a proxy for the dominant cycle period
• We then analyse the proportion of time that price spends above or below this SMA over a lookback window. The theory is that the price should cross the SMA each half cycle, assuming that the dominant cycle period is correct and price follows a sinusoid.
• This lookback window is adaptive, scaling with the dominant cycle period (controlled by the Adaptability setting)
• The different values are standardised and normalised to possess more resolving power and to be more robust to noise.
3. Regime Classification :
• When the normalised proportion exceeds a positive threshold (determined by Sensitivity setting), the market is classified as bullish trending
• When it falls below a negative threshold, the market is classified as bearish trending
• When the proportion remains between these thresholds, the market is classified as cyclic
💮 Volatility Channel
The Volatility Channel method complements the DCA method by focusing on price movement relative to adaptive volatility bands:
1. Theoretical Foundation :
This method is based on the observation that trending markets tend to sustain movement outside of normal volatility ranges, while cyclic markets tend to remain contained within these ranges. By creating adaptive bands that adjust to current market volatility, we can detect when price behaviour indicates a trending or cyclic regime.
2. Calculation Process :
• We first calculate a smooth base channel center using a low pass filter, creating a noise-reduced centreline for price
• True Range (TR) is used to measure market volatility, which is then smoothed and scaled by the deviation factor (controlled by Sensitivity)
• Upper and lower bands are created by adding and subtracting this scaled volatility from the centreline
• Price is smoothed using an adaptive A2RMA filter, which has a very flat and stable behaviour, to reduce noise while preserving trend characteristics
• The position of this smoothed price relative to the bands is continuously monitored
3. Regime Classification :
• When smoothed price moves above the upper band, the market is classified as bullish trending
• When smoothed price moves below the lower band, the market is classified as bearish trending
• When price remains between the bands, the market is classified as cyclic
• The magnitude of price's excursion beyond the bands is used to determine trend strength
4. Adaptive Behaviour :
• The smoothing periods and deviation calculations automatically adjust based on the Adaptability setting
• The measured volatility is calculated over a period proportional to the dominant cycle, ensuring the detector works across different timeframes
• Both the center line and the bands adapt dynamically to changing market conditions, making the detector responsive yet stable
This method provides a unique perspective that complements the DCA approach, with the consensus mechanism synthesising insights from both methods.
🌸 --------- USAGE GUIDE --------- 🌸
💮 Starting with Default Settings
The default settings (Normal for Adaptability and Sensitivity, Weighted Decision for Consensus Mode) provide a balanced starting point suitable for most markets and timeframes. Begin by observing how these settings identify regimes in your preferred instruments.
💮 Finding the Optimal Dominant Cycle
The dominant cycle period is a critical parameter. Here are some approaches to finding an appropriate value:
• Start with typical values, usually something around 25 works well
• Visually identify the average distance between significant peaks and troughs
• Experiment with different values and observe which provides the most stable regime identification
• Consider using cycle-finding indicators to help identify the natural rhythm of your market
💮 Adjusting Parameters
• If you notice too many regime changes → Decrease Sensitivity or increase Consensus requirement
• If regime changes seem delayed → Increase Adaptability
• If a trending regime is not detected, the market is automatically assigned to be in a cyclic state
• If you want to see more nuanced regime transitions → Try the "unconstrained" display mode (note that this will not affect the output to other indicators)
💮 Trading Applications
Regime-Specific Strategies:
• Bullish Trending Regime - Use trend-following strategies, trail stops wider, focus on breakouts, consider holding positions longer, and emphasize buying dips
• Bearish Trending Regime - Consider shorts, tighter stops, focus on breakdown points, sell rallies, implement downside protection, and reduce position sizes
• Cyclic Regime - Apply mean-reversion strategies, trade range boundaries, apply oscillators, target definable support/resistance levels, and use profit-taking at extremes
Strategy Switching:
Create a set of rules for each market regime and switch between them based on the detector's signal. This approach can significantly improve performance compared to applying a single strategy across all market conditions.
GYTS Suite Integration:
• In the GYTS 🎼 Order Orchestrator, select the '🔗 STREAM-int 🧊 Market Regime' as the market regime source
• Note that the consensus output (i.e. not the "unconstrained" display) will be used in this stream
• Create different strategies for trending (bullish/bearish) and cyclic regimes. The GYTS 🎼 Order Orchestrator is specifically made for this.
• The output stream is actually very simple, and can possibly be used in indicators and strategies as well. It outputs 1 for bullish, -1 for bearish and 0 for cyclic regime.
🌸 --------- FINAL NOTES --------- 🌸
💮 Development Philosophy
The Market Regime Detector has been developed with several key principles in mind:
1. Robustness - The detection methods have been rigorously tested across diverse markets and timeframes to ensure reliable performance.
2. Adaptability - The detector automatically adjusts to changing market conditions, requiring minimal manual intervention.
3. Complementarity - Each detection method provides a unique perspective, with the collective consensus being more reliable than any individual method.
4. Intuitiveness - Complex technical parameters have been abstracted into easily understood controls.
💮 Ongoing Refinement
The Market Regime Detector is under continuous development. We regularly:
• Fine-tune parameters based on expanded market data
• Research and integrate new detection methodologies
• Optimise computational efficiency for real-time analysis
Your feedback and suggestions are very important in this ongoing refinement process!
Mancini LevelsOverview
This script draws levels at comma-separated groups of numbers. The settings panel has 3 groups of numbers: 一, 二, 三.
Example
Adding 5900, 5955 in the 二 group will add a horizontal line at 5900 and 5955 with labels 5900 二 and 5955 二.
Purpose
To quickly add Mancini levels (obtained from his newsletter).
Use
1. Get support and resistance levels from Mancini's newsletter. E.g.:
5950 (major), 5938-40 (major), 5924...6096-98 (major), 6104 (major), 6112, 6116 (major)
2. Enter levels here to parse. (Trading View prevents external links, so unfortunately I had to remove the link to my parsing tool. This script can still be used by manually entering Mancini's levels into the corresponding fields in settings.)
3. Copy parsed levels into the corresponding fields in settings.
Notes
1. There's a limit to the number of entries the script will draw correctly. Consider removing regular levels that are far from current price action.
2. Crucial levels are up to the user. Mancini defines regular and major levels in his newsletter; sometimes he emphasizes particular levels, which I place in the crucial category. Easily toggle levels from regular or major to crucial using the parsing tool in step 2 above.

Gold Futures 2M 5M Tick Move Indicator📢 Gold Futures Tick Move Indicator 🚀
Customizable Tick-Based Trading Alerts & Visualization
🔹 Overview:
The Gold Futures Tick Move Indicator is designed for traders who rely on tick-based price movements to detect significant market activity. This indicator identifies strong momentum moves, triggers customizable buy and sell signals, and provides clear trade range visualizations with take profit and stop loss levels.
🔹 Key Features:
✅ Customizable Tick Threshold – Adjust the number of ticks needed to trigger a buy/sell signal (default: 65 ticks).
✅ Take Profit & Stop Loss Levels – Automatically calculates and plots exit levels (default: 75 TP, 40 SL).
✅ Buy/Sell Alerts – Get real-time alerts when a candle moves beyond the defined tick threshold.
✅ Custom Colors for Trade Signals – Buy (teal #008080), Sell (hot pink #FF69B4).
✅ Trade Range Visualization – Background colors highlight long & short positions for better clarity.
✅ Candle Highlighting – Turns white when a tick-based signal is detected.
🔹 How It Works:
1️⃣ Set your tick movement threshold – Define how many ticks the price must move to trigger a trade signal.
2️⃣ Customize Take Profit & Stop Loss – Modify exit levels to match your strategy.
3️⃣ Wait for a Signal – If the price moves beyond the defined tick range, the indicator plots a Buy (teal) or Sell (hot pink) signal.
4️⃣ Monitor Trade Zones – Trade ranges are highlighted in teal or pink for quick visualization.
5️⃣ Receive Alerts – Set up TradingView alerts to be notified of trade opportunities.
🔹 Who is This For?
💰 Gold Futures Traders looking to capitalize on price momentum
📈 Scalpers & Day Traders seeking precise tick-based entries
🎯 Algo Traders who want automated alerts & visual cues

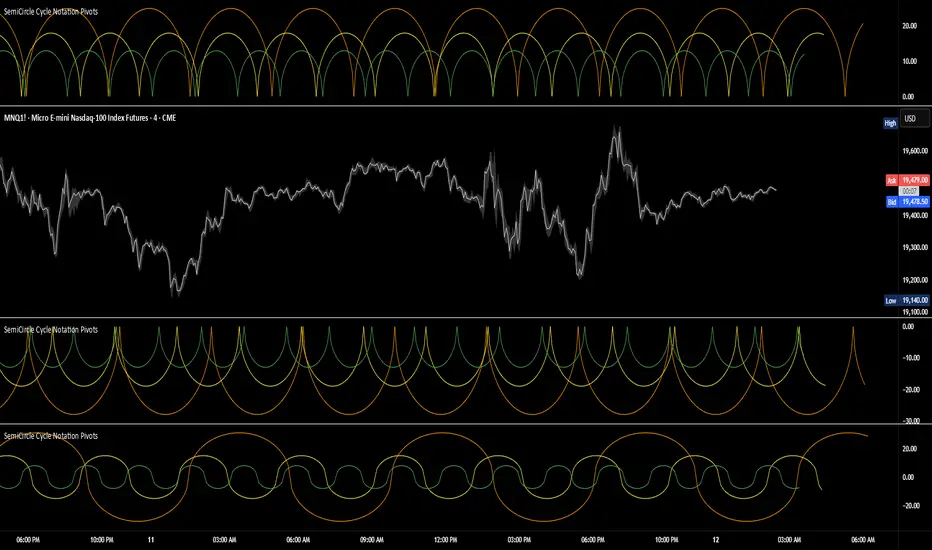
SemiCircle Cycle Notation PivotsFor decades, traders have sought to decode the rhythm of the markets through cycle theory. From the groundbreaking work of HM Gartley in the 1930s to modern-day cycle trading tools on TradingView, the concept remains the same: markets move in repeating waves with larger cycles influencing smaller ones in a fractal-like structure, and understanding their timing gives traders an edge to better anticipate future price movements🔮.
Traditional cycle analysis has always been manual, requiring traders to painstakingly plot semicircles, diamonds, or sine waves to estimate pivot points and time reversals. Drawing tools like semicircle & sine wave projections exist on TradingView, but they lack automation—forcing traders to adjust cycle lengths by eye, often leading to inconsistencies.
This is where SemiCircle Cycle Notation Pivots indicator comes in. Semicircle cycle chart notation appears to have evolved as a practical visualization tool among cycle theorists rather than being pioneered by a single individual; some key influences include HM Gartley, WD Gann, JM Hurst, Walter Bressert, and RayTomes. Built upon LonesomeTheBlue's foundational ZigZag Waves indicator , this indicator takes cycle visualization to the next level by dynamically detecting price pivots and then automatically plotting semicircles based on real-time cycle length calculations & expected rhythm of price action over time.
Key Features:
Automated Cycle Detection: The indicator identifies pivot points based on your preference—highs, lows, or both—and plots semicircle waves that correspond to Hurst's cycle notation.
Customizable Cycle Lengths: Tailor the analysis to your trading strategy with adjustable cycle lengths, defaulting to 10, 20, and 40 bars, allowing for flexibility across various timeframes and assets.
Dynamic Wave Scaling: The semicircle waves adapt to different price structures, ensuring that the visualization remains proportional to the detected cycle lengths and aiding in the identification of potential reversal points.
Automated Cycle Detection: Dynamically identifies price pivot points and automatically adjusts offsets based on real-time cycle length calculations, ensuring precise semicircle wave alignment with market structure.
Color-Coded Cycle Tiers: Each cycle tier is distinctly color-coded, enabling quick differentiation and a clearer understanding of nested market cycles.
EMA Ribbon with 100 MA BY TIJUThe EMA Ribbon with 100 MA is a powerful and visually intuitive indicator designed to help traders identify trends, momentum, and potential support/resistance levels using multiple Exponential Moving Averages (EMAs). By plotting a series of EMAs with varying periods, the script creates a "ribbon" effect on the chart, making it easier to spot trend direction and strength at a glance.
Key Features:
Multiple EMAs for Trend Analysis:
The script plots 8 EMAs with periods ranging from 20 to 55, creating a gradient ribbon effect.
The 100-period EMA is added as a thick blue line, acting as a key level for long-term trend analysis.
Customizable Periods:
Each EMA period is fully customizable, allowing traders to tailor the indicator to their preferred trading style and timeframe.
Visual Clarity:
The EMAs are color-coded, making it easy to distinguish between different periods and identify the overall trend direction.
Dynamic Support/Resistance:
The EMAs act as dynamic support and resistance levels, helping traders identify potential entry and exit points.
Drop Candles Feature:
The script includes an option to drop the first N candles, ensuring cleaner calculations and avoiding false signals during the initial periods.
How to Use:
Trend Identification:
Uptrend: When the shorter-period EMAs are stacked above the longer-period EMAs, it indicates a strong uptrend.
Downtrend: When the longer-period EMAs are stacked above the shorter-period EMAs, it indicates a strong downtrend.
Consolidation: When the EMAs are intertwined, it suggests a sideways or weak trend.
Support/Resistance Levels:
Use the EMAs as dynamic support/resistance levels. For example, in an uptrend, the price may bounce off the lower EMAs.
100-Period EMA:
The 100-period EMA (thick blue line) acts as a key level for long-term trend analysis. A price above this line suggests a bullish bias, while a price below suggests a bearish bias.
Customization:
Adjust the EMA periods and colors to suit your trading strategy.
Use the Drop first N candles option to avoid false signals during the initial periods.
Example Use Cases:
Trend Following:
Enter long positions when the price is above the EMA ribbon and the EMAs are stacked in an uptrend.
Enter short positions when the price is below the EMA ribbon and the EMAs are stacked in a downtrend.
Dynamic Support/Resistance:
Use the EMAs as dynamic support/resistance levels for setting stop-loss or take-profit targets.
Confirmation Tool:
Combine the EMA Ribbon with other indicators (e.g., RSI, MACD) to confirm trade signals.
Settings:
MA-1 to MA-8 Periods: Adjust the periods for the 8 EMAs (default: 20, 25, 30, 35, 40, 45, 50, 55).
MA-100 Period: Adjust the period for the 100 EMA (default: 100).
Source: Choose the price source for the EMAs (default: Close).
Drop First N Candles: Drop the first N candles to avoid false signals (default: 1).
Why Use EMA Ribbon ?
Versatility: Suitable for all trading styles (scalping, day trading, swing trading) and timeframes.
Visual Appeal: The color-coded ribbon makes it easy to interpret the trend at a glance.
Customizable: Tailor the indicator to your specific trading strategy.
Dynamic Levels: Use the EMAs as dynamic support/resistance levels for better risk management.

VIDYA For-Loop | QuantEdgeB Introducing VIDYA For-Loop by QuantEdgeB
Overview
The VIDYA For-Loop indicator by QuantEdgeB is a dynamic trend-following tool that leverages Variable Index Dynamic Average (VIDYA) along with a rolling loop function to assess trend strength and direction. By utilizing adaptive smoothing and a recursive loop for threshold evaluation, this indicator provides a more responsive and robust signal framework for traders.
______
Key Components & Features
📌 VIDYA (Variable Index Dynamic Average)
- Adaptive Moving Average that adjusts its responsiveness based on market volatility.
- Uses a dynamic smoothing constant based on standard deviations.
- Allows for better trend detection compared to static moving averages.
📌 Loop Function (Rolling Calculation)
- A for-loop algorithm continuously compares VIDYA values over a defined lookback range.
- Measures the number of times price trends higher or lower within the rolling window.
- Generates a momentum-based score that helps quantify trend persistence.
📌 Trend Signal Calculation
- A long signal is triggered when the loop score exceeds the upper threshold.
- A short signal is triggered when the loop score falls below the lower threshold.
- The result is a clear directional bias that adapts to changing market conditions.
______
How It Works in Trading
✅ Detects Trend Strength – By measuring cumulative movements within a window.
✅ Filters Noise – Uses adaptive smoothing to avoid whipsaws.
✅ Dynamic Thresholds – Enables customized entry & exit conditions.
✅ Color-Coded Candles – Provides visual clarity for traders.
______
Visual Representation
Trend Signals:
🔵 Blue Candles – Strong Uptrend
🔴 Red Candles – Strong Downtrend
Thresholds:
📈 Long Threshold – Upper bound for bullish confirmation.
📉 Short Threshold – Lower bound for bearish confirmation.
Labels & Annotations (Optional):
✅ Long & Short Labels can be turned on or off for trade signal clarity.
📊 Display of entry & exit points based on loop calculations.
______
Settings:
VIDYA Length: 2 → Number of bars for VIDYA calculation.
SD Length: 5 → Standard deviation length for VIDYA calculation.
Source: Close → Defines the input data source (Close price).
Start Loop: 1 → Initial lookback period for the loop function.
End Loop: 60 → Maximum lookback range for trend scoring.
Long Threshold: 40 → Upper bound for a long signal.
Short Threshold: 10 → Lower bound for a short signal.
Extra Plots: True → Enables additional moving averages for visualization.
______
Conclusion
The VIDYA For-Loop by QuantEdgeB is a next-gen adaptive trend filter that combines dynamic smoothing with recursive trend evaluation, making it an invaluable tool for traders seeking precision and consistency in their strategies.
🔹 Who should use VIDYA For Loop :
📊 Trend-Following Traders – Helps identify sustained trends.
⚡ Momentum Traders – Captures strong price swings.
🚀 Algorithmic & Systematic Trading – Ideal for automated entries & exits.
🔹 Disclaimer: Past performance is not indicative of future results. No trading strategy can guarantee success in financial markets.
🔹 Strategic Advice: Always backtest, optimize, and align parameters with your trading objectives and risk tolerance before live trading.

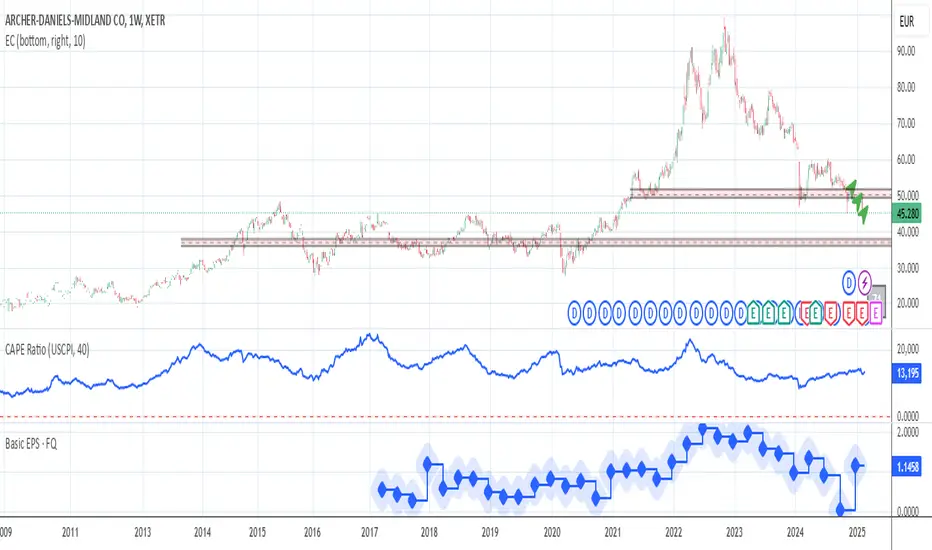
CAPE / Shiller PE Ratio - cristianhkrThe Cyclically Adjusted Price-to-Earnings Ratio (CAPE Ratio), also known as the Shiller P/E Ratio, is a long-term valuation measure for stocks. It was developed by Robert Shiller and smooths out earnings fluctuations by using an inflation-adjusted average of the last 10 years of earnings.
This TradingView Pine Script indicator calculates the CAPE Ratio for a specific stock by:
Fetching historical Earnings Per Share (EPS) data using request.earnings().
Adjusting the EPS for inflation by dividing it by the Consumer Price Index (CPI).
Computing the 10-year (40-quarter) moving average of the inflation-adjusted EPS.
Calculating the CAPE Ratio as (Stock Price) / (10-year Average EPS adjusted for inflation).
Plotting the CAPE Ratio on the chart with a reference line at CAPE = 20, a historically significant threshold.
Custom Index CompositeCustom Index Composite calculates an unweighted composite index by averaging the daily returns of multiple stock tickers. Instead of using price-level weighting, it focuses solely on percentage change, allowing you to compare diverse market themes side by side on a common basis.
Why Use a Custom Index Composite?
Unlike traditional indices that often lean on market capitalization or price-level data, a custom composite based solely on returns strips out the bias inherent to high-priced stocks. This provides several benefits:
Objective Cross-Comparison:
When stocks or market themes trade at very different price levels, it can be difficult to assess performance objectively. Using percentage returns, the composite creates an even playing field, enabling a clear comparison between different assets or themes.
Tailored Benchmarking:
By selecting and combining specific tickers, you can create benchmarks that better represent the segments or strategies you’re interested in. This is particularly useful when standard indices do not capture the nuances of your investment approach.
Performance Normalization:
Converting raw price data into daily percentage returns minimizes distortions that arise from price differences. This normalization helps in understanding true performance trends across the chosen tickers, making the composite index a more reliable gauge of relative market movement.
Custom Analysis Framework:
The indicator offers flexibility to adjust the lookback period (defaulting to about 3 months) so you can fine-tune the sensitivity of the index to recent market behavior. This enables you to either smooth out volatility or capture a more immediate trend, depending on your analytical needs.
Key Features:
Configurable Appearance:
You can easily configure the line color, line width, index name, and index name color via the options panel.
Ticker Configuration:
By default, you can enter up to 15 different tickers into the composite index. Technically, the indicator supports up to 40 tickers (these additional inputs are commented out by default to maintain performance), and you may enable them individually if required.
Calculated Bars Length:
The indicator uses a “Calculated bars length” setting, which is set by default to 63 days (approximately 3 months). This value can be adjusted, and it is recommended to use the greatest common denominator for consistent analysis.
How To Configure Your Chart:
Add the Indicator:
Place the Custom Index Composite on your chart.
Disable Main Symbol Visibility:
Hide the primary symbol’s plot and set its scale to “None” to prevent interference with the composite display.
Pin to Right Scale:
Set the scale of the first composite indicator to “Pinned to right scale.” This helps maintain consistency across different composite indicators.
Add Multiple Composites:
You can add additional composite indicators and set their scales to “Pinned to right scale” (or alternatively to “A”) for convenient comparison.
Limitations:
If a ticker symbol is set once in the options, it cannot be cleared to an empty value later. As a result, the symbol will continue to appear in the indicator’s title on the chart. The only way to remove an unwanted symbol is to completely reset the settings and re-enter your desired tickers.

[3Commas] HA & MAHA & MA
🔷What it does: This tool is designed to test a trend-following strategy using Heikin Ashi candles and moving averages. It enters trades after pullbacks, aiming to let profits run once the risk-to-reward ratio reaches 1:1 while securing the position.
🔷Who is it for: It is ideal for traders looking to compare final results using fixed versus dynamic take profits by adjusting parameters and trade direction—a concept applicable to most trading strategies.
🔷How does it work: We use moving averages to define the market trend, then wait for opposite Heikin Ashi candles to form against it. Once these candles reverse in favor of the trend, we enter the trade, using the last swing created by the pullback as the stop loss. By applying the breakeven ratio, we protect the trade and let it run, using the slower moving average as a trailing stop.
A buy signal is generated when:
The previous candle is bearish (ha_bear ), indicating a pullback.
The fast moving average (ma1) is above the slow moving average (ma2), confirming an uptrend.
The current candle is bullish (ha_bull), showing trend continuation.
The Heikin Ashi close is above the fast moving average (ma1), reinforcing the bullish bias.
The real price close is above the open (close > open), ensuring bullish momentum in actual price data.
The signal is confirmed on the closed candle (barstate.isconfirmed) to avoid premature signals.
dir is undefined (na(dir)), preventing repeated signals in the same direction.
A sell signal is generated when:
The previous candle is bullish (ha_bull ), indicating a temporary upward move before a potential reversal.
The fast moving average (ma1) is below the slow moving average (ma2), confirming a downtrend.
The current candle is bearish (ha_bear), showing trend continuation to the downside.
The Heikin Ashi close is below the fast moving average (ma1), reinforcing bearish pressure.
The real price close is below the open (close < open), confirming bearish momentum in actual price data.
The signal is confirmed after the candle closes (barstate.isconfirmed), avoiding premature entries.
dir is undefined (na(dir)), preventing consecutive signals in the same direction.
In simple terms, this setup looks for trend continuation after a pullback, confirming entries with both Heikin Ashi and real price action, supported by moving average alignment to avoid false signals.
If the price reaches a 1:1 risk-to-reward ratio, the stop will be moved to the entry point. However, if the slow moving average surpasses this level, it will become the new exit point, acting as a trailing stop
🔷Why It’s Unique
Easily visualizes the benefits of using risk-to-reward ratios when trading instead of fixed percentages.
Provides a simple and straightforward approach to trading, embracing the "keep it simple" concept.
Offers clear visualization of DCA Bot entry and exit points based on user preferences.
Includes an option to review the message format before sending signals to bots, with compatibility for multi-pair and futures contract pairs.
🔷 Considerations Before Using the Indicator
⚠️Very important: The indicator must be used on charts with real price data, such as Japanese candlesticks, line charts, etc. Do not use it on Heikin Ashi charts, as this may lead to unrealistic results.
🔸Since this is a trend-following strategy, use it on timeframes above 4 hours, where market noise is reduced and trends are clearer. Also, carefully review the statistics before using it, focusing on pairs that tend to have long periods of well-defined trends.
🔸Disadvantages:
False Signals in Ranges: Consolidating markets can generate unreliable signals.
Lagging Indicator: Being based on moving averages, it may react late to sudden price movements.
🔸Advantages:
Trend Focused: Simplifies the identification of trending markets.
Noise Reduction: Uses Heikin Ashi candles to identify trend continuation after pullbacks.
Broad Applicability: Suitable for forex, crypto, stocks, and commodities.
🔸The strategy provides a systematic way to analyze markets but does not guarantee successful outcomes. Use it as an additional tool rather than relying solely on an automated system.
Trading results depend on various factors, including market conditions, trader discipline, and risk management. Past performance does not ensure future success, so always approach the market cautiously.
🔸Risk Management: Define stop-loss levels, position sizes, and profit targets before entering any trade. Be prepared for potential losses and ensure your approach aligns with your overall trading plan.
🔷 STRATEGY PROPERTIES
Symbol: BINANCE:BTCUSDT (Spot).
Timeframe: 4h.
Test Period: All historical data available.
Initial Capital: 10000 USDT.
Order Size per Trade: 1% of Capital, you can use a higher value e.g. 5%, be cautious that the Max Drawdown does not exceed 10%, as it would indicate a very risky trading approach.
Commission: Binance commission 0.1%, adjust according to the exchange being used, lower numbers will generate unrealistic results. By using low values e.g. 5%, it allows us to adapt over time and check the functioning of the strategy.
Slippage: 5 ticks, for pairs with low liquidity or very large orders, this number should be increased as the order may not be filled at the desired level.
Margin for Long and Short Positions: 100%.
Indicator Settings: Default Configuration.
MA1 Length: 9.
MA2 Length: 18.
MA Calculations: EMA.
Take Profit Ratio: Disable. Ratio 1:4.
Breakeven Ratio: Enable, Ratio 1:1.
Strategy: Long & Short.
🔷 STRATEGY RESULTS
⚠️Remember, past results do not guarantee future performance.
Net Profit: +324.88 USDT (+3.25%).
Max Drawdown: -81.18 USDT (-0.78%).
Total Closed Trades: 672.
Percent Profitable: 35.57%.
Profit Factor: 1.347.
Average Trade: +0.48 USDT (+0.48%).
Average # Bars in Trades: 13.
🔷 HOW TO USE
🔸 Adjust Settings:
The default values—MA1 (9) and MA2 (18) with EMA calculation—generally work well. However, you can increase these values, such as 20 and 40, to better identify stronger trends.
🔸 Choose a Symbol that Typically Trends:
Select an asset that tends to form clear trends. Keep in mind that the Strategy Tester results may show poor performance for certain assets, making them less suitable for sending signals to bots.
🔸 Experiment with Ratios:
Test different take profit and breakeven ratios to compare various scenarios—especially to observe how the strategy performs when only the trade is protected.
🔸This is an example of how protecting the trade works: once the price moves in favor of the position with a 1:1 risk-to-reward ratio, the stop loss is moved to the entry price. If the Slow MA surpasses this level, it will act as a trailing stop, aiming to follow the trend and maximize potential gains.
🔸In contrast, in this example, for the same trade, if we set a take profit at a 1:3 risk-to-reward ratio—which is generally considered a good risk-reward relationship—we can see how a significant portion of the upward move is left on the table.
🔸Results Review:
It is important to check the Max Drawdown. This value should ideally not exceed 10% of your capital. Consider adjusting the trade size to ensure this threshold is not surpassed.
Remember to include the correct values for commission and slippage according to the symbol and exchange where you are conducting the tests. Otherwise, the results will not be realistic.
If you are satisfied with the results, you may consider automating your trades. However, it is strongly recommended to use a small amount of capital or a demo account to test proper execution before committing real funds.
🔸Create alerts to trigger the DCA Bot:
Verify Messages: Ensure the message matches the one specified by the DCA Bot.
Multi-Pair Configuration: For multi-pair setups, enable the option to add the symbol in the correct format.
Signal Settings: Enable whether you want to receive long or short signals (Entry | TP | SL), copy and paste the the messages for the DCA Bots configured.
Alert Setup:
When creating an alert, set the condition to the indicator and choose "alert() function call only.
Enter any desired Alert Name.
Open the Notifications tab, enable Webhook URL, and paste the Webhook URL.
For more details, refer to the section: "How to use TradingView Custom Signals".
Finalize Alerts: Click Create, you're done! Alerts will now be sent automatically in the correct format.
🔷 INDICATOR SETTINGS
MA 1: Fast MA Length
MA 2: Slow MA Length
MA Calc: MA's Calculations (SMA,EMA, RMA,WMA)
TP Ratio: This is the take profit ratio relative to the stop loss, where the trade will be closed in profit.
BE Ratio: This is the breakeven ratio relative to the stop loss, where the stop loss will be updated to breakeven or if the MA2 is greater than this level.
Strategy: Order Type direction in which trades are executed.
Use Custom Test Period: When enabled signals only works in the selected time window. If disabled it will use all historical data available on the chart.
Test Start and End: Once the Custom Test Period is enabled, here you select the start and end date that you want to analyze.
Check Messages: Enable the table to review the messages to be sent to the bot.
Entry | TP | SL: Enable this options to send Buy Entry, Take Profit (TP), and Stop Loss (SL) signals.
Deal Entry and Deal Exit : Copy and paste the message for the deal start signal and close order at Market Price of the DCA Bot. This is the message that will be sent with the alert to the Bot, you must verify that it is the same as the bot so that it can process properly so that it executes and starts the trade.
DCA Bot Multi-Pair: You must activate it if you want to use the signals in a DCA Bot Multi-pair in the text box you must enter (using the correct format) the symbol in which you are creating the alert, you can check the format of each symbol when you create the bot.
👨🏻💻💭 We hope this tool helps enhance your trading. Your feedback is invaluable, so feel free to share any suggestions for improvements or new features you'd like to see implemented.
__
The information and publications within the 3Commas TradingView account are not meant to be and do not constitute financial, investment, trading, or other types of advice or recommendations supplied or endorsed by 3Commas and any of the parties acting on behalf of 3Commas, including its employees, contractors, ambassadors, etc.

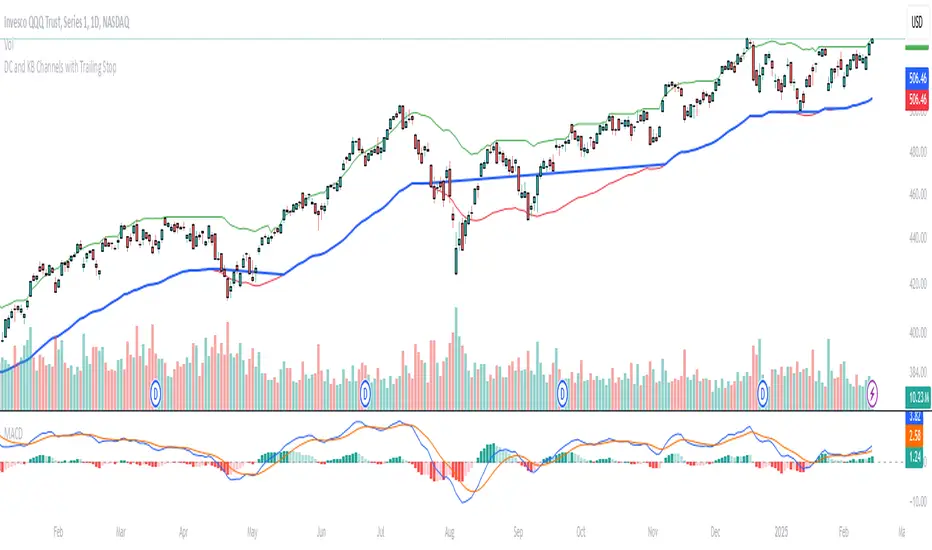
Donchian and Keltner Channels Trend Following with Trailing StopLong Only Trend-following model based on Keltner Channels and Donchian Channels.
These indicators include a noise region, which allows prices to oscillate without requiring position adjustments.
When price trades above the upper band, it signals strength; when it trades below the lower band, it signals weakness.
Keltner Channels
Keltner Channels are volatility-based envelopes set above and below an exponential moving average. Keltner Channels use the Average True Range (ATR), which measures daily volatility, to set channel distance.
Donchian Channel
Donchian Channels are are used to identify market trends and volatility. The upper and lower bands are based on the highest high and lowest low of a specified period. When the price moves above the upper band, it indicates a bullish breakout, while a
move below the lower band indicates a bearish breakout. The distance between the upper and lower channel of the Donchian Channel indicates the asset’s volatility.
Trend Following Model
The default settings are:
Upper Keltner and Upper Donchian Channel Length : 20
Lower Keltner and Lower Donchian Channel Length : 40
Keltner ATR Multiplier: 2
Entries, Exits and Trailing Stop
Entry : When price exceeds the upper band of at least one of these indicators.
Exit : When price undercuts the lower band of at least one of these indicators.
Trailing Stop : See below.
Trailing Stop
This is a stop-loss order that moves with the price of the underlying. It is designed to “trail” the price up (in the case of a long position) or down (for a short position), locking in profits as the price moves in a favorable direction.
At the end of day t, there was a Trailing Stop level in place. For the next day (day t + 1), the Trailing Stop will be adjusted. The new Trailing Stop will be the higher of two values:
The Trailing Stop from the previous day (day t).
The Lower Band computed at the end of day t + 1.
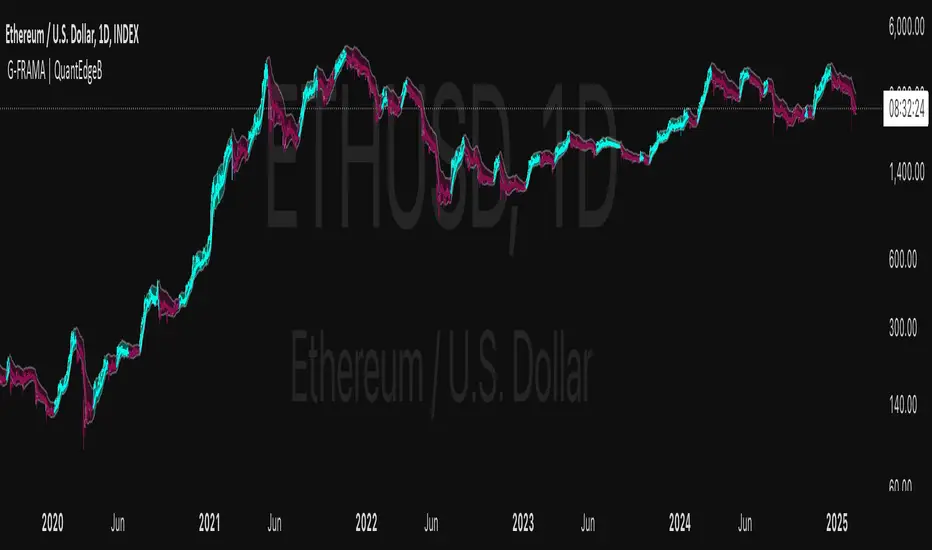
G-FRAMA | QuantEdgeBIntroducing G-FRAMA by QuantEdgeB
Overview
The Gaussian FRAMA (G-FRAMA) is an adaptive trend-following indicator that leverages the power of Fractal Adaptive Moving Averages (FRAMA), enhanced with a Gaussian filter for noise reduction and an ATR-based dynamic band for trade signal confirmation. This combination results in a highly responsive moving average that adapts to market volatility while filtering out insignificant price movements.
_____
1. Key Features
- 📈 Gaussian Smoothing – Utilizes a Gaussian filter to refine price input, reducing short-term noise while maintaining responsiveness.
- 📊 Fractal Adaptive Moving Average (FRAMA) – A self-adjusting moving average that adapts its sensitivity to market trends.
- 📉 ATR-Based Volatility Bands – Dynamic upper and lower bands based on the Average True Range (ATR), improving signal reliability.
- ⚡ Adaptive Trend Signals – Automatically detects shifts in market structure by evaluating price in relation to FRAMA and its ATR bands.
_____
2. How It Works
- Gaussian Filtering
The Gaussian function preprocesses the price data, giving more weight to recent values and smoothing fluctuations. This reduces whipsaws and allows the FRAMA calculation to focus on meaningful trend developments.
- Fractal Adaptive Moving Average (FRAMA)
Unlike traditional moving averages, FRAMA uses fractal dimension calculations to adjust its smoothing factor dynamically. In trending markets, it reacts faster, while in sideways conditions, it reduces sensitivity, filtering out noise.
- ATR-Based Volatility Bands
ATR is applied to determine upper and lower thresholds around FRAMA:
- 🔹 Long Condition: Price closes above FRAMA + ATR*Multiplier
- 🔻 Short Condition: Price closes below FRAMA - ATR
This setup ensures entries are volatility-adjusted, preventing premature exits or false signals in choppy conditions.
_____
3. Use Cases
✔ Adaptive Trend Trading – Automatically adjusts to different market conditions, making it ideal for both short-term and long-term traders.
✔ Noise-Filtered Entries – Gaussian smoothing prevents false breakouts, allowing for cleaner entries.
✔ Breakout & Volatility Strategies – The ATR bands confirm valid price movements, reducing false signals.
✔ Smooth but Aggressive Shorts – While the indicator is smooth in overall trend detection, it reacts aggressively to downside moves, making it well-suited for traders focusing on short opportunities.
_____
4. Customization Options
- Gaussian Filter Settings – Adjust length & sigma to fine-tune the smoothness of the input price. (Default: Gaussian length = 4, Gaussian sigma = 2.0, Gaussian source = close)
- FRAMA Length & Limits – Modify how quickly FRAMA reacts to price changes.(Default: Base FRAMA = 20, Upper FRAMA Limit = 8, Lower FRAMA Limit = 40)
- ATR Multiplier – Control how wide the volatility bands are for long/short entries.(Default: ATR Length = 14, ATR Multiplier = 1.9)
- Color Themes – Multiple visual styles to match different trading environments.
_____
Conclusion
The G-FRAMA is an intelligent trend-following tool that combines the adaptability of FRAMA with the precision of Gaussian filtering and volatility-based confirmation. It is versatile across different timeframes and asset classes, offering traders an edge in trend detection and trade execution.
____
🔹 Disclaimer: Past performance is not indicative of future results. No trading strategy can guarantee success in financial markets.
🔹 Strategic Advice: Always backtest, optimize, and align parameters with your trading objectives and risk tolerance before live trading.
Adaptive Supply and Demand [EdgeTerminal]Adaptive Supply and Demand is a dynamic supply and demand indicator with a few unique twists. It considers volume pressure, volatility-based adjustments and multi-time frame momentum for confidence scoring (multi-step confirmation) to generate dynamic lines that adjust based on the market and also to generate dynamic support/resistance levels for the supply and demand lines.
The dynamic support and resistance lines shown gives you a better situational awareness of the current state of the market and add more context to why the market is moving into a certain direction.
> Trading Scenarios
When the confidence score is over 80%, strong volume pressure in trend direction (up or down), volatility is low and momentum is aligned across timeframes, there is an indication of a strong upward or downward trend.
When the supply and demand line crossover, the confidence score is over 75% and the volume pressure is shifting, this can be an indicator of trend reversal. Use tight initial stops, scale into position as trend develops, monitor the volume pressure for continuation and wait for confidence confirmation.
When the confiance score is below 60%, the volume pressure is choppy, volatility is high, you want to avoid trading or reduce position size, wait for confidence improvements, use support and resistance for entries/exits and use tighter stops due to market conditions. This is an indication of a ranging market.
Another scenario is when there is a sudden volume pressure increase, and a raising confidence score, the volatility is expanding and the bar momentum is aligning the volatility direction. This can indicate a breakout scenario.
> How it Works
1. Volume Pressure Analysis
Volume Pressure Analysis is a key component that measures the true buying and selling force in the market. Here's a detailed breakdown. The idea is to standardize volume to prevent large spikes from skewing results.
The indicator employs an adaptive volume normalization technique to detect genuine buying and selling pressure.
It takes current volume and divides it by average volume.
If normVol > 1: Current volume is above average
If normVol < 1: Current volume is below average
An example if this would be If current volume is 1500 and average is 1000, normVol = 1.5 (50% above average)
Another component of the volume pressure analysis is the Price Change Calculation sub-module. The purpose of this is to measure price movement relative to recent average.
It works by subtracting the average price from the current price. If the value is positive, price is average and if negative, price is below average.
Finally, the volume pressure is calculated to combine volume and price for true pressure reading.
2. Savitzky-Golay Filtering
SG filtering implements advanced signal smoothing while preserving important trend features. It uses weighted moving average approximation, preserves higher moments of data and reduces noise while maintaining signal integrity.
This results in smoother signal lines, reduced false crossovers and better trend identification. Traditional moving averages tend to lag and smooth out important features. Additionally, simple moving averages can miss critical turning points and regular smoothing can delay signal generation.
SG filtering preserves higher moments such as peaks, valleys and trends, reduces noise while maintaining signal sharpness.
It works by creating a symmetric weighting scheme. This way center points get the highest weights while edge points get the lowest weight.
3. Parkinson's Volatility
Parkinson's Volatility is an advanced volatility measurement formula using high-low range data. It uses high-low range for volatility calculation, incorporates logarithmic returns and annualized the volatility measure.
This results in more accurate volatility measurement, better risk assessment and dynamic signal sensitivity.
4. Multi-timeframe Momentum
This combines signals from each module for each timeframe to calculate momentum across three timeframes. It also applies weighted importance to each timeframe and generates a composite momentum signal.
This results in a more comprehensive trend analysis, reduced timeframe bias and better trend confirmation.
> Indicator Settings
Short-term Period:
Lower values makes it more sensitive, meaning it will generate more signals. Higher values makes it less sensitive, resulting in fewer signals. We recommend a 5 to 15 range for day trading, and 10 to 20 for swing trading
Medium-term Period:
Lower values result in faster trend confirmation and higher values show slower and more reliable confirmation. We recommend a range of 15-25 for day trading and 20-30 for swing trading.
Long-term Period:
Lower values makes it more responsive to trend changes and higher values are better for major trend identification. We recommend a range of 40-60 for day trading and 50-100 for swing trading.
Volume Analysis Window:
Lower values result in more sensitivity to volume changes and higher values result in smoother volume analysis. The optimal range is 15-25 for most trading styles.
Confidence Threshold:
Lower values generate more signals but quality decreases. Higher values generate fewer signals but accuracy increases.The optimal range is 0.65-0.8 for most trading conditions.

Auto-Length Moving Average + Trend Signals (Zeiierman)█ Overview
The Auto-Length Moving Average + Trend Signals (Zeiierman) is an easy-to-use indicator designed to help traders dynamically adjust their moving average length based on market conditions. This tool adapts in real-time, expanding and contracting the moving average based on trend strength and momentum shifts.
The indicator smooths out price fluctuations by modifying its length while ensuring responsiveness to new trends. In addition to its adaptive length algorithm, it incorporates trend confirmation signals, helping traders identify potential trend reversals and continuations with greater confidence.
This indicator suits scalpers, swing traders, and trend-following investors who want a self-adjusting moving average that adapts to volatility, momentum, and price action dynamics.
█ How It Works
⚪ Dynamic Moving Average Length
The core feature of this indicator is its ability to automatically adjust the length of the moving average based on trend persistence and market conditions:
Expands in strong trends to reduce noise.
Contracts in choppy or reversing markets for faster reaction.
This allows for a more accurate moving average that aligns with current price dynamics.
⚪ Trend Confirmation & Signals
The indicator includes built-in trend detection logic, classifying trends based on market structure. It evaluates trend strength based on consecutive bars and smooths out transitions between bullish, bearish, and neutral conditions.
Uptrend: Price is persistently above the adjusted moving average.
Downtrend: Price remains below the adjusted moving average.
Neutral: Price fluctuates around the moving average, indicating possible consolidation.
⚪ Adaptive Trend Smoothing
A smoothing factor is applied to enhance trend readability while minimizing excessive lag. This balances reactivity with stability, making it easier to follow longer-term trends while avoiding false signals.
█ How to Use
⚪ Trend Identification
Bullish Trend: The indicator confirms an uptrend when the price consistently stays above the dynamically adjusted moving average.
Bearish Trend: A downtrend is recognized when the price remains below the moving average.
⚪ Trade Entry & Exit
Enter long when the dynamic moving average is green and a trend signal occurs. Exit when the price crosses below the dynamic moving average.
Enter short when the dynamic moving average is red and a trend signal occurs. Exit when the price crosses above the dynamic moving average.
█ Slope-Based Reset
This mode resets the trend counter when the moving average slope changes direction.
⚪ Interpretation & Insights
Best for trend-following traders who want to filter out noise and only reset when a clear shift in momentum occurs.
Higher slope length (N): More stable trends, fewer resets.
Lower slope length (N): More reactive to small price swings, frequent resets.
Useful in swing trading to track significant trend reversals.
█ RSI-Based Reset
The counter resets when the Relative Strength Index (RSI) crosses predefined overbought or oversold levels.
⚪ Interpretation & Insights
Best for reversal traders who look for extreme overbought/oversold conditions.
High RSI threshold (e.g., 80/20): Fewer resets, only extreme conditions trigger adjustments.
Lower RSI threshold (e.g., 60/40): More frequent resets, detecting smaller corrections.
Great for detecting exhaustion in trends before potential reversals.
█ Volume-Based Reset
A reset occurs when current volume significantly exceeds its moving average, signaling a shift in market participation.
⚪ Interpretation & Insights
Best for traders who follow institutional activity (high volume often means large players are active).
Higher volume SMA length: More stable trends, only resets on massive volume spikes.
Lower volume SMA length: More reactive to short-term volume shifts.
Useful in identifying breakout conditions and trend acceleration points.
█ Bollinger Band-Based Reset
A reset occurs when price closes above the upper Bollinger Band or below the lower Bollinger Band, signaling potential overextension.
⚪ Interpretation & Insights
Best for traders looking for volatility-based trend shifts.
Higher Bollinger Band multiplier (k = 2.5+): Captures only major price extremes.
Lower Bollinger Band multiplier (k = 1.5): Resets on moderate volatility changes.
Useful for detecting overextensions in strong trends before potential retracements.
█ MACD-Based Reset
A reset occurs when the MACD line crosses the signal line, indicating a momentum shift.
⚪ Interpretation & Insights
Best for momentum traders looking for trend continuation vs. exhaustion signals.
Longer MACD lengths (260, 120, 90): Captures major trend shifts.
Shorter MACD lengths (10, 5, 3): Reacts quickly to momentum changes.
Useful for detecting strong divergences and market shifts.
█ Stochastic-Based Reset
A reset occurs when Stochastic %K crosses overbought or oversold levels.
⚪ Interpretation & Insights
Best for short-term traders looking for fast momentum shifts.
Longer Stochastic length: Filters out false signals.
Shorter Stochastic length: Captures quick intraday shifts.
█ CCI-Based Reset
A reset occurs when the Commodity Channel Index (CCI) crosses predefined overbought or oversold levels. The CCI measures the price deviation from its statistical mean, making it a useful tool for detecting overextensions in price action.
⚪ Interpretation & Insights
Best for cycle traders who aim to identify overextended price deviations in trending or ranging markets.
Higher CCI threshold (e.g., ±200): Detects extreme overbought/oversold conditions before reversals.
Lower CCI threshold (e.g., ±10): More sensitive to trend shifts, useful for early signal detection.
Ideal for detecting momentum shifts before price reverts to its mean or continues trending strongly.
█ Momentum-Based Reset
A reset occurs when Momentum (Rate of Change) crosses zero, indicating a potential shift in price direction.
⚪ Interpretation & Insights
Best for trend-following traders who want to track acceleration vs. deceleration.
Higher momentum length: Captures longer-term shifts.
Lower momentum length: More responsive to short-term trend changes.
█ How to Interpret the Trend Strength Table
The Trend Strength Table provides valuable insights into the current market conditions by tracking how the dynamic moving average is adjusting based on trend persistence. Each metric in the table plays a role in understanding the strength, longevity, and stability of a trend.
⚪ Counter Value
Represents the current length of trend persistence before a reset occurs.
The higher the counter, the longer the current trend has been in place without resetting.
When this value reaches the Counter Break Threshold, the moving average resets and contracts to become more reactive.
Example:
A low counter value (e.g., 10) suggests a recent trend reset, meaning the market might be changing directions frequently.
A high counter value (e.g., 495) means the trend has been ongoing for a long time, indicating strong trend persistence.
⚪ Trend Strength
Measures how strong the current trend is based on the trend confirmation logic.
Higher values indicate stronger trends, while lower values suggest weaker trends or consolidations.
This value is dynamic and updates based on price action.
Example:
Trend Strength of 760 → Indicates a high-confidence trend.
Trend Strength of 50 → Suggests weak price action, possibly a choppy market.
⚪ Highest Trend Score
Tracks the strongest trend score recorded during the session.
Helps traders identify the most dominant trend observed in the timeframe.
This metric is useful for analyzing historical trend strength and comparing it with current conditions.
Example:
Highest Trend Score = 760 → Suggests that at some point, there was a strong trend in play.
If the current trend strength is much lower than this value, it could indicate trend exhaustion.
⚪ Average Trend Score
This is a rolling average of trend strength across the session.
Provides a bigger picture of how the trend strength fluctuates over time.
If the average trend score is high, the market has had persistent trends.
If it's low, the market may have been choppy or sideways.
Example:
Average Trend Score of 147 vs. Current Trend Strength of 760 → Indicates that the current trend is significantly stronger than the historical average, meaning a breakout might be occurring.
Average Trend Score of 700+ → Suggests a strong trending market overall.
█ Settings
⚪ Dynamic MA Controls
Base MA Length – Sets the starting length of the moving average before dynamic adjustments.
Max Dynamic Length – Defines the upper limit for how much the moving average can expand.
Trend Confirmation Length – The number of bars required to validate an uptrend or downtrend.
⚪ Reset & Adaptive Conditions
Reset Condition Type – Choose what triggers the moving average reset (Slope, RSI, Volume, MACD, etc.).
Trend Smoothing Factor – Adjusts how smoothly the moving average responds to price changes.
-----------------
Disclaimer
The content provided in my scripts, indicators, ideas, algorithms, and systems is for educational and informational purposes only. It does not constitute financial advice, investment recommendations, or a solicitation to buy or sell any financial instruments. I will not accept liability for any loss or damage, including without limitation any loss of profit, which may arise directly or indirectly from the use of or reliance on such information.
All investments involve risk, and the past performance of a security, industry, sector, market, financial product, trading strategy, backtest, or individual's trading does not guarantee future results or returns. Investors are fully responsible for any investment decisions they make. Such decisions should be based solely on an evaluation of their financial circumstances, investment objectives, risk tolerance, and liquidity needs.

Hyper MA Loop | QuantEdgeBIntroducing Hyper MA Loop by QuantEdgeB
Hyper MA Loop | QuantEdgeB is an advanced trend-following indicator that leverages a custom Hyper Moving Average (HyMA) and an innovative loop-based scoring system to assess trend strength and direction. This tool is designed to provide a dynamic perspective on market momentum, allowing traders to capture trends effectively while filtering out market noise.
Key Features:
1. Hyper Moving Average (HyMA) 🟣
- A weighted moving average that enhances trend responsiveness by applying a custom
weight function.
- Ensures smoother trend detection while maintaining reactivity to price changes.
2. Loop-Based Trend Scoring 🔄
- Utilizes a for-loop function to analyze the movement of HyMA over a specified period.
- Compares current values to past values, generating a cumulative score indicating bullish or
bearish momentum.
- Dynamic thresholds adjust to market conditions for better trend filtering.
3. Threshold-Based Signal System ✅❌
- Long Signals: Triggered when the loop score exceeds the long threshold.
- Short Signals: Activated when the score falls below the short threshold.
- Avoids false signals by requiring sustained strength before confirming a trend.
4. Customizable Visualization & Colors 🎨
- Multiple color modes (Default, Solar, Warm, Cool, Classic) for tailored aesthetics.
- Extra plot options enhance visualization of market structure and volatility.
________
How It Works:
- HyMA Calculation : A unique moving average with a specialized weighting function to
smooth out price action.
- Loop Function : Iterates over past HyMA values, assessing whether price is consistently
higher or lower.
- Threshold Comparison : The loop score is compared against pre-set thresholds to
determine bullish or bearish conditions.
- Signal Generation :
1. Bullish (🔵): If the score crosses the long threshold
2. Bearish (🔴): If the score drops below the short threshold.
- Plotting & Styling : Dynamic candles and gradient overlays provide an intuitive
visualization of rend shifts.
________
Use Cases:
✅ Ideal for trend-following traders looking for solid trends confirmation.
✅ Helps filter out choppy market conditions by adjusting sensitivity dynamically.
✅ Works well with other indicators (e.g., ADX, volume-based filters) for added confirmation.
✅ Suitable for both short-term and long-term trend analysis.
________
Customization Options:
- Adjustable HyMA Length: Modify the responsiveness of the moving average. Default se to 2.
- For-Loop Parameters: Fine-tune how far back the trend analysis should consider. Default se to Start = 1 , End = -1.
- Thresholds for Long & Short: Control signal sensitivity to market fluctuations. Default set to Long = 40, Short = 8.
- Color Modes & Extra Plots: Personalize visualization for better clarity.
________
Conclusion:
The Hyper MA Loop | QuantEdgeB is a powerful, adaptive indicator that combines custom moving averages with loop-based trend analysis to deliver accurate, visually intuitive market signals. Whether you're looking to ride strong trends or filter out weak setups, this tool provides the precision and flexibility needed for effective decision-making. 🚀📈
🔹 Disclaimer: Past performance is not indicative of future results. No trading indicator can guarantee success in financial markets.
🔹 Strategic Consideration: As always, backtesting and strategic adjustments are essential to fully optimize this indicator for real-world trading. Traders should consider risk management practices and adapt settings to their specific market conditions and trading style.
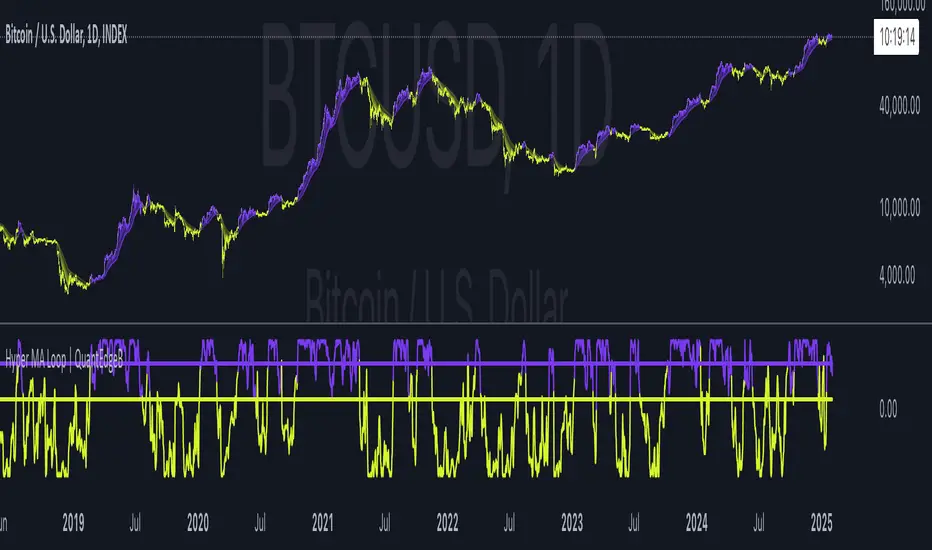
Multi Stochastic AlertHello Everyone,
I have created a Multi Stochastic Alert based on Scalping Strategy
The Strategy uses below 4 Stochastic indicator:
1. Stochastic (9,3)
2. Stochastic (14,3)
3. Stochastic (40,4)
4. Stochastic (60,10)
Trade entry become active when all of these goes below 20 or above 80, In this indicator you don't need to use all 4, this will show red and green background whenever all of them goes below 20 or above 80.
As shown in picture below, it works better when script is making a channel, Our indicator shows green or red signal, we wait for RSI Divergence and we enter. We book when blue line (9,3) goes above 80, as shown by arrow, and trail rest at breakeven or your own trailing method
Same Situation shown for Short side. We book 50% when Blue line (9,3) Goes below 20 and trail rest at breakeven or your own trailing method
Happy trading, Let me know if any improvements required.

Scalping trading system based on 4 ema linesScalping Trading System Based on 4 EMA Lines
Overview:
This is a scalping trading strategy built on signals from 4 EMA moving averages: EMA(8), EMA(12), EMA(24) and EMA(72).
Conditions:
- Time frame: H1 (1 hour).
- Trading assets: Applicable to major currency pairs with high volatility
- Risk management: Use a maximum of 1-2% of capital for each transaction. The order holding time can be from a few hours to a few days, depending on the price fluctuation amplitude.
Trading rules:
Determine the main trend:
Uptrend: EMA(8), EMA(12) and EMA(24) are above EMA(72).
Downtrend: EMA(8), EMA(12) and EMA(24) are below EMA(72).
Trade in the direction of the main trend** (buy in an uptrend and sell in a downtrend).
Entry conditions:
- Only trade in a clearly trending market.
Uptrend:
- Wait for the price to correct to the EMA(24).
- Enter a buy order when the price closes above the EMA(24).
- Place a stop loss below the bottom of the EMA(24) candle that has just been swept.
Downtrend:
- Wait for the price to correct to the EMA(24).
- Enter a sell order when the price closes below the EMA(24).
- Place a stop loss above the top of the EMA(24) candle that has just been swept.
Take profit and order management:
- Take profit when the price moves 20 to 40 pips in the direction of the trade.
Use Trailing Stop to optimize profits instead of setting a fixed Take Profit.
Note:
- Do not trade within 30 minutes before and after the announcement of important economic news, as the price may fluctuate abnormally.
Additional filters:
To increase the success rate and reduce noise, this strategy uses additional conditions:
1. The price is calculated only when the candle closes (no repaint).
2. When sweeping through EMA(24), the price needs to close above EMA(24).
3. The closing price must be higher than 50% of the candle's length.
4. **The bottom of the candle sweeping through EMA(24) must be lower than the bottom of the previous candle (liquidity sweep).
---
Alert function:
When the EMA(24) sweep conditions are met, the system will trigger an alert if you have set it up.
- Entry point: The closing price of the candle sweeping through EMA(24).
- Stop Loss:
- Buy Order: Place at the bottom of the sweep candle.
- Sell Order: Place at the top of the sweep candle.
---
Note:
This strategy is designed to help traders identify profitable trading opportunities based on trends. However, no strategy is 100% guaranteed to be successful. Please test it thoroughly on a demo account before using it.
Dynamic Ticks Oscillator Model (DTOM)The Dynamic Ticks Oscillator Model (DTOM) is a systematic trading approach grounded in momentum and volatility analysis, designed to exploit behavioral inefficiencies in the equity markets. It focuses on the NYSE Down Ticks, a metric reflecting the cumulative number of stocks trading at a lower price than their previous trade. As a proxy for market sentiment and selling pressure, this indicator is particularly useful in identifying shifts in investor behavior during periods of heightened uncertainty or volatility (Jegadeesh & Titman, 1993).
Theoretical Basis
The DTOM builds on established principles of momentum and mean reversion in financial markets. Momentum strategies, which seek to capitalize on the persistence of price trends, have been shown to deliver significant returns in various asset classes (Carhart, 1997). However, these strategies are also susceptible to periods of drawdown due to sudden reversals. By incorporating volatility as a dynamic component, DTOM adapts to changing market conditions, addressing one of the primary challenges of traditional momentum models (Barroso & Santa-Clara, 2015).
Sentiment and Volatility as Core Drivers
The NYSE Down Ticks serve as a proxy for short-term negative sentiment. Sudden increases in Down Ticks often signal panic-driven selling, creating potential opportunities for mean reversion. Behavioral finance studies suggest that investor overreaction to negative news can lead to temporary mispricings, which systematic strategies can exploit (De Bondt & Thaler, 1985). By incorporating a rate-of-change (ROC) oscillator into the model, DTOM tracks the momentum of Down Ticks over a specified lookback period, identifying periods of extreme sentiment.
In addition, the strategy dynamically adjusts entry and exit thresholds based on recent volatility. Research indicates that incorporating volatility into momentum strategies can enhance risk-adjusted returns by improving adaptability to market conditions (Moskowitz, Ooi, & Pedersen, 2012). DTOM uses standard deviations of the ROC as a measure of volatility, allowing thresholds to contract during calm markets and expand during turbulent ones. This approach helps mitigate false signals and aligns with findings that volatility scaling can improve strategy robustness (Barroso & Santa-Clara, 2015).
Practical Implications
The DTOM framework is particularly well-suited for systematic traders seeking to exploit behavioral inefficiencies while maintaining adaptability to varying market environments. By leveraging sentiment metrics such as the NYSE Down Ticks and combining them with a volatility-adjusted momentum oscillator, the strategy addresses key limitations of traditional trend-following models, such as their lagging nature and susceptibility to reversals in volatile conditions.
References
• Barroso, P., & Santa-Clara, P. (2015). Momentum Has Its Moments. Journal of Financial Economics, 116(1), 111–120.
• Carhart, M. M. (1997). On Persistence in Mutual Fund Performance. The Journal of Finance, 52(1), 57–82.
• De Bondt, W. F., & Thaler, R. (1985). Does the Stock Market Overreact? The Journal of Finance, 40(3), 793–805.
• Jegadeesh, N., & Titman, S. (1993). Returns to Buying Winners and Selling Losers: Implications for Stock Market Efficiency. The Journal of Finance, 48(1), 65–91.
• Moskowitz, T. J., Ooi, Y. H., & Pedersen, L. H. (2012). Time Series Momentum. Journal of Financial Economics, 104(2), 228–250.

PDF MA For Loop [BackQuant]PDF MA For Loop
Introducing the PDF MA For Loop, an innovative trading indicator that combines Probability Density Function (PDF) smoothing with a dynamic for-loop scoring mechanism. This advanced tool provides traders with precise trend-following signals, helping to identify long and short opportunities with improved clarity and adaptability to market conditions.
If you would like to check out the stand alone PDF Moving Average:
Core Concept: Probability Density Function (PDF) Smoothing
The PDF smoothing method is a unique approach that applies adaptive weights to price data based on a Probability Density Function. This ensures that recent data points receive appropriate emphasis while maintaining a smooth transition across the data set. The result is a moving average that is not only smoother but also more responsive to market changes.
Key parameters in PDF smoothing:
Variance : Controls the spread of the PDF, where a higher value results in broader smoothing and a lower value makes the moving average more sensitive.
Mean : Centers the PDF around a specific value, influencing the weighting and responsiveness of the smoothing process.
By combining PDF smoothing with traditional moving averages (EMA or SMA), the indicator creates a hybrid signal that balances responsiveness and reliability.
For-Loop Scoring Mechanism
At the heart of this indicator is the for-loop scoring mechanism, which evaluates the smoothed PDF moving average over a defined range of historical data points. This process assigns a score to the current market condition based on whether the PDF moving average is greater than or less than previous values.
Long Signal: A long signal is generated when the score exceeds the Long Threshold (default set at 40), indicating upward momentum.
Short Signal: A short signal is triggered when the score crosses below the Short Threshold (default set at -10), suggesting potential downward momentum.
This dynamic scoring system ensures that the indicator remains adaptive, capturing trends and shifts in market sentiment effectively.
Customization Options
The PDF MA For Loop includes a variety of customizable settings to fit different trading styles and strategies:
Calculation Settings
Price Source : Select the input price for the calculation (default is the close price).
Smoothing Method : Choose between EMA or SMA for the additional smoothing layer, providing flexibility to adapt to market conditions.
Smoothing Period : Adjust the lookback period for the smoothing function, with shorter periods providing more sensitivity and longer periods offering greater stability.
Variance & Mean : Fine-tune the PDF function parameters to control the weighting of the smoothing process.
Signal Settings
Thresholds : Customize the upper and lower thresholds to define the sensitivity of the long and short signals.
For Loop Range : Set the range of historical data points analyzed by the for-loop, influencing the depth of the scoring mechanism.
UI Settings
Signal Line Width: Adjust the thickness of the plotted signal line for better visibility.
Candle Coloring: Enable or disable the coloring of candlesticks based on trend direction (green for long, red for short, gray for neutral).
Background Coloring: Add background shading to highlight long and short signals for an enhanced visual experience.
Alerts and Automation
The indicator includes built-in alert conditions to notify traders of important market events:
Long Signal Alert: Notifies when the score exceeds the upper threshold, indicating a bullish trend.
Short Signal Alert: Notifies when the score crosses below the lower threshold, signaling a bearish trend.
These alerts can be configured for real-time notifications, allowing traders to respond quickly to market changes without constant chart monitoring.
Trading Applications
The PDF MA For Loop is versatile and can be applied across various trading strategies and market conditions:
Trend Following: The PDF smoothing method combined with for-loop scoring makes this indicator particularly effective for identifying and following trends.
Reversal Trading: By observing the thresholds and score, traders can anticipate potential reversals when the trend shifts from long to short (or vice versa).
Risk Management: The dynamic thresholds and scoring provide clear signals, allowing traders to enter and exit trades with greater confidence and precision.
Final Thoughts
The PDF MA For Loopis merges advanced mathematical concepts with practical trading tools. By leveraging Probability Density Function smoothing and a dynamic for-loop scoring system, it provides traders with clear, actionable signals while adapting to market conditions.
Whether you’re looking for an edge in trend-following strategies or seeking precision in identifying reversals, this indicator offers the flexibility and power to enhance your trading decisions
As always, backtesting and integrating the PDF MA For Loop into a comprehensive trading strategy is recommended for optimal performance, as no single indicator should be used in isolation.
Thus following all of the key points here are some sample backtests on the 1D Chart
Disclaimer: Backtests are based off past results, and are not indicative of the future.
INDEX:BTCUSD
INDEX:ETHUSD
BINANCE:SOLUSD
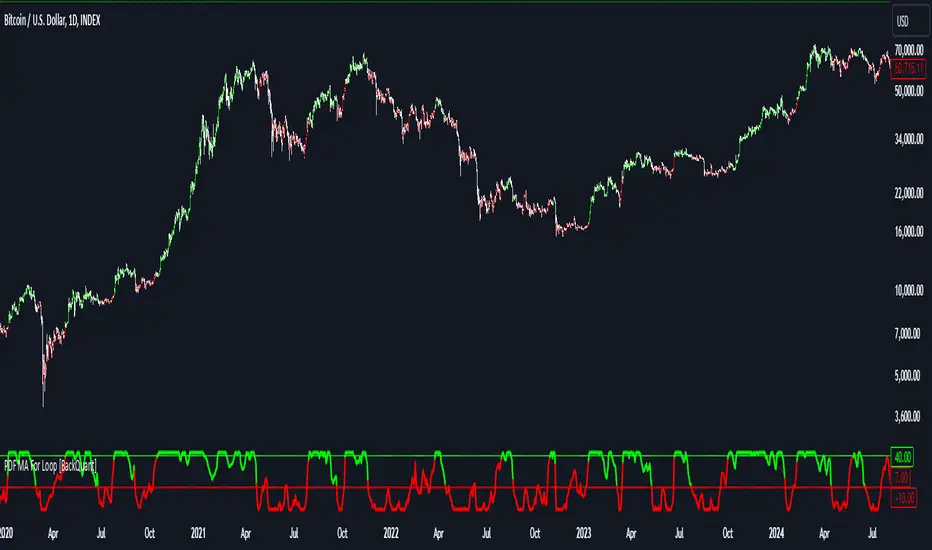
Dynamic S/R Levels: Edge FinderOverview
The Dynamic S/R Levels: Edge Finder indicator is designed to identify dynamic support and resistance levels based on historical price action. It uses a combination of price extremes (highs and lows) over user-defined lookback periods, weighted moving averages (WMAs), and touch-count analysis to provide actionable insights into key market levels.
This tool is ideal for traders who want to:
Identify dynamic support and resistance zones.
Understand the strength of these levels based on price touches.
Make informed decisions using clear, adaptive levels.
How It Works
Dynamic Levels Calculation:
The indicator calculates dynamic support levels using the lowest lows and dynamic resistance levels using the highest highs over user-defined lookback periods (e.g., 20, 40, 60 bars, etc.).
These levels are updated dynamically as new price data becomes available.
Touch Count Analysis:
The indicator counts how many times the price has touched or come close to each support/resistance level within the lookback period.
Levels with more touches are considered stronger and are highlighted accordingly.
Weighted Moving Averages (WMAs):
The indicator uses 50-period and 100-period WMAs to identify the closest support/resistance levels to the current trend.
Levels near these WMAs are given additional weight, as they are more likely to act as significant barriers.
Level Merging:
If two support or resistance levels are too close to each other (based on the minimum distance percentage), the weaker level (with fewer touches) is removed to avoid clutter.
Visualization:
Support levels are displayed as dashed red lines, and resistance levels are displayed as dashed blue lines.
Each level is labeled with its corresponding touch count, allowing traders to quickly assess its strength.
How to Interpret the Indicator
Strong Support/Resistance Levels:
Levels with higher touch counts (e.g., 5, 10, or more) are considered stronger and are more likely to hold in the future.
Use these levels to plan entries, exits, or stop-loss placements.
Proximity to WMAs:
Levels closest to the 50-period or 100-period WMA are more significant, especially in trending markets.
These levels often act as dynamic barriers where price reactions are more likely.
Breakouts and Rejections:
If the price breaks through a strong resistance level, it may indicate a potential bullish trend.
If the price rejects a strong support level, it may indicate a potential bearish trend.
Always confirm breakouts or rejections with additional analysis (e.g., volume, candlestick patterns).
Level Merging:
Merged levels indicate areas of high confluence, where multiple support/resistance zones overlap.
These areas are particularly important for decision-making, as they represent stronger market reactions.
Key Features
Customizable Lookback Periods: Adjust the lookback periods for each dynamic level to suit your trading style.
Touch Count Labels: Quickly identify the strength of each level based on the number of price touches.
Adaptive Levels: The indicator dynamically updates levels based on recent price action.
Clean Visualization: Levels are automatically merged to avoid clutter and provide a clear view of the market structure.
Usage Tips
Trend Identification: Combine the indicator with trend-following tools (e.g., moving averages, trendlines) to confirm the overall market direction.
Risk Management: Use the identified levels to set stop-loss orders or take-profit targets.
Timeframe Flexibility: The indicator works on all timeframes, but it is particularly effective on higher timeframes (e.g., 1H, 4H, Daily) for more reliable levels.
Example Scenarios
Bounce Trade:
If the price approaches a strong support level (high touch count) and shows signs of rejection (e.g., bullish candlestick patterns), consider a long position with a stop-loss below the support level.
Breakout Trade:
If the price breaks above a strong resistance level with high volume, consider a long position with a target at the next resistance level.
Range-Bound Market:
In a sideways market, use the support and resistance levels to identify range boundaries and trade bounces between them.
Disclaimer
Dynamic S/R Levels: Edge Finder is a technical analysis tool designed to identify dynamic support and resistance levels based on historical price action. It is intended for informational and educational purposes only. This indicator does not provide financial, investment, or trading advice. Users are solely responsible for their trading decisions and should conduct their own research and analysis before making any trades. The developer of this tool is not liable for any financial losses or damages resulting from the use of this indicator. Trading in financial markets involves risk, and you should only trade with capital you can afford to lose.
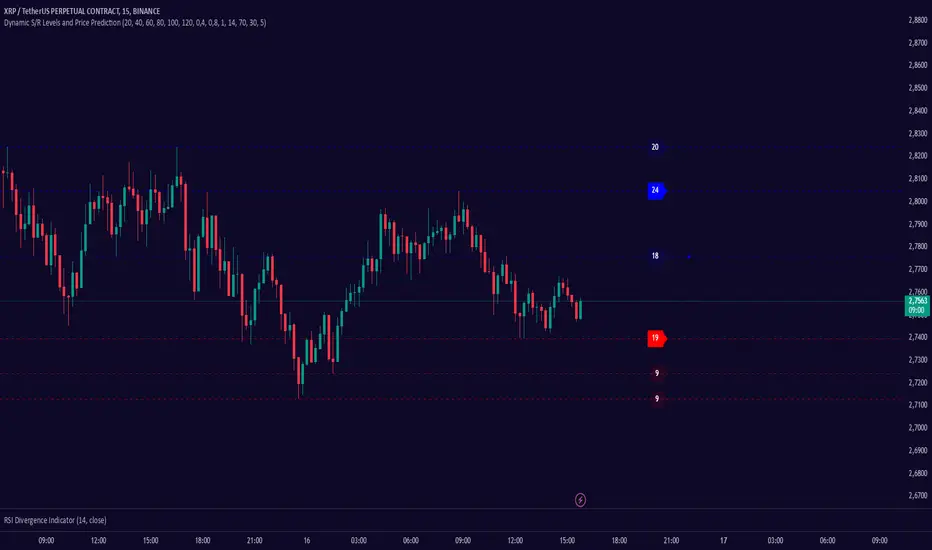
GOLDEN RSI by @thejamiulGOLDEN RSI thejamiul is a versatile Relative Strength Index (RSI)-based tool designed to provide enhanced visualization and additional insights into market trends and potential reversal points. This indicator improves upon the traditional RSI by integrating gradient fills for overbought/oversold zones and divergence detection features, making it an excellent choice for traders who seek precise and actionable signals.
Source of this indicator : This indicator is based on @TradingView original RSI indicator with a little bit of customisation to enhance overbought and oversold identification.
Key Features
1. Customizable RSI Settings:
RSI Length: Adjust the RSI calculation period to suit your trading style (default: 14).
Source Selection: Choose the price source (e.g., close, open, high, low) for RSI calculation.
2. Gradient-Filled RSI Zones:
Overbought Zone (80-100): Gradient fill with shades of green to indicate strong bullish conditions.
Oversold Zone (0-20): Gradient fill with shades of red to highlight strong bearish conditions.
3. Support and Resistance Levels:
Upper Band: 80
Middle Bands: 60 (bullish) and 40 (bearish)
Lower Band: 20
These levels help identify overbought, oversold, and neutral zones.
4. Divergence Detection:
Bullish Divergence: Detects lower lows in price with corresponding higher lows in RSI, signaling potential upward reversals.
Bearish Divergence: Detects higher highs in price with corresponding lower highs in RSI, indicating potential downward reversals.
Visual Indicators:
Bullish divergence is marked with green labels and line plots.
Bearish divergence is marked with red labels and line plots.
5. Alert Functionality:
Custom Alerts: Set up alerts for bullish or bearish divergences to stay notified of potential trading opportunities without constant chart monitoring.
6. Enhanced Chart Visualization:
RSI Plot: A smooth and visually appealing RSI curve.
Color Coding: Gradient and fills for better distinction of trading zones.
Pivot Labels: Clear identification of divergence points on the RSI plot.
