Optimum EMAs x3Function Review
Optimum EMAs x3 scores EMA-price reactions via bullish/bearish percentages. Plots test (purple), bull/bear fast/medium/slow EMAs with toggles/individual colors, three adjustable gradient fills, and reaction table for multi-band analysis.
Usage Write-Up
Set fast (5-15), medium (10-20), slow (15-30) ranges per strategy. Test values via Test EMA for peak scores. Input optima to bull/bear fast/medium/slow for reactive three-band envelope (bullish supports, bearish resistances), refining signals in varied trends.
חפש סקריפטים עבור "父亲把15万藏被子里被儿子误扔"

Optimum EMAs x2Function Review
Optimum EMAs assesses EMA-price interactions by scoring reaction percentages for bullish/bearish touches. Creates EMA bands (top: most reactive bearish EMA as resistance; bottom: most reactive bullish EMA as support) with customizable test/bull/bear fast/slow EMAs, toggles, adjustable colors/gradients, and reaction table.
Usage Write-Up
Define fast (e.g., 5-15) and slow (e.g., 15-30) EMA ranges based on strategy. Scan with Test EMA for high reaction scores. Set optima in Bull/Bear Fast/Slow inputs to form reactive EMA bands (bullish top support, bearish bottom resistance), enhancing trend signals in bull/bear markets.

Squeeze Hour Frequency [CHE]Squeeze Hour Frequency (ATR-PR) — Standalone — Tracks daily squeeze occurrences by hour to reveal time-based volatility patterns
Summary
This indicator identifies periods of unusually low volatility, defined as squeezes, and tallies their frequency across each hour of the day over historical trading sessions. By aggregating counts into a sortable table, it helps users spot hours prone to these conditions, enabling better scheduling of trading activity to avoid or target specific intraday regimes. Signals gain robustness through percentile-based detection that adapts to recent volatility history, differing from fixed-threshold methods by focusing on relative lowness rather than absolute levels, which reduces false positives in varying market environments.
Motivation: Why this design?
Traders often face uneven intraday volatility, with certain hours showing clustered low-activity phases that precede or follow breakouts, leading to mistimed entries or overlooked calm periods. The core idea of hourly squeeze frequency addresses this by binning low-volatility events into 24 hourly slots and counting distinct daily occurrences, providing a historical profile of when squeezes cluster. This reveals time-of-day biases without relying on real-time alerts, allowing proactive adjustments to session focus.
What’s different vs. standard approaches?
- Reference baseline: Classical volatility tools like simple moving average crossovers or fixed ATR thresholds, which flag squeezes uniformly across the day.
- Architecture differences:
- Uses persistent arrays to track one squeeze per hour per day, preventing overcounting within sessions.
- Employs custom sorting on ratio arrays for dynamic table display, prioritizing top or bottom performers.
- Handles timezones explicitly to ensure consistent binning across global assets.
- Practical effect: Charts show a persistent table ranking hours by squeeze share, making intraday patterns immediately visible—such as a top hour capturing over 20 percent of total events—unlike static overlays that ignore temporal distribution, which matters for avoiding low-liquidity traps in crypto or forex.
How it works (technical)
The indicator first computes a rolling volatility measure over a specified lookback period. It then derives a relative ranking of the current value against recent history within a window of bars. A squeeze is flagged when this ranking falls below a user-defined cutoff, indicating the value is among the lowest in the recent sample.
On each bar, the local hour is extracted using the selected timezone. If a squeeze occurs and the bar has price data, the count for that hour increments only if no prior mark exists for the current day, using a persistent array to store the last marked day per hour. This ensures one tally per unique trading day per slot.
At the final bar, arrays compile counts and ratios for all 24 hours, where the ratio represents each hour's share of total squeezes observed. These are sorted ascending or descending based on display mode, and the top or bottom subset populates the table. Background shading highlights live squeezes in red for visual confirmation. Initialization uses zero-filled arrays for counts and negative seeds for day tracking, with state persisting across bars via variable declarations.
No higher timeframe data is pulled, so there is no repaint risk from external fetches; all logic runs on confirmed bars.
Parameter Guide
ATR Length — Controls the lookback for the volatility measure, influencing sensitivity to short-term fluctuations; shorter values increase responsiveness but add noise, longer ones smooth for stability — Default: 14 — Trade-offs/Tips: Use 10-20 for intraday charts to balance quick detection with fewer false squeezes; test on historical data to avoid over-smoothing in trending markets.
Percentile Window (bars) — Sets the history depth for ranking the current volatility value, affecting how "low" is defined relative to past; wider windows emphasize long-term norms — Default: 252 — Trade-offs/Tips: 100-300 bars suit daily cycles; narrower for fast assets like crypto to catch recent regimes, but risks instability in sparse data.
Squeeze threshold (PR < x) — Defines the cutoff for flagging low relative volatility, where values below this mark a squeeze; lower thresholds tighten detection for rarer events — Default: 10.0 — Trade-offs/Tips: 5-15 percent for conservative signals reducing false positives; raise to 20 for more frequent highlights in high-vol environments, monitoring for increased noise.
Timezone — Specifies the reference for hourly binning, ensuring alignment with market sessions — Default: Exchange — Trade-offs/Tips: Set to "America/New_York" for US assets; mismatches can skew counts, so verify against chart timezone.
Show Table — Toggles the results display, essential for reviewing frequencies — Default: true — Trade-offs/Tips: Disable on mobile for performance; pair with position tweaks for clean overlays.
Pos — Places the table on the chart pane — Default: Top Right — Trade-offs/Tips: Bottom Left avoids candle occlusion on volatile charts.
Font — Adjusts text readability in the table — Default: normal — Trade-offs/Tips: Tiny for dense views, large for emphasis on key hours.
Dark — Applies high-contrast colors for visibility — Default: true — Trade-offs/Tips: Toggle false in light themes to prevent washout.
Display — Filters table rows to focus on extremes or full list — Default: All — Trade-offs/Tips: Top 3 for quick scans of risky hours; Bottom 3 highlights safe low-squeeze periods.
Reading & Interpretation
Red background shading appears on bars meeting the squeeze condition, signaling current low relative volatility. The table lists hours as "H0" to "H23", with columns for daily squeeze counts, percentage share of total squeezes (summing to 100 percent across hours), and an arrow marker on the top hour. A summary row above details the peak count, its share, and the leading hour. A label at the last bar recaps total days observed, data-valid days, and top hour stats. Rising shares indicate clustering, suggesting regime persistence in that slot.
Practical Workflows & Combinations
- Trend following: Scan for hours with low squeeze shares to enter during stable regimes; confirm with higher highs or lower lows on the 15-minute chart, avoiding top-share hours post-news like tariff announcements.
- Exits/Stops: Tighten stops in high-share hours to guard against sudden vol spikes; use the table to shift to conservative sizing outside peak squeeze times.
- Multi-asset/Multi-TF: Defaults work across crypto pairs on 5-60 minute timeframes; for stocks, widen percentile window to 500 bars. Combine with volume oscillators—enter only if squeeze count is below average for the asset.
Behavior, Constraints & Performance
Logic executes on closed bars, with live bars updating counts provisionally but finalizing on confirmation; table refreshes only at the last bar, avoiding intrabar flicker. No security calls or higher timeframes, so no repaint from external data. Resources include a 5000-bar history limit, loops up to 24 iterations for sorting and totals, and arrays sized to 24 elements; labels and table are capped at 500 each for efficiency. Known limits: Skips hours without bars (e.g., weekends), assumes uniform data availability, and may undercount in sparse sessions; timezone shifts can alter profiles without warning.
Sensible Defaults & Quick Tuning
Start with ATR Length at 14, Percentile Window at 252, and threshold at 10.0 for broad crypto use. If too many squeezes flag (noisy table), raise threshold to 15.0 and narrow window to 100 for stricter relative lowness. For sluggish detection in calm markets, drop ATR Length to 10 and threshold to 5.0 to capture subtler dips. In high-vol assets, widen window to 500 and threshold to 20.0 for stability.
What this indicator is—and isn’t
This is a historical frequency tracker and visualization layer for intraday volatility patterns, best as a filter in multi-tool setups. It is not a standalone signal generator, predictive model, or risk manager—pair it with price action, news filters, and position sizing rules.
Disclaimer
The content provided, including all code and materials, is strictly for educational and informational purposes only. It is not intended as, and should not be interpreted as, financial advice, a recommendation to buy or sell any financial instrument, or an offer of any financial product or service. All strategies, tools, and examples discussed are provided for illustrative purposes to demonstrate coding techniques and the functionality of Pine Script within a trading context.
Any results from strategies or tools provided are hypothetical, and past performance is not indicative of future results. Trading and investing involve high risk, including the potential loss of principal, and may not be suitable for all individuals. Before making any trading decisions, please consult with a qualified financial professional to understand the risks involved.
By using this script, you acknowledge and agree that any trading decisions are made solely at your discretion and risk.
Do not use this indicator on Heikin-Ashi, Renko, Kagi, Point-and-Figure, or Range charts, as these chart types can produce unrealistic results for signal markers and alerts.
Best regards and happy trading
Chervolino
Thanks to Duyck
for the ma sorter

Multiple Symbol Trend Screener [Pineify]Multiple Symbol Trend Screener Pineify – Ultimate Multi-Indicator Scanner for TradingView
Empower your trading with deep market insights across multiple symbols using this feature-rich Pine Script screener. The Multiple Symbol Trend Screener Pineify enables traders to monitor and compare trends, reversals, and consolidations in real-time across the biggest equity symbols on TradingView, through a synergistic blend of popular technical indicators.
Key Features
Monitor up to 15 symbols and their trends simultaneously
Integrates 7 professional-grade indicators: MA Distance, Aroon, Parabolic SAR (PSAR), ADX, Supertrend, Keltner Channel, and BBTrend
Color-coded table display for instant visual assessment
Customizable lookback periods, indicator types, and calculation methods
SEO optimized for multi-symbol trend detection, screener, and advanced TradingView indicator
How It Works
This indicator leverages TradingView’s Pine Script v6 and request.security() to process multiple symbols across selected timeframes. Data populates a dynamic table, updating each cell based on the calculated value of every underlying indicator. MA Distance highlights deviation from moving averages; Aroon flags emerging trend strength; PSAR marks potential trend reversals; ADX assesses trend momentum; Supertrend detects bullish/bearish phases; Keltner Channel and BBTrend offer volatility and power insights.
Set up your preferred symbols and timeframes
Each indicator runs its calculation per symbol using its parameter group
All results are displayed in a table for a comprehensive dashboard view
Trading Ideas and Insights
Traders can use this screener for cross-market comparison, directional bias, entry/exit filtering, and comprehensive trend evaluation. The screener is excellent for swing trading, day trading, and portfolio tracking. It enables confirmation across multiple frameworks — for example, spotting momentum with ADX before confirming direction with Supertrend and PSAR.
Identify correlated movements or divergences across selected assets
Spot synchronized trend changes for basket trading ideas
Filter symbols by volatility, strength, or trend status for precise trade selection
How Multiple Indicators Work Together
The screener’s edge lies in its intelligent correlation of popular indicators. MA Distance measures the proximity to chosen moving averages, ideal for spotting overbought/oversold conditions. Aroon reveals the strength of new price trends, PSAR indicates reversal signals, and ADX quantifies the momentum of these trends. Supertrend provides a directional phase, while Keltner Channel & BBTrend analyze volatility shifts and band compressions. This amalgamation allows for a robust, multi-dimensional market snapshot, capturing details missed by single-indicator tools.
By displaying all key metrics side-by-side, the screener enables holistic decision-making, revealing confluence zones and contradiction areas across multiple tickers and timeframes.
Unique Aspects
Original implementation combining seven independent trend and momentum indicators for each symbol
Rich customization for symbols, timeframes, and all indicator parameters
Intuitive color-coding for quick reading of bullish/bearish/neutral signals
Comprehensive dashboard for instant actionable insights
How to Use
Load the indicator onto your TradingView chart
Go to the script’s settings and input your preferred symbols and relevant timeframes
Set your desired parameters for each indicator group: Moving Average type, Aroon length, PSAR values, ADX smoothing, etc.
Observe the results in the top-right table, then use it to filter candidates and validate trade setups
The screener is suitable for all timeframes and asset classes available on TradingView. Make sure your chart’s timeframe matches the one used in the scanner for optimal accuracy.
Customization
Choose up to 15 symbols to monitor in a single dashboard
Customize lookback periods, indicator types, colors, and display settings
Configure alerting options and thresholds for advanced trade automation
Conclusion
The Multiple Symbol Trend Screener Pineify sets a new standard for multi-asset screening on TradingView. By elegantly merging seven proven technical indicators, the screener delivers powerful trend detection, reversal analysis, and volatility monitoring — all in one dashboard. Take your trading to new heights with in-depth, customizable market surveillance.

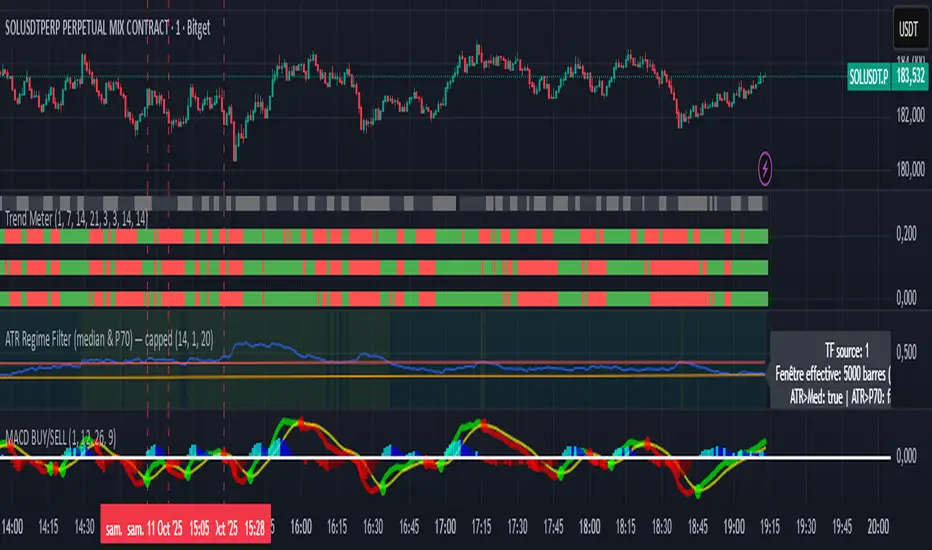
ATR Regime Filter (median & P70)ATR Regime Filter (Median & P70)
Purpose
Filter your signals by the volatility regime. The indicator compares the current ATR to two rolling statistical thresholds—the median (P50) and the 70th percentile (P70)—to avoid trading during quiet phases and prioritize setups when the market “breathes.”
How it works
Computes ATR(14) on a user-defined source timeframe (srcTF) via request.security.
Converts a target window in days (days) into bars of the source TF.
Due to Pine limits, the effective window is capped at 5000 bars (shown in an optional label).
Calculates Median (P50) and P70 of ATR over the effective window.
Exposes two booleans:
ATR > Median (normal-to-elevated volatility)
ATR > P70 (elevated volatility)
Display
Plots: ATR, Median, P70.
Panel background (bgcolor):
light green when ATR > P70
teal when ATR > Median
neutral otherwise
Optional label: shows source TF, effective window size (bars & days), and the boolean states.
Inputs
ATR length (default 14)
TF source ATR (srcTF, e.g., “1”, “5”, “15”)
Target window (days) (days, default 20)
Show label (bool)
Suggested use
Breakout/Momentum: require ATR > P70 in addition to your breakout conditions (close beyond level, volume, retest).
Range/Mean reversion: at minimum require ATR > Median.
In strategies, use ATR > Median/P70 as a filter alongside price structure, volume, and EMAs.
Limitations
On very short source TFs (e.g., 1-min), the window may be clipped to 5000 bars (~3.5 days). Increase srcTF (5m/15m) if you want a true 15–30 day history.
ATR measures magnitude, not direction—combine with trend/structure signals.
1m Scalping ATR (with SL & Zones)A universal ATR indicator that anchors volatility to your stop-loss.
Read any market (FX, JPY pairs, Gold/Silver, indices, crypto) consistently—regardless of pip/point conventions and timeframe.
Why this indicator?
Classic ATR is absolute (pips/points) and feels different across markets/TFs. ATR Takeoff normalizes ATR to your stop-loss in pips and highlights clear zones for “quiet / ideal / too volatile,” so you instantly know if a 10-pip SL fits current conditions.
Key features
Auto pip detection (FX, JPY, XAU/XAG, indices, BTC/ETH).
Selectable ATR source: chart timeframe or fixed ATR TF (e.g., “15”, “30”, “60”).
Display modes:
Percent of SL – ATR relative to SL in %, great for M1 (typical 10–30%).
Multiple of SL – ATR as a multiple of SL (e.g., 0.6× / 1.0× / 1.2×).
Panel zones:
Green = “Ready for takeoff” (≤ Low), Yellow = reference (Mid), Red = too volatile (≥ High).
Status badge (top-right): Quiet / ATR ok / Wild, current ATR/SL value, ATR TF used.
Direction-agnostic: Works the same for longs and shorts.
Inputs (at a glance)
Length / Smoothing (RMA/SMA/EMA/WMA): ATR base settings.
Your Stop-Loss (Pips): Reference SL (e.g., 10).
ATR Timeframe (empty = chart): Use chart TF or a fixed TF.
Display Mode: “Percent of SL” or “Multiple of SL.”
Low/Mid/High (Percent Mode): Zone thresholds in % of SL.
Low/Mid/High (Multiple Mode): Zone thresholds in ×SL.
Recommended defaults
Length 14, Smoothing RMA, SL 10 pips
Display Mode: Percent of SL
Low/Mid/High (%): 15 / 20 / 25
ATR Timeframe: empty (= chart) for reactive, or “30” for smoother M30 context with M1 entries.
How to use
Set SL (pips). 2) Choose display mode. 3) Optionally pick ATR TF.
Interpretation:
≤ Low (green): setups allowed.
≈ Mid (yellow): neutral reference.
≥ High (red): too volatile → adjust SL/size or wait.
Note: Auto-pip relies on common ticker naming; verify on exotic symbols.
Disclaimer: For research/education. Not financial advice.

Zay Gwet AlertEMA 9, VWAP and ORB 15 minutes alert in Burmese. When the market across the EMA 9 will give alert to buy or sell. And when the market across the VWAP and ORB 15 will alert as well. Especially for Burmese community as it is in Burmese language.

50% Fib Trend Cloud + ATR BandsThis indicator plots two structural 50% fibonacci midpoints from recent confirmed 'left/right' swings that form a *cloud* of equilibrium, then adds a rolling 50% fibonacci range midpoint based on a lookback window that's wrapped in ATR bands. Importantly, it solves a specific trading problem:
Structural midpoints (macro context) are powerful but can lag when price escapes prior ranges. Enter rolling 50% fib + ATR ➡️ which restores real-time balance & tolerance (micro context). Together they show where price is balanced structurally, where it’s balanced right now, and how much volatility to tolerate before acting.
➖➖➖
🔑 Why this is different
Most tools either draw a single midpoint (ex., daily 50%) or ATR bands around a moving average. This script fuses dual swing-based 50% midpoints (structure) + a rolling 50% with ATR (flow), so you don’t lose context when price escapes prior ranges. The cloud tells you who’s in control (fast vs. slow structure). The rolling 50% + ATR tells you how far is “too far” now.
➖➖➖
🧠 What it does (at a glance)
🔸Structural Equilibrium × 2 (Fib1/Fib2)
Two independent 50% midpoints formed from swing pivots (configurable Left/Right bars + optional smoothing). Their gap is the Midpoint Cloud = structural “fair value” zone.
🔸Rolling 50% + ATR Bands
A rolling highest/lowest window computes an always-current 50% rolling midpoint plot; ±ATR × length envelopes define a soft value area and over-stretch boundaries.
🔸Actionable Visuals
Optional fill between Fib1/Fib2, labels, and candle-overlay modes to instantly read regime (above both / below both / between).
🔸Smart Defaults
Timeframe-aware presets for L/R pivots & smoothing; full manual overrides available.
➖➖➖
⚙️ Calculations (plain-English)
🔸Pivot midpoints (Fib1 & Fib2):
1) Detect a swing using `Left/Right` bars
2) Take the swing’s high/low → compute 50%
3) (Optional) Smooth the line (SMA) to stabilize on noisy TFs
4) Repeat with a different sensitivity to get two distinct midpoints
🔸Rolling midpoint:
Highest High / Lowest Low over the last *N* bars → (HH + LL) / 2
🔸ATR levels:
`Upper = Rolling50 + ATR × Mult`, `Lower = Rolling50 − ATR × Mult`
(Typical: ATR length 14–21; Multipliers 2.236 for L1, 5.382 for L2)
➖➖➖
🤖 Auto-Configured Presets (with Manual Override)
💡Goal: make the midpoints “just work” on common timeframes while still letting you dial them in.
💡How Auto Presets work
When Auto Presets = ON, the script picks sensible L/R/S (Left bars / Right bars / Smoothing) for Fib Trend 1 and Fib Trend 2 based on chart timeframe.
🔸Fib 1 (fast) emphasizes *micro-structure* for quicker bias shifts.
🔸Fib 2 (slow) emphasizes *macro-structure* for anchor/bias context.
These defaults keep Fib 1 responsive without jitter and Fib 2 stable without lag.
➡️ Turn Auto Presets = OFF to take full control with the manual inputs described below.
➖➖➖
🛠 Manual Fib Midpoint Settings (when Auto = OFF)
💡Each midpoint uses three knobs:
🔸Pivot Left (L): bars to the left that must be lower/higher to qualify a swing
🔸Pivot Right (R): bars to the right that must be lower/higher to confirm the swing
🔸Smoothing (S): SMA period applied to the raw 50% midpoint (stabilizes noise)
5-Minute optimized defaults
🔸Fib Trend 1: `L21 / R5 / S55` → responsive local structure (entries/exits, re-balancing zones)
🔸Fib Trend 2: `L55 / R13 / S89` → broader structure (trend context, anchors/stops)
Timeframe guidance
🔸1m–3m: may feel a touch laggy → consider ~`L13 / R3 / S34`
🔸15m–1h: defaults remain strong → optionally ~`L34 / R8 / S89`
🔸4h+ : increase span for stability → `L89–144 / R13–21 / S144–233`
➡️ Rule of thumb: shorter L/R = faster detection, longer S = smoother line. Tune until Fib 1 captures the “active swing” and Fib 2 captures the “dominant swing” without whipsaw.
➖➖➖
🎛 Inputs (quick reference)
🔸Fib Trend 1/2: Source (High/Low/Close), Left/Right bars, Smoothing length, Show/Hide, Cloud fill toggle
🔸Rolling 50%: Lookback length, Price basis (Wicks/Close/HLC3/OHLC4), Plot scope (Full / Last N / None)
🔸ATR Bands: ATR length, Multipliers (L1/L2), Plot scope, Line width/colors
🔸Overlay & Labels: Candle overlay mode, Label padding/size, 50% centerline toggle, Plot widths
➖➖➖
🖍️ Candle Coloring & Overlay Modes
💡Purpose: make trend instantly visible on the candles and ATR levels.
1) Color Logic (dropdown)
🔸 Fib Midpoints — Colors by position of price vs. Fib 1 & Fib 2
🔸ATR Zones — Colors by which ATR zone price is in relative to the Rolling 50%
➡️ Price Reference: Choose the input used for the decision (Close, HL2, OHLC3, OHLC4).
➡️Tip: Close is crisp; HL2/OHLC variants are smoother.
2) Overlay Style (dropdown)
🔸 None — No visual change to candles
🔸 Bar Color — Uses `barcolor()` to tint built-in candles (this takes into account your Trading View settings, for instance if you have wicks set to white, they will show up as white with this setting)
🔸 PlotCandles — Draws unified custom candles (body, wick, border) with the same color for maximum clarity
💡Practical use
🔸 Pick Fib Midpoints to read structural bias at a glance (above/below/between the cloud).
🔸 Pick ATR Zones to read value vs. stretch around the Rolling 50% (mean-reversion vs. trend extension).
➖➖➖
📘 How to use
A) Trend confirmation
- Strong bullish bias when price holds above both structural mids; strong bearish when below both.
- Use the Rolling 50% + ATR as a dynamic re-entry zone: pullbacks that respect ATR(L1) often continue the prevailing trend.
B) Transition / mean reversion
- Inside the Cloud (between Fib1 & Fib2) treat behavior as neutralization/re-balancing; range tactics tend to outperform momentum plays.
- In ranges, fades near ±ATR around the rolling 50% can mark short-term edges.
C) Breakout context
- When price leaves the Cloud, the Rolling 50% keeps you anchored so price never feels “floating.” A clean hold outside ATR(L1/L2) suggests regime strength; quick re-entries hint at traps.
➖➖➖
🖼 Chart examples
➡️ Each snapshot shows how the Cloud (structure) and the Rolling 50% + ATR (flow) work together.
1) 1-Minute Downtrend – Cloud as Dynamic Ceiling
- The Cloud slopes down; pullbacks repeatedly fail under the Cloud’s underside.
- Rolling 50% (dashed mid) + ATR(L1) act as a reversion band: rallies stall near upper ATR and rotate lower.
2) 15-Minute Persistent Drift – Structure Guides, Flow Times Entries
- Long drift lower with Cloud overhead.
- Consolidations near the rolling mid resolve in the trend direction; ATR bands frame risk on each attempt.
3) 15-Minute Uptrend (BTC) – From Cloud Escape to Value Stair-Step
- After escaping the prior Cloud, rolling 50% + ATR establish a new higher value area.
- Pullbacks into ATR(L1) produce orderly stair-steps; Cloud remains supportive on deeper dips
4) 5-Minute BTC – Pullback to Value then Rotate
- Strong leg up; retrace tags lower ATR band and rotates back toward the rolling mid.
- Labels (Fib1/Fib2) make the structural context explicit for decision-making.
➖➖➖
🧪 Starter presets
- Intraday (5–15m): Fib1 ~ L21/R5 (smooth 5), Fib2 ~ L55/R13 (smooth 9) • Rolling = 55 • ATR = 14 • L1 = 2.5x, L2 = 5.0x
- Scalping: Shorten lookbacks & smoothing; keep ATR multipliers similar, or tighten L1.
- Swing: Lengthen all lookbacks; consider ATR length 21–28.
➖➖➖
🏁Final Word
This script is not just a visual tool, it’s a complete trend and structure framework. Whether you're looking for clean trend alignment, dynamic support/resistance, or early warning signs of a reversal, this system is tuned to help you react with confidence — not hindsight.
Rembember, no single indicator should be used in isolation. For best results, combine it with price action analysis, higher-timeframe context, and complementary tools like trendlines, moving averages etc Use it as part of a well-rounded trading approach to confirm setups — not to define them alone.
---
💡Turn logic into clarity. Structure into trades. And uncertainty into confidence.

DCC Sessions Pro — fixed sessionsDCC Sessions Pro automatically highlights the three main market sessions directly on your candles for a clean and professional chart view.
• Asia (purple): 01:00 – 08:00
• London (blue): 08:00 – 15:30
• US (orange): 15:30 – 23:00
Weekends are automatically excluded so you only see relevant price action.
Perfect for intraday traders who want to track session behavior, volume shifts, and liquidity timing without overlapping colors or messy backgrounds.

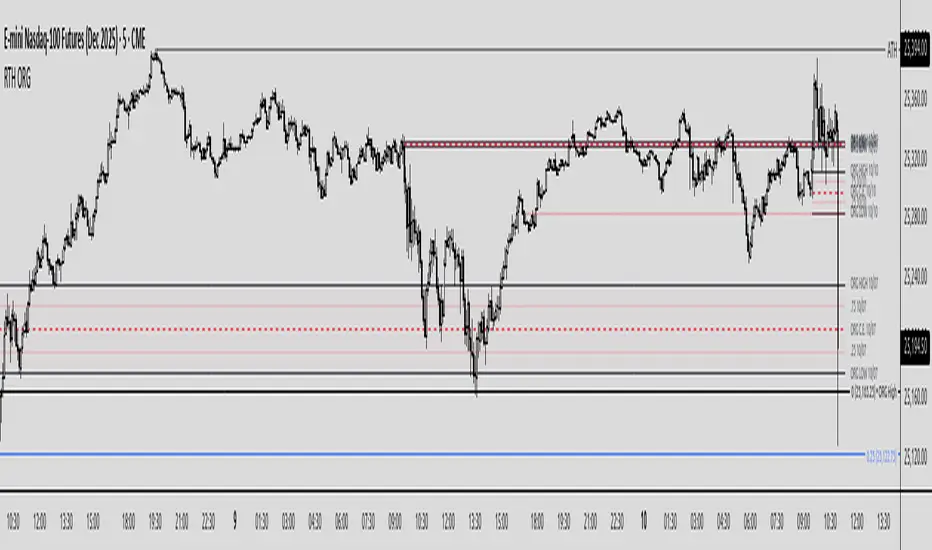
Regular Trading Hours Opening Range Gap (RTH ORG)### Regular Trading Hours (RTH) Gap Indicator with Quartile Levels
**Overview**
Discover overnight gaps in index futures like ES, YM, and NQ, or stocks like SPY, with this enhanced Pine Script v6 indicator. It visualizes the critical gap between the previous RTH close (4:15 PM ET for futures, 4:00 PM for SPY) and the next RTH open (9:30 AM ET), helping traders spot potential price sensitivity formed during after-hours trading.
**Key Features**
- **Standard Gap Boxes**: Semi-transparent boxes highlight the gap range, with optional text labels showing day-of-week and "RTH" identifier.
- **Midpoint Line**: A customizable dashed line at the 50% level, with price labels for quick reference.
- **New: Quartile Lines (25% & 75%)**: Dotted lines (default width 1) mark the quarter and three-quarter points within the gap, ideal for finer intraday analysis. Toggle on/off, adjust style/color/width, and add labels.
- **High-Low Gap Variant**: Optional boxes and midlines for gaps between the prior close's high/low and the open's high/low—perfect for wick-based overlaps on lower timeframes (5-min or below recommended).
- **RTH Close Lines**: Extend previous close levels with dotted lines and price tags.
- **Customization Galore**: Extend elements right, limit historical displays (default: 3 gaps), no-plot sessions (e.g., avoid weekends), and time offsets for non-US indices.
**How to Use**
Apply to 15-min or lower charts for best results. Toggle "extend right" for ongoing levels. SPY auto-adjusts for its 4 PM close.
Tested on major indices—enhance your gap trading strategy today! Questions? Drop a comment.
Thanks to twingall for supplying the original code.
Thanks to The Inner Circle Trader (ICT) for the logical and systematic application.
Trend Fib Zone Bounce (TFZB) [KedArc Quant]Description:
Trend Fib Zone Bounce (TFZB) trades with the latest confirmed Supply/Demand zone using a single, configurable Fib pullback (0.3/0.5/0.6). Trade only in the direction of the most recent zone and use a single, configurable fib level for pullback entries.
• Detects market structure via confirmed swing highs/lows using a rolling window.
• Draws Supply/Demand zones (bearish/bullish rectangles) from the latest MSS (CHOCH or BOS) event.
• Computes intra zone Fib guide rails and keeps them extended in real time.
• Triggers BUY only inside bullish zones and SELL only inside bearish zones when price touches the selected fib and closes back beyond it (bounce confirmation).
• Optional labels print BULL/BEAR + fib next to the triangle markers.
What it does
Finds structure using confirmed swing highs/lows (you choose the confirmation length).
Builds the latest zone (bullish = demand, bearish = supply) after a CHOCH/BOS event.
Draws intra-zone “guide rails” (Fib lines) and extends them live.
Signals only with the trend of that zone:
BUY inside a bullish zone when price tags the selected Fib and closes back above it.
SELL inside a bearish zone when price tags the selected Fib and closes back below it.
Optional labels print BULL/BEAR + Fib next to triangles for quick context
Why this is different
Most “zone + fib + signal” tools bolt together several indicators, or fire counter-trend signals because they don’t fully respect structure. TFZB is intentionally minimal:
Single bias source: the latest confirmed zone defines direction; nothing else overrides it.
Single entry rule: one Fib bounce (0.3/0.5/0.6 selectable) inside that zone—no counter-trend trades by design.
Clean visuals: you can show only the most recent zone, clamp overlap, and keep just the rails that matter.
Deterministic & transparent: every plot/label comes from the code you see—no external series or hidden smoothing
How it helps traders
Cuts decision noise: you always know the bias and the only entry that matters right now.
Forces discipline: if price isn’t inside the active zone, you don’t trade.
Adapts to volatility: pick 0.3 in strong trends, 0.5 as the default, 0.6 in chop.
Non-repainting zones: swings are confirmed after Structure Length bars, then used to build zones that extend forward (they don’t “teleport” later)
How it works (details)
*Structure confirmation
A swing high/low is only confirmed after Structure Length bars have elapsed; the dot is plotted back on the original bar using offset. Expect a confirmation delay of about Structure Length × timeframe.
*Zone creation
After a CHOCH/BOS (momentum shift / break of prior swing), TFZB draws the new Supply/Demand zone from the swing anchors and sets it active.
*Fib guide rails
Inside the active zone TFZB projects up to five Fib lines (defaults: 0.3 / 0.5 / 0.7) and extends them as time passes.
*Entry logic (with-trend only)
BUY: bar’s low ≤ fib and close > fib inside a bullish zone.
SELL: bar’s high ≥ fib and close < fib inside a bearish zone.
*Optionally restrict to one signal per zone to avoid over-trading.
(Optional) Aggressive confirm-bar entry
When do the swing dots print?
* The code confirms a swing only after `structureLen` bars have elapsed since that candidate high/low.
* On a 5-min chart with `structureLen = 10`, that’s about 50 minutes later.
* When the swing confirms, the script plots the dot back on the original bar (via `offset = -structureLen`). So you *see* the dot on the old bar, but it only appears on the chart once the confirming bar arrives.
> Practical takeaway: expect swing markers to appear roughly `structureLen × timeframe` later. Zones and signals are built from those confirmed swings.
Best timeframe for this Indicator
Use the timeframe that matches your holding period and the noise level of the instrument:
* Intraday :
* 5m or 15m are the sweet spots.
* Suggested `structureLen`:
* 5m: 10–14 (confirmation delay \~50–70 min)
* 15m: 8–10 (confirmation delay \~2–2.5 hours)
* Keep Entry Fib at 0.5 to start; try 0.3 in strong trends, 0.6 in chop.
* Tip: avoid the first 10–15 minutes after the open; let the initial volatility set the early structure.
* Swing/overnight:
* 1h or 4h.
* `structureLen`:
* 1h: 6–10 (6–10 hours confirmation)
* 4h: 5–8 (20–32 hours confirmation)
* 1m scalping: not recommended here—the confirmation lag relative to the noise makes zones less reliable.
Inputs (all groups)
Structure
• Show Swing Points (structureTog)
o Plots small dots on the bar where a swing point is confirmed (offset back by Structure Length).
• Structure Length (structureLen)
o Lookback used to confirm swing highs/lows and determine local structure. Higher = fewer, stronger swings; lower = more reactive.
Zones
• Show Last (zoneDispNum)
o Maximum number of zones kept on the chart when Display All Zones is off.
• Display All Zones (dispAll)
o If on, ignores Show Last and keeps all zones/levels.
• Zone Display (zoneFilter): Bullish Only / Bearish Only / Both
o Filters which zone types are drawn and eligible for signals.
• Clean Up Level Overlap (noOverlap)
o Prevents fib lines from overlapping when a new zone starts near the previous one (clamps line start/end times for readability).
Fib Levels
Each row controls whether a fib is drawn and how it looks:
• Toggle (f1Tog…f5Tog): Show/hide a given fib line.
• Level (f1Lvl…f5Lvl): Numeric ratio in . Defaults active: 0.3, 0.5, 0.7 (0 and 1 off by default).
• Line Style (f1Style…f5Style): Solid / Dashed / Dotted.
• Bull/Bear Colors (f#BullColor, f#BearColor): Per-fib color in bullish vs bearish zones.
Style
• Structure Color: Dot color for confirmed swing points.
• Bullish Zone Color / Bearish Zone Color: Rectangle fills (transparent by default).
Signals
• Entry Fib for Signals (entryFibSel): Choose 0.3, 0.5 (default), or 0.6 as the trigger line.
• Show Buy/Sell Signals (showSignals): Toggles triangle markers on/off.
• One Signal Per Zone (oneSignalPerZone): If on, suppresses additional entries within the same zone after the first trigger.
• Show Signal Text Labels (Bull/Bear + Fib) (showSignalLabels): Adds a small label next to each triangle showing zone bias and the fib used (e.g., BULL 0.5 or BEAR 0.3).
How TFZB decides signals
With trend only:
• BUY
1. Latest active zone is bullish.
2. Current bar’s close is inside the zone (between top and bottom).
3. The bar’s low ≤ selected fib and it closes > selected fib (bounce).
• SELL
1. Latest active zone is bearish.
2. Current bar’s close is inside the zone.
3. The bar’s high ≥ selected fib and it closes < selected fib.
Markers & labels
• BUY: triangle up below the bar; optional label “BULL 0.x” above it.
• SELL: triangle down above the bar; optional label “BEAR 0.x” below it.
Right-Panel Swing Log (Table)
What it is
A compact, auto-updating log of the most recent Swing High/Low events, printed in the top-right of the chart.
It helps you see when a pivot formed, when it was confirmed, and at what price—so you know the earliest bar a zone-based signal could have appeared.
Columns
Type – Swing High or Swing Low.
Date – Calendar date of the swing bar (follows the chart’s timezone).
Swing @ – Time of the original swing bar (where the dot is drawn).
Confirm @ – Time of the bar that confirmed that swing (≈ Structure Length × timeframe after the swing). This is also the earliest moment a new zone/entry can be considered.
Price – The swing price (high for SH, low for SL).
Why it’s useful
Clarity on repaint/confirmation: shows the natural delay between a swing forming and being usable—no guessing.
Planning & journaling: quick reference of today’s pivots and prices for notes/backtesting.
Scanning intraday: glance to see if you already have a confirmed zone (and therefore valid fib-bounce entries), or if you’re still waiting.
Context for signals: if a fib-bounce triangle appears before the time listed in Confirm @, it’s not a valid trade (you were too early).
Settings (Inputs → Logging)
Log swing times / Show table – turn the table on/off.
Rows to keep – how many recent entries to display.
Show labels on swing bar – optional tags on the chart (“Swing High 11:45”, “Confirm SH 14:15”) that match the table.
Recommended defaults
• Structure Length: 10–20 for intraday; 20–40 for swing.
• Entry Fib for Signals: 0.5 to start; try 0.3 in stronger trends and 0.6 in choppier markets.
• One Signal Per Zone: ON (prevents over trading).
• Zone Display: Both.
• Fib Lines: Keep 0.3/0.5/0.7 on; turn on 0 and 1 only if you need anchors.
Alerts
Two alert conditions are available:
• BUY signal – fires when a with trend bullish bounce at the selected fib occurs inside a bullish zone.
• SELL signal – fires when a with trend bearish bounce at the selected fib occurs inside a bearish zone.
Create alerts from the chart’s Alerts panel and select the desired condition. Use Once Per Bar Close to avoid intrabar flicker.
Notes & tips
• Swing dots are confirmed only after Structure Length bars, so they plot back in time; zones built from these confirmed swings do not repaint (though they extend as new bars form).
• If you don’t see a BUY where you expect one, check: (1) Is the active zone bullish? (2) Did the candle’s low actually pierce the selected fib and close above it? (3) Is One Signal Per Zone suppressing a second entry?
• You can hide visual clutter by reducing Show Last to 1–3 while keeping Display All Zones off.
Glossary
• CHOCH (Change of Character): A shift where price breaks beyond the last opposite swing while local momentum flips.
• BOS (Break of Structure): A cleaner break beyond the prior swing level in the current momentum direction.
• MSS: Either CHOCH or BOS – any event that spawns a new zone.
Extension ideas (optional)
• Add fib extensions (1.272 / 1.618) for target lines.
• Zone quality score using ATR normalization to filter weak impulses.
• HTF filter to only accept zones aligned with a higher timeframe trend.
⚠️ Disclaimer This script is provided for educational purposes only.
Past performance does not guarantee future results.
Trading involves risk, and users should exercise caution and use proper risk management when applying this strategy.

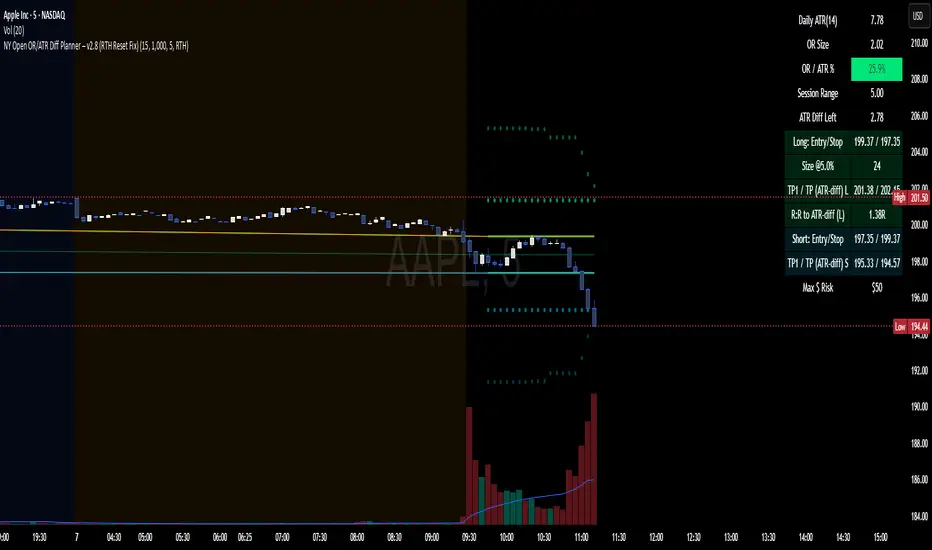
NY Open OR/ATR Diff Planner – v2.8 NY Open OR/ATR Diff Planner – v2.8 (Hi-Contrast)
Trade the Opening Range Breakout with a plan, not vibes.
This tool builds the NY Opening Range (OR) from the cash open and overlays a complete, risk-based execution plan: precise entry, structural stop, position size, targets, and R:R — all tied to the Daily ATR(14) and the remaining ATR “fuel” left in the day.
What it does
Opening Range: First N minutes after 09:30 ET (choose 5/15/30/60).
Today-only lines: Automatically resets at 09:30; no carry-over from prior days.
Session aware: Works on RTH or ETH charts. OR always anchors at 09:30 ET.
Fuel model: Computes Session Range (since 09:30) and ATR Diff Left = Daily ATR − Session Range.
Entries & Stops:
Long plan: Entry = ORH, Stop = ORL
Short plan: Entry = ORL, Stop = ORH
Targets:
TP1 = 1R (distance of entry→stop)
TP (ATR-diff cap): Entry ± ATR Diff Left (caps greed when the day’s ATR is nearly spent)
Sizing & R:R: Position size = Account × Risk% / Risk per share, with live R:R to ATR-diff target.
Hi-contrast table: Clear readout of Daily ATR, OR size, OR/ATR%, Session Range, ATR left, entries/stops/TPs, size, and max $ risk.
Inputs
Opening Range (minutes): 5 / 15 / 30 / 60
Account Size ($) and Risk % per trade
Session mode: RTH (09:30–16:00) or ETH (chart’s session; still anchored at 09:30)
Also show Short plan (toggle)
Show info table (toggle)
How to use
Add on a 1–5m chart.
Choose your OR window (e.g., 15m = 09:30–09:45).
Set Account Size and Risk % (e.g., 4–5% for small accounts; adjust to taste).
Wait for the OR to complete.
Trade the break/retest with the levels shown:
Long: Break of ORH, SL at ORL, TP1 = 1R, TP2 = ATR-diff cap.
Short: Mirror logic.
If OR/ATR% > ~50% (red), the “fuel” is thin — be selective.
Why it helps build an edge
Objective structure: Clear levels and sizing remove guesswork.
Context-aware targets: ATR-diff keeps targets realistic to the day’s potential.
Discipline by design: One framework that’s easy to review, journal, and iterate.
Notes
This is an indicator (visual planner), not an order-placing strategy.
If you want a back testable version (one trade/day, optional retest rule, TP/SL logic), say the word — I can publish a strategy variant.
Keywords: ORB, Opening Range, ATR, Risk Management, Position Sizing, Day Trading, NYSE Open, Mean Reversion Fuel, Execution Planner
EMA KitEMA Kit delivers multiple 1D EMA's wrapped into a single indicator.
I was annoyed with having a bunch of EMA indicators on the left side of my chart for each individual EMA I rely on, so I created a single indicator with all of them.
This EMA kit allows you to select any combination of the following EMA's: 3D, 5D, 8D, 21D, 34D, 50D, 100D, 200D, and 200W. They are all based on the 1D timeframe regardless of the timeframe you're currently viewing on your chart - for example, if you toggle from a Daily chart to a 15 minute chart, the EMA's won't change to reflect the 15 minute timeframe. EMA Kit smoothes the lines to prevent staggering on lower timeframes. You can change the color scheme and line thickness and even toggle between different line types like area, histogram, etc. You also have the option to turn end-of-line price labels on/off. Current price level for each EMA is highlighted on the price scale.

X VIBVolume Imbalance Zones
X VIB highlights price-levels where buying or selling pressure overwhelmed the opposing side within a single bar transition, leaving a void that the market often revisits. The script paints those voids as boxes so you can quickly see where liquidity may rest, where price may pause or react, and which imbalances persist across sessions.
What it plots
For each completed calculation bar (your chart’s timeframe or a higher timeframe you choose), the indicator draws a box that spans the prior bar’s close to the current bar’s open—only when that bar-to-bar transition exhibits a valid volume imbalance (VIB) by the selected rules. Boxes are time-anchored from the previous bar’s time to the current bar’s time close, and they are capped to a configurable count so the chart remains readable.
Two ways to define “Volume Imbalance”
X VIB calculates imbalances in two complementary ways. Both techniques isolate bar-to-bar displacement that reflects one-sided pressure, but they differ in strictness and how much confirmation they require.
Continuity VIB (Bar-to-Bar Displacement)
A strict definition that requires aligned progress and overlap between consecutive bars. In practical terms, a bullish continuity VIB demands that the new bar advances beyond the prior bar’s close, opens above it, and maintains upward progress without erasing the displacement; the bearish case mirrors this to the downside.
Use when: you want the cleanest, most structurally reliable voids that reflect decisive initiative flow.
Effect on boxes: typically fewer, higher-quality zones that mark locations of strong one-sided intent.
Gap-Qualified VIB (Displacement with Gap Confirmation)
A confirmatory definition that treats the bar-to-bar displacement as an imbalance only if the transition also observes a protective “gap-like” relationship with surrounding prices. This extra condition filters out many borderline transitions and emphasizes voids that were less likely to be traded through on their formation.
Use when: you want additional confirmation that the void had genuine follow-through pressure at birth.
Effect on boxes: often slightly fewer but “stickier” zones that can attract price on retests.
Both modes are drawn identically on the chart (as boxes spanning the displacement). Their difference is purely in the qualification of what counts as a VIB. You can display either set independently or together to compare how each mode surfaces structure.
Multi-Timeframe (MTF) logic
You can compute imbalances on a higher timeframe (e.g., 15-minute) while viewing a lower timeframe chart. When MTF is active, X VIB:
Samples open, high, low, close, time, and time_close from the selected HTF in a single, synchronized request (no gaps, no lookahead).
Only evaluates and draws boxes once per HTF bar close, ensuring clean, stable zones that don’t repaint intra-bar.
How traders use these zones
Reversion into voids: Price often returns to “fill” part of a void before deciding on continuation or reversal.
Context for entries/exits: VIB boxes provide precise, mechanically derived levels for limit entries, scale-outs, and invalidation points.
Confluence: Combine with session opens, HTF levels, or volatility bands to grade setups. Continuity VIBs can mark impulse anchors; Gap-Qualified VIBs often mark stickier pockets.
Inputs & controls
Calculate on higher timeframe? Toggle MTF computation; choose your Calc timeframe (e.g., 15).
Show VIBs: Master toggle for drawing imbalance boxes.
Color & Opacity: Pick the box fill and border intensity that suits your theme.
# Instances: Cap how many historical boxes remain on the chart to avoid clutter.
Notes & best practices
Signal density: Continuity VIBs tend to be more frequent on fast charts; Gap-Qualified VIBs are more selective. Try both and keep what aligns with your trade plan.
MTF discipline: When using a higher calc timeframe, analyze reactions primarily at that timeframe’s pace to avoid over-fitting to noise.
Lifecycle awareness: Not all voids fill. Track which boxes persist; durable voids often define the map of the session.

ORB + Session VWAP Pro (London & NY) — fixedORB + Session VWAP Pro (London & NY) — Listing copy (EN)
What it is
A clean, non-repainting intraday tool that fuses the classic Opening Range Breakout (ORB) with a session-anchored VWAP filter for London and New York. It highlights only the higher-quality breakouts (above/below session VWAP), adds an optional retest confirmation, and scores each signal with an intuitive Confidence metric (0–100).
Why it works
• ORB provides the day’s first actionable structure (range high/low).
• Session VWAP filters “cheap” breaks and favors flows aligned with session value.
• Optional retest reduces first-tick whipsaws.
• Confidence blends breakout depth (vs ATR), VWAP slope and band distance.
Key visuals
• LDN/NY OR High/Low (line break style) + optional OR boxes.
• Active Session VWAP (resets per signal window; falls back to daily VWAP outside).
• Optional VWAP bands (stdev or %).
• Session shading (London/NY windows).
• Signal markers (LDN BUY/SELL, NY BUY/SELL) fired with cooldown.
Signals
• London Long / Short: Break of LDN OR High/Low ± ATR buffer, aligned with VWAP side.
• NY Long / Short: Same logic during NY window.
• Retest (optional): Requires a tag back to the OR level ± tolerance before confirmation.
• Confidence: 0–100; gate via Min Confidence (default 55).
Inputs that matter
• Open Range Length (min): Default 15.
• London/NY times & timezones.
• ATR buffer & retest tolerance.
• Bands mode: Stdev (with lookback) or % (e.g., 1%).
• Signal cooldown: Avoids clutter on fast moves.
Non-repaint policy
• OR lines build within fixed time windows using the current bar’s timestamp.
• VWAP is cumulative within the session window; no lookahead.
• All ta.crossover/ta.crossunder are precomputed every bar (no conditional execution).
• Signals are based on live bar values, not future bars.
⸻
Quick start (examples)
1) EURUSD, London momentum
• Chart: 5m or 15m.
• OR: 15 min starting 08:00 Europe/London.
• Signals: Use defaults; keep ATR buffer = 0.2 and Retest = ON, Min Confidence ≥ 55.
• Play:
• BUY when price breaks LDN OR High + buffer and stays above VWAP; retest confirms.
• Trail behind VWAP or band #1; partials into band #2.
2) NAS100, New York breakout & run
• Chart: 5m.
• NY window: 09:30 America/New_York, OR = 15 min.
• Retest OFF on high momentum days; Min Confidence ≥ 60.
• Use band mode Stdev, bandLen=50, show ±1/±2.
• Momentum continuation: add on pullbacks that hold above VWAP after the breakout.
3) XAUUSD, London fake & VWAP fade
• Chart: 5m.
• Keep Retest ON; accept only shorts that break OR Low but retest fails back under VWAP.
• Confidence gate ≥ 50 to allow more mean-reversion setups.
⸻
Pro tips
• Adjust ATR buffer to the instrument: FX 0.15–0.25, indices 0.20–0.35, metals 0.20–0.30.
• Retest ON for choppy conditions; OFF for news momentum.
• Use VWAP bands: take partials at ±1; stretch targets at ±2/±3.
• Session timezones are explicit (London/New York). Ensure they match your instrument’s behavior.
• Pair with a higher-TF bias (e.g., 1H/4H trend) for directional filtering.
⸻
Alerts (ready to use)
• ORB+SVWAP — LDN Long, LDN Short, NY Long, NY Short
(Respect your cooldown; alerts fire only after confirmation and confidence gate.)
⸻
Known limits & notes
• Designed for intraday. On 1D+ charts, session windows compress.
• If your broker session differs from London/NY clocks on a holiday, adjust input times.
• Session-anchored VWAP uses the script’s signal window, not exchange sessions, by design.

DynamoSent DynamoSent Pro+ — Professional Listing (Preview)
— Adaptive Macro Sentiment (v6)
— Export, Adaptive Lookback, Confidence, Boxes, Heatmap + Dynamic OB/OS
Preview / Experimental build. I’m actively refining this tool—your feedback is gold.
If you spot edge cases, want new presets, or have market-specific ideas, please comment or DM me on TradingView.
⸻
What it is
DynamoSent Pro+ is an adaptive, non-repainting macro sentiment engine that compresses VIX, DXY and a price-based activity proxy (e.g., SPX/sector ETF/your symbol) into a 0–100 sentiment line. It scales context by volatility (ATR%) and can self-calibrate with rolling quantile OB/OS. On top of that, it adds confidence scoring, a plain-English Context Coach, MTF agreement, exportable sentiment for other indicators, and a clean Light/Dark UI.
Why it’s different
• Adaptive lookback tracks regime changes: when volatility rises, we lengthen context; when it falls, we shorten—less whipsaw, more relevance.
• Dynamic OB/OS (quantiles) self-calibrates to each instrument’s distribution—no arbitrary 30/70 lines.
• MTF agreement + Confidence gate reduce false positives by highlighting alignment across timeframes.
• Exportable output: hidden plot “DynamoSent Export” can be selected as input.source in your other Pine scripts.
• Non-repainting rigor: all request.security() calls use lookahead_off + gaps_on; signals wait for bar close.
Key visuals
• Sentiment line (0–100), OB/OS zones (static or dynamic), optional TF1/TF2 overlays.
• Regime boxes (Overbought / Oversold / Neutral) that update live without repaint.
• Info Panel with confidence heat, regime, trend arrow, MTF readout, and Coach sentence.
• Session heat (Asia/EU/US) to match intraday behavior.
• Light/Dark theme switch in Inputs (auto-contrasted labels & headers).
⸻
How to use (examples & recipes)
1) EURUSD (swing / intraday blend)
• Preset: EURUSD 1H Swing
• Chart: 1H; TF1=1H, TF2=4H (default).
• Proxies: Defaults work (VIX=D, DXY=60, Proxy=D).
• Dynamic OB/OS: ON at 20/80; Confidence ≥ 55–60.
• Playbook:
• When sentiment crosses above 50 + margin with Δ ≥ signalK and MTF agreement ≥ 0.5, treat as trend breakout.
• In Oversold with rising Coach & TF agreement, take fade longs back toward mid-range.
• Alerts: Enable Breakout Long/Short and Fade; keep cooldown 8–12 bars.
2) SPY (daytrading)
• Preset: SPY 15m Daytrade; Chart: 15m.
• VIX (D) matters more; preset weights already favor it.
• Start with static 30/70; later try dynamic 25/75 for adaptive thresholds.
• Use Coach: in US session, when it says “Overbought + MTF agree → sell rallies / chase breakouts”, lean momentum-continuation after pullbacks.
3) BTCUSD (crypto, 24/7)
• Preset: BTCUSD 1H; Chart: 1H.
• DXY and BTC.D inform macro tone; keep Carry-forward ON to bridge sparse ticks.
• Prefer Dynamic OB/OS (15/85) for wider swings.
• Fade signals on weekend chop; Breakout when Confidence > 60 and MTF ≥ 1.0.
4) XAUUSD (gold, macro blend)
• Preset: XAUUSD 4H; Chart: 4H.
• Weights tilt to DXY and US10Y (handled by preset).
• Coach + MTF helps separate trend legs from news pops.
⸻
Best practices
• Theme: Switch Light/Dark in Inputs; the panel adapts contrast automatically.
• Export: In another script → Source → DynamoSent Pro+ → DynamoSent Export. Build your own filters/strategies atop the same sentiment.
• Dynamic vs Static OB/OS:
• Static 30/70: fast, universal baseline.
• Dynamic (quantiles): instrument-aware; use 20/80 (default) or 15/85 for choppy markets.
• Confidence gate: Start at 50–60% to filter noise; raise when you want only A-grade setups.
• Adaptive Lookback: Keep ON. For ultra-liquid indices, you can switch it OFF and set a fixed lookback.
⸻
Non-repainting & safety notes
• All request.security() calls use lookahead=barmerge.lookahead_off and gaps=barmerge.gaps_on.
• No forward references; signals & regime flips are confirmed on bar close.
• History-dependent funcs (ta.change, ta.percentile_linear_interpolation, etc.) are computed each bar (not conditionally).
• Adaptive lookback is clamped ≥ 1 to avoid lowest/highest errors.
• Missing-data warning triggers only when all proxies are NA for a streak; carry-forward can bridge small gaps without repaint.
⸻
Known limits & tips
• If a proxy symbol isn’t available on your plan/exchange, you’ll see the NA warning: choose a different symbol via Symbol Search, or keep Carry-forward ON (it defaults to neutral where needed).
• Intraday VIX is sparse—using Daily is intentional.
• Dynamic OB/OS needs enough history (see dynLenFloor). On short histories it gracefully falls back to static levels.
Thanks for trying the preview. Your comments drive the roadmap—presets, new proxies, extra alerts, and integrations.

Weekend Hunter Ultimate v6.2 Weekend Hunter Ultimate v6.2 - Automated Crypto Weekend Trading System
OVERVIEW:
Specialized trading strategy designed for cryptocurrency weekend markets (Saturday-Sunday) when institutional traders are typically offline and market dynamics differ significantly from weekdays. Optimized for 15-minute timeframe execution with multi-timeframe confluence analysis.
KEY FEATURES:
- Weekend-Only Trading: Automatically activates during configurable weekend hours
- Dynamic Leverage: 5-20x leverage adjusted based on market safety and signal confidence
- Multi-Timeframe Analysis: Combines 4H trend, 1H momentum, and 15M execution
- 10 Pre-configured Crypto Pairs: BTC, ETH, LINK, XRP, DOGE, SOL, AVAX, PEPE, TON, POL
- Position & Risk Management: Max 4 concurrent positions, -30% account protection
- Smart Trailing Stops: Protects profits when approaching targets
RISK MANAGEMENT:
- Maximum daily loss: 5% (configurable)
- Maximum weekend loss: 15% (configurable)
- Per-position risk: Capped at 120-156 USDT
- Emergency stops for flash crashes (8% moves)
- Consecutive loss protection (4 losses = pause)
TECHNICAL INDICATORS:
- CVD (Cumulative Volume Delta) divergence detection
- ATR-based dynamic stop loss and take profit
- RSI, MACD, Bollinger Bands confluence
- Volume surge confirmation (1.5x average)
- Weekend liquidity adjustments
INTEGRATION:
- Designed for Bybit Futures (0.075% taker fee)
- WunderTrading webhook compatibility via JSON alerts
- Minimum position size: 120 USDT (Bybit requirement)
- Initial capital: $500 recommended
TARGET METRICS:
- Win rate target: 65%
- Average win: 5.5%
- Average loss: 1.8%
- Risk-reward ratio: ~3:1
IMPORTANT DISCLAIMERS:
- Past performance does not guarantee future results
- Leveraged trading carries substantial risk of loss
- Weekend crypto markets have 13% of normal liquidity
- Not suitable for traders who cannot afford to lose their entire investment
- Requires continuous monitoring and adjustment
USAGE:
1. Apply to 15-minute charts only
2. Configure weekend hours for your timezone
3. Set up webhook alerts for automation
4. Monitor performance table in top-right corner
5. Adjust parameters based on your risk tolerance
This is an experimental strategy for educational purposes. Always test with small amounts first and never invest more than you can afford to lose completely.

维加斯双通道策略Vegas Channel Comprehensive Strategy Description
Strategy Overview
A comprehensive trading strategy based on the Vegas Dual Channel indicator, supporting dynamic position sizing and fund management. The strategy employs a multi-signal fusion mechanism including classic price crossover signals, breakout signals, and retest signals, combined with trend filtering, RSI+MACD filtering, and volume filtering to ensure signal reliability.
Core Features
Dynamic Position Sizing: Continue adding positions on same-direction signals, close all positions on opposite signals
Smart Take Profit/Stop Loss: ATR-based dynamic TP/SL, updated with each new signal
Fund Management: Supports dynamic total amount management for compound growth
Time Filtering: Configurable trading time ranges
Risk Control: Maximum order limit to prevent over-leveraging
Leverage Usage Instructions
Important: This strategy does not use TradingView's margin functionality
Setup Method
Total Amount = Actual Funds × Leverage Multiplier
Example: Have 100U actual funds, want to use 10x leverage → Set total amount to 100 × 10 = 1000U
Trading Amount Calculation
Each trade percentage is calculated based on leveraged amount
Example: Set 10% → Actually trade 100U margin × 10x leverage = 1000U trading amount
Maximum Orders Configuration
Must be used in conjunction with leveraged amount
Example: 1000U total amount, 10% per trade, maximum 10 orders = maximum use of 1000U
Note: Do not exceed 100% of total amount to avoid over-leveraging
Parameter Configuration Recommendations
Leverage Configuration Examples
Actual funds 100U, 5x leverage, total amount setting 500U, 10% per trade, 50U per trade, recommended maximum orders 10
Actual funds 100U, 10x leverage, total amount setting 1000U, 10% per trade, 100U per trade, recommended maximum orders 10
Actual funds 100U, 20x leverage, total amount setting 2000U, 5% per trade, 100U per trade, recommended maximum orders 20
Risk Control
Conservative: 5-10x leverage, 10% per trade, maximum 5-8 orders
Aggressive: 10-20x leverage, 5-10% per trade, maximum 10-15 orders
Extreme: 20x+ leverage, 2-5% per trade, maximum 20+ orders
Strategy Advantages
Signal Reliability: Multiple filtering mechanisms reduce false signals
Capital Efficiency: Dynamic fund management for compound growth
Risk Controllable: Maximum order limits prevent liquidation
Flexible Configuration: Supports various leverage and fund allocation schemes
Time Control: Configurable trading hours to avoid high-risk periods
Usage Notes
Ensure total amount is set correctly (actual funds × leverage multiplier)
Maximum orders should not exceed the range allowed by total funds
Recommend starting with conservative configuration and gradually adjusting parameters
Regularly monitor strategy performance and adjust parameters timely
维加斯通道综合策略说明
策略概述
基于维加斯双通道指标的综合交易策略,支持动态加仓和资金管理。策略采用多信号融合机制,包括经典价穿信号、突破信号和回踩信号,结合趋势过滤、RSI+MACD过滤和成交量过滤,确保信号的可靠性。
核心功能
动态加仓:同向信号继续加仓,反向信号全部平仓
智能止盈止损:基于ATR的动态止盈止损,每次新信号更新
资金管理:支持动态总金额管理,实现复利增长
时间过滤:可设置交易时间范围
风险控制:最大订单数限制,防止过度加仓
杠杆使用说明
重要:本策略不使用TradingView的保证金功能
设置方法
总资金 = 实际资金 × 杠杆倍数
示例:实际有100U,想使用10倍杠杆 → 总资金设置为 100 × 10 = 1000U
交易金额计算
每笔交易百分比基于杠杆后的金额计算
示例:设置10% → 实际交易 100U保证金 × 10倍杠杆 = 1000U交易金额
最大订单数配置
必须配合杠杆后的金额使用
示例:1000U总资金,10%单笔,最大10单 = 最多使用1000U
注意:不要超过总资金的100%,避免过度杠杆
参数配置建议
杠杆配置示例
实际资金100U,5倍杠杆,总资金设置500U,单笔百分比10%,单笔金额50U,建议最大订单数10单
实际资金100U,10倍杠杆,总资金设置1000U,单笔百分比10%,单笔金额100U,建议最大订单数10单
实际资金100U,20倍杠杆,总资金设置2000U,单笔百分比5%,单笔金额100U,建议最大订单数20单
风险控制
保守型:5-10倍杠杆,10%单笔,最大5-8单
激进型:10-20倍杠杆,5-10%单笔,最大10-15单
极限型:20倍以上杠杆,2-5%单笔,最大20单以上
策略优势
信号可靠性:多重过滤机制,减少假信号
资金效率:动态资金管理,实现复利增长
风险可控:最大订单数限制,防止爆仓
灵活配置:支持多种杠杆和资金配置方案
时间控制:可设置交易时间,避开高风险时段
使用注意事项
确保总资金设置正确(实际资金×杠杆倍数)
最大订单数不要超过总资金允许的范围
建议从保守配置开始,逐步调整参数
定期监控策略表现,及时调整参数

Grand Master's Candlestick Dominance (ATR Enhanced)### Grand Master's Candlestick Dominance (ATR Enhanced)
**Overview**
Unleash the ancient wisdom of Japanese candlestick charting with a modern twist! This comprehensive Pine Script v5 strategy and indicator scans for over 75 classic and advanced candlestick patterns (bullish, bearish, and neutral), assigning dynamic strength scores (1-10) to each for precise signal filtering. Enhanced with Average True Range (ATR) for volatility-aware body size validation, it dominates the markets by combining timeless pattern recognition with robust confirmation layers. Whether used as a backtestable strategy or visual indicator, it empowers traders to spot high-probability reversals, continuations, and indecision setups with surgical accuracy.
Inspired by Steve Nison's *Japanese Candlestick Charting Techniques*, this tool elevates pattern analysis beyond basics—think Hammers, Engulfing patterns, Morning Stars, and rare gems like Abandoned Baby or Concealing Baby Swallow—all consolidated into intelligent arrays for real-time averaging and prioritization.
**Key Features**
- **Extensive Pattern Library**:
- **Bullish (25+ patterns)**: Hammer (8.0), Bullish Engulfing (10.0), Morning Star (7.0), Three White Soldiers (9.0), Dragonfly Doji (8.0), and more (e.g., Rising Three, Unique Three River Bottom).
- **Bearish (25+ patterns)**: Hanging Man (8.0), Bearish Engulfing (10.0), Evening Star (7.0), Three Black Crows (9.0), Gravestone Doji (8.0), and exotics like Upside Gap Two Crows or Stalled Pattern.
- **Neutral/Indecision (34+ patterns)**: Doji variants (Long-Legged, Four Price), Spinning Tops, Harami Crosses, and multi-bar setups like Upside Tasuki Gap or Advancing Block.
Each pattern includes duration tracking (1-5 bars) and ATR-adjusted body/shadow criteria for relevance in volatile conditions.
- **Smart Confirmation Filters** (All Toggleable):
- **Trend Alignment**: 20-period SMA (customizable) ensures entries align with the prevailing trend; optional higher timeframe (e.g., Daily) MA crossover for multi-timeframe confluence.
- **Support/Resistance (S/R)**: Pivot-based levels with 0.01% tolerance to confirm bounces or breaks.
- **Volume Surge**: 20-period volume MA with 1.5x spike multiplier to validate momentum.
- **ATR Body Sizing**: Filters small bodies (<0.3x ATR) and long bodies (>0.8x ATR) for context-aware pattern reliability.
- **Follow-Through**: Ensures post-pattern confirmation via bullish/bearish closes or closes beyond prior bars.
Minimum average strength (default 7.0) and individual pattern thresholds (5.0) prevent weak signals.
- **Entry & Exit Logic**:
- **Long Entry**: Bullish average strength ≥7.0 (outweighing bearish), uptrend, volume spike, near support, follow-through, and HTF alignment.
- **Short Entry**: Mirror for bearish dominance in downtrends near resistance.
- **Exits**: Bearish/neutral shift, or fixed TP (5%) / SL (2%)—pyramiding disabled, 10% equity sizing.
- Backtest range: Jan 1, 2020 – Dec 31, 2025 (editable). Initial capital: $10,000.
- **Interactive Dashboard** (Top-Right Panel):
Real-time insights including:
- Market phase (e.g., "Bullish Phase (Avg Str: 8.2)"), active pattern (e.g., "BULLISH: Bullish Engulfing (Str: 10.0, Bars: 2)"), and trend status.
- Strength breakdowns (Bull/Bear/Neutral counts & averages).
- Filter status (e.g., "Volume: ✔ Spike", "ATR: Enabled (L:0.8, S:0.3)").
- Backtest stats: Total trades, win rate, streak, and last entry/exit details (price & timestamp).
Toggle mode: Strategy (live trades) or Indicator (signals only).
- **Advanced Alerts** (15+ Toggleable Types):
Set up via TradingView's "Any alert() function call" for bar-close triggers:
- Entry/Exit signals with strength & pattern details.
- Strong patterns (≥2 bullish/bearish), neutral indecision, volume spikes.
- S/R breakouts, HTF reversals, high-confidence singles (≥8.0 strength).
- Conflicting signals, MA crossovers, ATR volatility bursts, multi-bar completions.
Example: "STRONG BULLISH PATTERN detected! Strength: 9.5 | Top Pattern: Three White Soldiers | Trend: Up".
**Customization & Usage Tips**
- **Inputs Groups**: Strategy toggles, confirmations, exits, backtest dates, and 15+ alert switches—all intuitively grouped.
- **Optimization**: Tune min strengths for aggressive (lower) or conservative (higher) trading; enable/disable filters to suit your style (e.g., disable S/R for scalping).
- **Best For**: Forex, stocks, crypto on 1H–Daily charts. Test on historical data to refine TP/SL.
- **Limitations**: No external data installs; relies on built-in TA functions. Patterns are probabilistic—combine with your risk management.
Master the candles like a grandmaster. Deploy on TradingView, backtest relentlessly, and let dominance begin! Questions? Drop a comment.
*Version: 1.0 | Updated: September 2025 | Credits: Built on Pine Script v5 with nods to Nison's timeless techniques.*

Volume Bubbles & Liquidity Heatmap [LuxAlgo]The Volume Bubbles & Liquidity Heatmap indicator highlights volume and liquidity clearly and precisely with its volume bubbles and liquidity heat map, allowing to identify key price areas.
Customize the bubbles with different time frames and different display modes: total volume, buy and sell volume, or delta volume.
🔶 USAGE
The primary objective of this tool is to offer traders a straightforward method for analyzing volume on any selected timeframe.
By default, the tool displays buy and sell volume bubbles for the daily timeframe over the last 2,000 bars. Traders should be aware of the difference between the timeframe of the chart and that of the bubbles.
The tool also displays a liquidity heat map to help traders identify price areas where liquidity accumulates or is lacking.
🔹 Volume Bubbles
The bubbles have three possible display modes:
Total Volume: Displays the total volume of trades per bubble.
Buy & Sell Volume: Each bubble is divided into buy and sell volume.
Delta Volume: Displays the difference between buy and sell volume.
Each bubble represents the trading volume for a given period. By default, the timeframe for each bubble is set to daily, meaning each bubble represents the trading volume for each day.
The size of each bubble is proportional to the volume traded; a larger bubble indicates greater volume, while a smaller bubble indicates lower volume.
The color of each bubble indicates the dominant volume: green for buy volume and red for sell volume.
One of the tool's main goals is to facilitate simple, clear, multi-timeframe volume analysis.
The previous chart shows Delta Volume bubbles with various chart and bubble timeframe configurations.
To correctly visualize the bubbles, traders must ensure there is a sufficient number of bars per bubble. This is achieved by using a lower chart timeframe and a higher bubble timeframe.
As can be seen in the image above, the greater the difference between the chart and bubble timeframes, the better the visualization.
🔹 Liquidity Heatmap
The other main element of the tool is the liquidity heatmap. By default, it divides the chart into 25 different price areas and displays the accumulated trading volume on each.
The image above shows a 4-hour BTC chart displaying only the liquidity heatmap. Traders should be aware of these key price areas and observe how the price behaves in them, looking for possible opportunities to engage with the market.
The main parameters for controlling the heatmap on the settings panel are Rows and Cell Minimum Size. Rows modifies the number of horizontal price areas displayed, while Cell Minimum Size modifies the minimum size of each liquidity cell in each row.
As can be seen in the above BTC hourly chart, the cell size is 24 at the top and 168 at the bottom. The cells are smaller on top and bigger on the bottom.
The color of each cell reflects the liquidity size with a gradient; this reflects the total volume traded within each cell. The default colors are:
Red: larger liquidity
Yellow: medium liquidity
Blue: lower liquidity
🔹 Using Both Tools Together
This indicator provides the means to identify directional bias and market timing.
The main idea is that if buyers are strong, prices are likely to increase, and if sellers are strong, prices are likely to decrease. This gives us a directional bias for opening long or short positions. Then, we combine our directional bias with price rejection or acceptance of key liquidity levels to determine the timing of opening or closing our positions.
Now, let's review some charts.
This first chart is BTC 1H with Delta Weekly Bubbles. Delta Bubbles measure the difference between buy and sell volume, so we can easily see which group is dominant (buyers or sellers) and how strong they are in any given week. This, along with the key price areas displayed by the Liquidity Heatmap, can help us navigate the markets.
We divided market behavior into seven groups, and each group has several bubbles, numbered from 1 to 17.
Bubbles 1, 2, and 3: After strong buyers market consolidates with positive delta, prices move up next week.
Bubbles 3, 4, and 5: Strength changes from buyers to sellers. Next week, prices go down.
Bubbles 6 and 7: The market trades at higher prices, but with negative delta. Next week, prices go down.
Bubbles 7, 8, and 9: Strength changes from sellers to buyers. Next weeks (9 and 10), prices go up.
Bubbles 10, 11, and 12: After strong buyers prices trade higher with a negative delta. Next weeks (12 and 13) prices go down.
Bubbles 12, 14, and 15: Strength changes from sellers to buyers; next week, prices increase.
Bubbles 15 and 16: The market trades higher with a very small positive delta; next week, prices go down.
Current bubble/week 17 is not yet finished. Right now, it is trading lower, but with a smaller negative delta than last week. This may signal that sellers are losing strength and that a potential reversal will follow, with prices trading higher.
This is the same BTC 1H chart, but with price rejections from key liquidity areas acting as strong price barriers.
When prices reach a key area with strong liquidity and are rejected, it signals a good time to take action.
By observing price behavior at certain key price levels, we can improve our timing for entering or exiting the markets.
🔶 DETAILS
🔹 Bubbles Display
From the settings panel, traders can configure the bubbles with four main parameters: Mode, Timeframe, Size%, and Shape.
The image above shows five-minute BTC charts with execution over the last 3,500 bars, different display modes, a daily timeframe, 100% size, and shape one.
The Size % parameter controls the overall size of the bubbles, while the Shape parameter controls their vertical growth.
Since the chart has two scales, one for time and one for price, traders can use the Shape parameter to make the bubbles round.
The chart above shows the same bubbles with different size and shape parameters.
You can also customize data labels and timeframe separators from the settings panel.
🔶 SETTINGS
Execute on last X bars: Number of bars for indicator execution
🔹 Bubbles
Display Bubbles: Enable/Disable volume bubbles.
Bubble Mode: Select from the following options: total volume, buy and sell volume, or the delta between buy and sell volume.
Bubble Timeframe: Select the timeframe for which the bubbles will be displayed.
Bubble Size %: Select the size of the bubbles as a percentage.
Bubble Shape: Select the shape of the bubbles. The larger the number, the more vertical the bubbles will be stretched.
🔹 Labels
Display Labels: Enable/Disable data labels, select size and location.
🔹 Separators
Display Separators: Enable/Disable timeframe separators and select color.
🔹 Liquidity Heatmap
Display Heatmap: Enable/Disable liquidity heatmap.
Heatmap Rows: select number of rows to be displayed.
Cell Minimum Size: Select the minimum size for each cell in each row.
Colors.
🔹 Style
Buy & Sell Volume Colors.

CCI Stochastic - YOSI
CCI Stochastic (Pro v6) – MTF, Adaptive Bands & Live Label
What it does
This indicator applies a Stochastic calculation on the CCI (K/D lines) to highlight momentum shifts, overbought/oversold zones, and adaptive market regimes. It comes with optional higher-timeframe confirmation, adaptive volatility bands, a live value label, and built-in alerts.
Key Features
Core Signal: Choose between D or K line of the Stoch-CCI.
Extreme Zones: Customizable OB/OS thresholds (default 80/20) and a midline (50), with dynamic background shading.
Adaptive Bands (optional): Mean ± k·standard deviation of the signal, to capture cyclic extremes.
MTF Confirmation (optional): Fetches the same signal from a higher timeframe via request.security.
Arrows/Signals:
Enter – Cross above OS (Buy) / below OB (Sell).
Center – Cross of the 50 midline (momentum shift).
Exit – Exit from extreme zones.
Alerts: All arrow signals + adaptive band crosses.
Live Value Label: Shows the latest signal value near the last bar, customizable decimals/offset/background colors.
Visuals: Red line above OB, green below OS, gray neutral; adaptive band fills.
Use Cases
Momentum / Reversals: Enter with OS/OB crosses confirmed by MTF.
Trend validation: Combine with moving averages (e.g., EMA200) or support/resistance.
Mean Reversion: Fade extreme zones, especially with adaptive band or OB/OS exit alerts.
Inputs
CCI Period, Stoch Period, Smooth K/D – core calculation.
Overbought / Oversold – thresholds (default 80/20).
Line to plot – K or D.
Show Arrows (Enter, Center, Exit) – visual control.
Adaptive Bands – length and k multiplier.
Higher TF – optional confirmation timeframe.
Live Label – decimals, offset, colors.
Quick Tips
For scalping/short-term setups: tighten OB/OS (e.g., 85/15) to filter noise.
In high volatility: increase adaptLen or decrease k to smooth bands.
Reduce false signals: require local + MTF alignment (e.g., only long if MTF > 50).
Disclaimer
This is a technical analysis tool – not a standalone buy/sell signal. Always use with proper risk management, key levels, and confluence from multiple factors.
מה זה עושה?
האינדיקטור מחשב Stochastic על CCI (קו K/D) ומציג אזורי קיצון, חציות ומשטרי שוק. הוא כולל אופציה לאישור מטיימפריים גבוה, בנדים אדפטיביים, תווית ערך חיה והתרעות מוכנות.
יכולות עיקריות
סיגנל מרכזי: בחירה בין קו D או K של Stoch-CCI.
אזורי קיצון: קווים ניתנים להגדרה (ברירת מחדל 80/20) וקו אמצע 50, עם צביעת רקע דינמית כשנכנסים לקיצון.
Adaptive Bands (אופציונלי): ממוצע ± k·סטיית תקן של הסיגנל—מסייע לזהות overheat ומחזוריות.
אישור MTF (אופציונלי): אותו סיגנל מטיימפריים גבוה באמצעות request.security.
חיצים/סיגנלים:
Enter – חציה מלמטה מעל OS (קנייה) / מלמעלה מתחת OB (מכירה).
Center – חציה של 50 (שינוי מומנטום).
Exit – יציאה מאזורים קיצוניים (OS/OB).
Alerts: לכל הסיגנלים לעיל + כניסה/יציאה לבנדים האדפטיביים.
תווית ערך חיה: מציגה את ערך הסיגנל האחרון ליד הנקודה (ספרות ו־offset ניתנים להגדרה).
עיצוב קריא: צבע קו אדום מעל OB, ירוק מתחת OS, אפור ניטרלי; מילוי אזורים.
שימוש מומלץ
מומנטום/היפוכים: כניסה עם חציה מה-OS/OB ואישור מה-MTF.
ממוצע נע/רמות מחיר: חברו לאימות מגמה (למשל EMA200 או תמיכה/התנגדות).
Mean Reversion: חיפוש חזרה מאזורי קיצון, במיוחד כשיש התרעת יציאה מ-OB/OS או נגיעה בבנד אדפטיבי.
קלטים מרכזיים
CCI Period, Stoch Period, Smooth K/D – פרמטרי חישוב.
Overbought / Oversold – ספי קיצון (ברירת מחדל 80/20).
Line to plot – בחירה בין K או D.
Show Arrows/Center/Exit/Enter – שליטה בתצוגת החיצים.
Adaptive Bands (len, k) – חלון ורגישות לבנדים.
Higher TF – טיימפריים לאישור (אופציונלי).
Live Label – ספרות, היסט ברים, צבעי רקע.
טיפים מהירים
בסקלפים/טווחים קצרים: הקשיחו ספי קיצון (למשל 85/15) להפחתת רעש.
בשוק תנודתי: העלו את adaptLen או הורידו את k כדי לקבל בנדים רגישים פחות.
להקטנת אותות שווא: דרשו התאמה בין הסיגנל המקומי ל-MTF (לדוגמה, לונג רק כשה-MTF מעל 50).
הערה חשובה
זהו כלי ניתוח טכני—לא אות קנייה/מכירה בפני עצמו. שלבו אותו עם ניהול סיכונים (SL/TP), בדיקת רמות מפתח ואימות ממספר אינדיקטורים או טיימפריימים.

Premarket Hi/Lo + Prior Day O/C LevelsPremarket Hi/Lo + Prior Day O/C (today only) shows four clear reference levels for the current regular trading session: the Premarket High and Premarket Low (taken from a user-defined premarket window, 04:00–09:30 by default) and Yesterday’s 09:30 Open and 15:59 Close (sourced from the 1-minute feed for accuracy). The premarket levels “lock” at the opening bell so they don’t move for the rest of the day. All four lines are displayed only during today’s regular hours to keep the chart focused. Small right-edge labels and an optional top-right mini-table show the exact values at a glance.
This indicator is designed to give immediate context without technical jargon. The premarket high/low summarize where price traveled before the bell; the prior-day open/close summarize where the last session began and ended. Checking whether price is above or below these markers helps you quickly judge strength or weakness and anticipate where price may pause, bounce, or break. Typical uses include watching for a clean break and hold above Premarket High (often bullish), a break and hold below Premarket Low (often bearish), drift back toward Prior Day Close after a gap (a common “magnet”), and flips around Prior Day Open that can lead to continuation.
Setup: Turn on Extended Hours in TradingView so premarket bars are visible (Chart Settings → Symbol → Extended Hours). Apply the indicator to any intraday timeframe. In Inputs, you can change the premarket window to match your market, adjust colors and line widths, and toggle the floating labels and the mini-table. Times use the chart’s exchange time (for US stocks, Eastern Time).
Notes and limits: Lines show only for today’s session (default 09:30–16:00). The script looks at the previous calendar day for “prior day,” so values may be empty after weekends or holidays when markets were closed. If your instrument uses different regular hours or you trade futures/crypto, adjust the premarket session in Inputs and—if needed—edit the regular-hours window in code to match. If your data source does not include premarket, the premarket lines will be blank.
Best practice: The first 15–30 minutes after the open are where these levels have the most impact. Reactions are more meaningful when a line aligns with another tool you use (e.g., VWAP or your opening range). If price does not react clearly at a line, avoid forcing a trade.
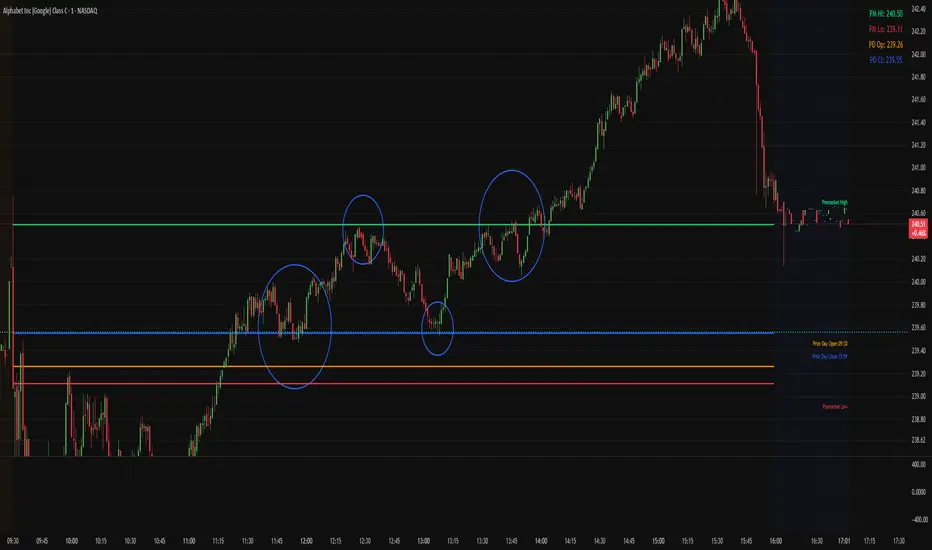
Bar Index & TimeLibrary to convert a bar index to a timestamp and vice versa.
Utilizes runtime memory to store the 𝚝𝚒𝚖𝚎 and 𝚝𝚒𝚖𝚎_𝚌𝚕𝚘𝚜𝚎 values of every bar on the chart (and optional future bars), with the ability of storing additional custom values for every chart bar.
█ PREFACE
This library aims to tackle some problems that pine coders (from beginners to advanced) often come across, such as:
I'm trying to draw an object with a 𝚋𝚊𝚛_𝚒𝚗𝚍𝚎𝚡 that is more than 10,000 bars into the past, but this causes my script to fail. How can I convert the 𝚋𝚊𝚛_𝚒𝚗𝚍𝚎𝚡 to a UNIX time so that I can draw visuals using xloc.bar_time ?
I have a diagonal line drawing and I want to get the "y" value at a specific time, but line.get_price() only accepts a bar index value. How can I convert the timestamp into a bar index value so that I can still use this function?
I want to get a previous 𝚘𝚙𝚎𝚗 value that occurred at a specific timestamp. How can I convert the timestamp into a historical offset so that I can use 𝚘𝚙𝚎𝚗 ?
I want to reference a very old value for a variable. How can I access a previous value that is older than the maximum historical buffer size of 𝚟𝚊𝚛𝚒𝚊𝚋𝚕𝚎 ?
This library can solve the above problems (and many more) with the addition of a few lines of code, rather than requiring the coder to refactor their script to accommodate the limitations.
█ OVERVIEW
The core functionality provided is conversion between xloc.bar_index and xloc.bar_time values.
The main component of the library is the 𝙲𝚑𝚊𝚛𝚝𝙳𝚊𝚝𝚊 object, created via the 𝚌𝚘𝚕𝚕𝚎𝚌𝚝𝙲𝚑𝚊𝚛𝚝𝙳𝚊𝚝𝚊() function which basically stores the 𝚝𝚒𝚖𝚎 and 𝚝𝚒𝚖𝚎_𝚌𝚕𝚘𝚜𝚎 of every bar on the chart, and there are 3 more overloads to this function that allow collecting and storing additional data. Once a 𝙲𝚑𝚊𝚛𝚝𝙳𝚊𝚝𝚊 object is created, use any of the exported methods:
Methods to convert a UNIX timestamp into a bar index or bar offset:
𝚝𝚒𝚖𝚎𝚜𝚝𝚊𝚖𝚙𝚃𝚘𝙱𝚊𝚛𝙸𝚗𝚍𝚎𝚡(), 𝚐𝚎𝚝𝙽𝚞𝚖𝚋𝚎𝚛𝙾𝚏𝙱𝚊𝚛𝚜𝙱𝚊𝚌𝚔()
Methods to retrieve the stored data for a bar index:
𝚝𝚒𝚖𝚎𝙰𝚝𝙱𝚊𝚛𝙸𝚗𝚍𝚎𝚡(), 𝚝𝚒𝚖𝚎𝙲𝚕𝚘𝚜𝚎𝙰𝚝𝙱𝚊𝚛𝙸𝚗𝚍𝚎𝚡(), 𝚟𝚊𝚕𝚞𝚎𝙰𝚝𝙱𝚊𝚛𝙸𝚗𝚍𝚎𝚡(), 𝚐𝚎𝚝𝙰𝚕𝚕𝚅𝚊𝚛𝚒𝚊𝚋𝚕𝚎𝚜𝙰𝚝𝙱𝚊𝚛𝙸𝚗𝚍𝚎𝚡()
Methods to retrieve the stored data at a number of bars back (i.e., historical offset):
𝚝𝚒𝚖𝚎(), 𝚝𝚒𝚖𝚎𝙲𝚕𝚘𝚜𝚎(), 𝚟𝚊𝚕𝚞𝚎()
Methods to retrieve all the data points from the earliest bar (or latest bar) stored in memory, which can be useful for debugging purposes:
𝚐𝚎𝚝𝙴𝚊𝚛𝚕𝚒𝚎𝚜𝚝𝚂𝚝𝚘𝚛𝚎𝚍𝙳𝚊𝚝𝚊(), 𝚐𝚎𝚝𝙻𝚊𝚝𝚎𝚜𝚝𝚂𝚝𝚘𝚛𝚎𝚍𝙳𝚊𝚝𝚊()
Note: the library's strong suit is referencing data from very old bars in the past, which is especially useful for scripts that perform its necessary calculations only on the last bar.
█ USAGE
Step 1
Import the library. Replace with the latest available version number for this library.
//@version=6
indicator("Usage")
import n00btraders/ChartData/
Step 2
Create a 𝙲𝚑𝚊𝚛𝚝𝙳𝚊𝚝𝚊 object to collect data on every bar. Do not declare as `var` or `varip`.
chartData = ChartData.collectChartData() // call on every bar to accumulate the necessary data
Step 3
Call any method(s) on the 𝙲𝚑𝚊𝚛𝚝𝙳𝚊𝚝𝚊 object. Do not modify its fields directly.
if barstate.islast
int firstBarTime = chartData.timeAtBarIndex(0)
int lastBarTime = chartData.time(0)
log.info("First `time`: " + str.format_time(firstBarTime) + ", Last `time`: " + str.format_time(lastBarTime))
█ EXAMPLES
• Collect Future Times
The overloaded 𝚌𝚘𝚕𝚕𝚎𝚌𝚝𝙲𝚑𝚊𝚛𝚝𝙳𝚊𝚝𝚊() functions that accept a 𝚋𝚊𝚛𝚜𝙵𝚘𝚛𝚠𝚊𝚛𝚍 argument can additionally store time values for up to 500 bars into the future.
//@version=6
indicator("Example `collectChartData(barsForward)`")
import n00btraders/ChartData/1
chartData = ChartData.collectChartData(barsForward = 500)
var rectangle = box.new(na, na, na, na, xloc = xloc.bar_time, force_overlay = true)
if barstate.islast
int futureTime = chartData.timeAtBarIndex(bar_index + 100)
int lastBarTime = time
box.set_lefttop(rectangle, lastBarTime, open)
box.set_rightbottom(rectangle, futureTime, close)
box.set_text(rectangle, "Extending box 100 bars to the right. Time: " + str.format_time(futureTime))
• Collect Custom Data
The overloaded 𝚌𝚘𝚕𝚕𝚎𝚌𝚝𝙲𝚑𝚊𝚛𝚝𝙳𝚊𝚝𝚊() functions that accept a 𝚟𝚊𝚛𝚒𝚊𝚋𝚕𝚎𝚜 argument can additionally store custom user-specified values for every bar on the chart.
//@version=6
indicator("Example `collectChartData(variables)`")
import n00btraders/ChartData/1
var map variables = map.new()
variables.put("open", open)
variables.put("close", close)
variables.put("open-close midpoint", (open + close) / 2)
variables.put("boolean", open > close ? 1 : 0)
chartData = ChartData.collectChartData(variables = variables)
var fgColor = chart.fg_color
var table1 = table.new(position.top_right, 2, 9, color(na), fgColor, 1, fgColor, 1, true)
var table2 = table.new(position.bottom_right, 2, 9, color(na), fgColor, 1, fgColor, 1, true)
if barstate.isfirst
table.cell(table1, 0, 0, "ChartData.value()", text_color = fgColor)
table.cell(table2, 0, 0, "open ", text_color = fgColor)
table.merge_cells(table1, 0, 0, 1, 0)
table.merge_cells(table2, 0, 0, 1, 0)
for i = 1 to 8
table.cell(table1, 0, i, text_color = fgColor, text_halign = text.align_left, text_font_family = font.family_monospace)
table.cell(table2, 0, i, text_color = fgColor, text_halign = text.align_left, text_font_family = font.family_monospace)
table.cell(table1, 1, i, text_color = fgColor)
table.cell(table2, 1, i, text_color = fgColor)
if barstate.islast
for i = 1 to 8
float open1 = chartData.value("open", 5000 * i)
float open2 = i < 3 ? open : -1
table.cell_set_text(table1, 0, i, "chartData.value(\"open\", " + str.tostring(5000 * i) + "): ")
table.cell_set_text(table2, 0, i, "open : ")
table.cell_set_text(table1, 1, i, str.tostring(open1))
table.cell_set_text(table2, 1, i, open2 >= 0 ? str.tostring(open2) : "Error")
• xloc.bar_index → xloc.bar_time
The 𝚝𝚒𝚖𝚎 value (or 𝚝𝚒𝚖𝚎_𝚌𝚕𝚘𝚜𝚎 value) can be retrieved for any bar index that is stored in memory by the 𝙲𝚑𝚊𝚛𝚝𝙳𝚊𝚝𝚊 object.
//@version=6
indicator("Example `timeAtBarIndex()`")
import n00btraders/ChartData/1
chartData = ChartData.collectChartData()
if barstate.islast
int start = bar_index - 15000
int end = bar_index - 100
// line.new(start, close, end, close) // !ERROR - `start` value is too far from current bar index
start := chartData.timeAtBarIndex(start)
end := chartData.timeAtBarIndex(end)
line.new(start, close, end, close, xloc.bar_time, width = 10)
• xloc.bar_time → xloc.bar_index
Use 𝚝𝚒𝚖𝚎𝚜𝚝𝚊𝚖𝚙𝚃𝚘𝙱𝚊𝚛𝙸𝚗𝚍𝚎𝚡() to find the bar that a timestamp belongs to.
If the timestamp falls in between the close of one bar and the open of the next bar,
the 𝚜𝚗𝚊𝚙 parameter can be used to determine which bar to choose:
𝚂𝚗𝚊𝚙.𝙻𝙴𝙵𝚃 - prefer to choose the leftmost bar (typically used for closing times)
𝚂𝚗𝚊𝚙.𝚁𝙸𝙶𝙷𝚃 - prefer to choose the rightmost bar (typically used for opening times)
𝚂𝚗𝚊𝚙.𝙳𝙴𝙵𝙰𝚄𝙻𝚃 (or 𝚗𝚊) - copies the same behavior as xloc.bar_time uses for drawing objects
//@version=6
indicator("Example `timestampToBarIndex()`")
import n00btraders/ChartData/1
startTimeInput = input.time(timestamp("01 Aug 2025 08:30 -0500"), "Session Start Time")
endTimeInput = input.time(timestamp("01 Aug 2025 15:15 -0500"), "Session End Time")
chartData = ChartData.collectChartData()
if barstate.islastconfirmedhistory
int startBarIndex = chartData.timestampToBarIndex(startTimeInput, ChartData.Snap.RIGHT)
int endBarIndex = chartData.timestampToBarIndex(endTimeInput, ChartData.Snap.LEFT)
line1 = line.new(startBarIndex, 0, startBarIndex, 1, extend = extend.both, color = color.new(color.green, 60), force_overlay = true)
line2 = line.new(endBarIndex, 0, endBarIndex, 1, extend = extend.both, color = color.new(color.green, 60), force_overlay = true)
linefill.new(line1, line2, color.new(color.green, 90))
// using Snap.DEFAULT to show that it is equivalent to drawing lines using `xloc.bar_time` (i.e., it aligns to the same bars)
startBarIndex := chartData.timestampToBarIndex(startTimeInput)
endBarIndex := chartData.timestampToBarIndex(endTimeInput)
line.new(startBarIndex, 0, startBarIndex, 1, extend = extend.both, color = color.yellow, width = 3)
line.new(endBarIndex, 0, endBarIndex, 1, extend = extend.both, color = color.yellow, width = 3)
line.new(startTimeInput, 0, startTimeInput, 1, xloc.bar_time, extend.both, color.new(color.blue, 85), width = 11)
line.new(endTimeInput, 0, endTimeInput, 1, xloc.bar_time, extend.both, color.new(color.blue, 85), width = 11)
• Get Price of Line at Timestamp
The pine script built-in function line.get_price() requires working with bar index values. To get the price of a line in terms of a timestamp, convert the timestamp into a bar index or offset.
//@version=6
indicator("Example `line.get_price()` at timestamp")
import n00btraders/ChartData/1
lineStartInput = input.time(timestamp("01 Aug 2025 08:30 -0500"), "Line Start")
chartData = ChartData.collectChartData()
var diagonal = line.new(na, na, na, na, force_overlay = true)
if time <= lineStartInput
line.set_xy1(diagonal, bar_index, open)
if barstate.islastconfirmedhistory
line.set_xy2(diagonal, bar_index, close)
if barstate.islast
int timeOneWeekAgo = timenow - (7 * timeframe.in_seconds("1D") * 1000)
// Note: could also use `timetampToBarIndex(timeOneWeekAgo, Snap.DEFAULT)` and pass the value directly to `line.get_price()`
int barsOneWeekAgo = chartData.getNumberOfBarsBack(timeOneWeekAgo)
float price = line.get_price(diagonal, bar_index - barsOneWeekAgo)
string formatString = "Time 1 week ago: {0,number,#}\n - Equivalent to {1} bars ago\n\n𝚕𝚒𝚗𝚎.𝚐𝚎𝚝_𝚙𝚛𝚒𝚌𝚎(): {2,number,#.##}"
string labelText = str.format(formatString, timeOneWeekAgo, barsOneWeekAgo, price)
label.new(timeOneWeekAgo, price, labelText, xloc.bar_time, style = label.style_label_lower_right, size = 16, textalign = text.align_left, force_overlay = true)
█ RUNTIME ERROR MESSAGES
This library's functions will generate a custom runtime error message in the following cases:
𝚌𝚘𝚕𝚕𝚎𝚌𝚝𝙲𝚑𝚊𝚛𝚝𝙳𝚊𝚝𝚊() is not called consecutively, or is called more than once on a single bar
Invalid 𝚋𝚊𝚛𝚜𝙵𝚘𝚛𝚠𝚊𝚛𝚍 argument in the 𝚌𝚘𝚕𝚕𝚎𝚌𝚝𝙲𝚑𝚊𝚛𝚝𝙳𝚊𝚝𝚊() function
Invalid 𝚟𝚊𝚛𝚒𝚊𝚋𝚕𝚎𝚜 argument in the 𝚌𝚘𝚕𝚕𝚎𝚌𝚝𝙲𝚑𝚊𝚛𝚝𝙳𝚊𝚝𝚊() function
Invalid 𝚕𝚎𝚗𝚐𝚝𝚑 argument in any of the functions that accept a number of bars back
Note: there is no runtime error generated for an invalid 𝚝𝚒𝚖𝚎𝚜𝚝𝚊𝚖𝚙 or 𝚋𝚊𝚛𝙸𝚗𝚍𝚎𝚡 argument in any of the functions. Instead, the functions will assign 𝚗𝚊 to the returned values.
Any other runtime errors are due to incorrect usage of the library.
█ NOTES
• Function Descriptions
The library source code uses Markdown for the exported functions. Hover over a function/method call in the Pine Editor to display formatted, detailed information about the function/method.
//@version=6
indicator("Demo Function Tooltip")
import n00btraders/ChartData/1
chartData = ChartData.collectChartData()
int barIndex = chartData.timestampToBarIndex(timenow)
log.info(str.tostring(barIndex))
• Historical vs. Realtime Behavior
Under the hood, the data collector for this library is declared as `var`. Because of this, the 𝙲𝚑𝚊𝚛𝚝𝙳𝚊𝚝𝚊 object will always reflect the latest available data on realtime updates. Any data that is recorded for historical bars will remain unchanged throughout the execution of a script.
//@version=6
indicator("Demo Realtime Behavior")
import n00btraders/ChartData/1
var map variables = map.new()
variables.put("open", open)
variables.put("close", close)
chartData = ChartData.collectChartData(variables)
if barstate.isrealtime
varip float initialOpen = open
varip float initialClose = close
varip int updateCount = 0
updateCount += 1
float latestOpen = open
float latestClose = close
float recordedOpen = chartData.valueAtBarIndex("open", bar_index)
float recordedClose = chartData.valueAtBarIndex("close", bar_index)
string formatString = "# of updates: {0}\n\n𝚘𝚙𝚎𝚗 at update #1: {1,number,#.##}\n𝚌𝚕𝚘𝚜𝚎 at update #1: {2,number,#.##}\n\n"
+ "𝚘𝚙𝚎𝚗 at update #{0}: {3,number,#.##}\n𝚌𝚕𝚘𝚜𝚎 at update #{0}: {4,number,#.##}\n\n"
+ "𝚘𝚙𝚎𝚗 stored in memory: {5,number,#.##}\n𝚌𝚕𝚘𝚜𝚎 stored in memory: {6,number,#.##}"
string labelText = str.format(formatString, updateCount, initialOpen, initialClose, latestOpen, latestClose, recordedOpen, recordedClose)
label.new(bar_index, close, labelText, style = label.style_label_left, force_overlay = true)
• Collecting Chart Data for Other Contexts
If your use case requires collecting chart data from another context, avoid directly retrieving the 𝙲𝚑𝚊𝚛𝚝𝙳𝚊𝚝𝚊 object as this may exceed memory limits .
//@version=6
indicator("Demo Return Calculated Results")
import n00btraders/ChartData/1
timeInput = input.time(timestamp("01 Sep 2025 08:30 -0500"), "Time")
var int oneMinuteBarsAgo = na
// !ERROR - Memory Limits Exceeded
// chartDataArray = request.security_lower_tf(syminfo.tickerid, "1", ChartData.collectChartData())
// oneMinuteBarsAgo := chartDataArray.last().getNumberOfBarsBack(timeInput)
// function that returns calculated results (a single integer value instead of an entire `ChartData` object)
getNumberOfBarsBack() =>
chartData = ChartData.collectChartData()
chartData.getNumberOfBarsBack(timeInput)
calculatedResultsArray = request.security_lower_tf(syminfo.tickerid, "1", getNumberOfBarsBack())
oneMinuteBarsAgo := calculatedResultsArray.size() > 0 ? calculatedResultsArray.last() : na
if barstate.islast
string labelText = str.format("The selected timestamp occurs 1-minute bars ago", oneMinuteBarsAgo)
label.new(bar_index, hl2, labelText, style = label.style_label_left, size = 16, force_overlay = true)
• Memory Usage
The library's convenience and ease of use comes at the cost of increased usage of computational resources. For simple scripts, using this library will likely not cause any issues with exceeding memory limits. But for large and complex scripts, you can reduce memory issues by specifying a lower 𝚌𝚊𝚕𝚌_𝚋𝚊𝚛𝚜_𝚌𝚘𝚞𝚗𝚝 amount in the indicator() or strategy() declaration statement.
//@version=6
// !ERROR - Memory Limits Exceeded using the default number of bars available (~20,000 bars for Premium plans)
//indicator("Demo `calc_bars_count` parameter")
// Reduce number of bars using `calc_bars_count` parameter
indicator("Demo `calc_bars_count` parameter", calc_bars_count = 15000)
import n00btraders/ChartData/1
map variables = map.new()
variables.put("open", open)
variables.put("close", close)
variables.put("weekofyear", weekofyear)
variables.put("dayofmonth", dayofmonth)
variables.put("hour", hour)
variables.put("minute", minute)
variables.put("second", second)
// simulate large memory usage
chartData0 = ChartData.collectChartData(variables)
chartData1 = ChartData.collectChartData(variables)
chartData2 = ChartData.collectChartData(variables)
chartData3 = ChartData.collectChartData(variables)
chartData4 = ChartData.collectChartData(variables)
chartData5 = ChartData.collectChartData(variables)
chartData6 = ChartData.collectChartData(variables)
chartData7 = ChartData.collectChartData(variables)
chartData8 = ChartData.collectChartData(variables)
chartData9 = ChartData.collectChartData(variables)
log.info(str.tostring(chartData0.time(0)))
log.info(str.tostring(chartData1.time(0)))
log.info(str.tostring(chartData2.time(0)))
log.info(str.tostring(chartData3.time(0)))
log.info(str.tostring(chartData4.time(0)))
log.info(str.tostring(chartData5.time(0)))
log.info(str.tostring(chartData6.time(0)))
log.info(str.tostring(chartData7.time(0)))
log.info(str.tostring(chartData8.time(0)))
log.info(str.tostring(chartData9.time(0)))
if barstate.islast
result = table.new(position.middle_right, 1, 1, force_overlay = true)
table.cell(result, 0, 0, "Script Execution Successful ✅", text_size = 40)
█ EXPORTED ENUMS
Snap
Behavior for determining the bar that a timestamp belongs to.
Fields:
LEFT : Snap to the leftmost bar.
RIGHT : Snap to the rightmost bar.
DEFAULT : Default `xloc.bar_time` behavior.
Note: this enum is used for the 𝚜𝚗𝚊𝚙 parameter of 𝚝𝚒𝚖𝚎𝚜𝚝𝚊𝚖𝚙𝚃𝚘𝙱𝚊𝚛𝙸𝚗𝚍𝚎𝚡().
█ EXPORTED TYPES
Note: users of the library do not need to worry about directly accessing the fields of these types; all computations are done through method calls on an object of the 𝙲𝚑𝚊𝚛𝚝𝙳𝚊𝚝𝚊 type.
Variable
Represents a user-specified variable that can be tracked on every chart bar.
Fields:
name (series string) : Unique identifier for the variable.
values (array) : The array of stored values (one value per chart bar).
ChartData
Represents data for all bars on a chart.
Fields:
bars (series int) : Current number of bars on the chart.
timeValues (array) : The `time` values of all chart (and future) bars.
timeCloseValues (array) : The `time_close` values of all chart (and future) bars.
variables (array) : Additional custom values to track on all chart bars.
█ EXPORTED FUNCTIONS
collectChartData()
Collects and tracks the `time` and `time_close` value of every bar on the chart.
Returns: `ChartData` object to convert between `xloc.bar_index` and `xloc.bar_time`.
collectChartData(barsForward)
Collects and tracks the `time` and `time_close` value of every bar on the chart as well as a specified number of future bars.
Parameters:
barsForward (simple int) : Number of future bars to collect data for.
Returns: `ChartData` object to convert between `xloc.bar_index` and `xloc.bar_time`.
collectChartData(variables)
Collects and tracks the `time` and `time_close` value of every bar on the chart. Additionally, tracks a custom set of variables for every chart bar.
Parameters:
variables (simple map) : Custom values to collect on every chart bar.
Returns: `ChartData` object to convert between `xloc.bar_index` and `xloc.bar_time`.
collectChartData(barsForward, variables)
Collects and tracks the `time` and `time_close` value of every bar on the chart as well as a specified number of future bars. Additionally, tracks a custom set of variables for every chart bar.
Parameters:
barsForward (simple int) : Number of future bars to collect data for.
variables (simple map) : Custom values to collect on every chart bar.
Returns: `ChartData` object to convert between `xloc.bar_index` and `xloc.bar_time`.
█ EXPORTED METHODS
method timestampToBarIndex(chartData, timestamp, snap)
Converts a UNIX timestamp to a bar index.
Namespace types: ChartData
Parameters:
chartData (series ChartData) : The `ChartData` object.
timestamp (series int) : A UNIX time.
snap (series Snap) : A `Snap` enum value.
Returns: A bar index, or `na` if unable to find the appropriate bar index.
method getNumberOfBarsBack(chartData, timestamp)
Converts a UNIX timestamp to a history-referencing length (i.e., number of bars back).
Namespace types: ChartData
Parameters:
chartData (series ChartData) : The `ChartData` object.
timestamp (series int) : A UNIX time.
Returns: A bar offset, or `na` if unable to find a valid number of bars back.
method timeAtBarIndex(chartData, barIndex)
Retrieves the `time` value for the specified bar index.
Namespace types: ChartData
Parameters:
chartData (series ChartData) : The `ChartData` object.
barIndex (int) : The bar index.
Returns: The `time` value, or `na` if there is no `time` stored for the bar index.
method time(chartData, length)
Retrieves the `time` value of the bar that is `length` bars back relative to the latest bar.
Namespace types: ChartData
Parameters:
chartData (series ChartData) : The `ChartData` object.
length (series int) : Number of bars back.
Returns: The `time` value `length` bars ago, or `na` if there is no `time` stored for that bar.
method timeCloseAtBarIndex(chartData, barIndex)
Retrieves the `time_close` value for the specified bar index.
Namespace types: ChartData
Parameters:
chartData (series ChartData) : The `ChartData` object.
barIndex (series int) : The bar index.
Returns: The `time_close` value, or `na` if there is no `time_close` stored for the bar index.
method timeClose(chartData, length)
Retrieves the `time_close` value of the bar that is `length` bars back from the latest bar.
Namespace types: ChartData
Parameters:
chartData (series ChartData) : The `ChartData` object.
length (series int) : Number of bars back.
Returns: The `time_close` value `length` bars ago, or `na` if there is none stored.
method valueAtBarIndex(chartData, name, barIndex)
Retrieves the value of a custom variable for the specified bar index.
Namespace types: ChartData
Parameters:
chartData (series ChartData) : The `ChartData` object.
name (series string) : The variable name.
barIndex (series int) : The bar index.
Returns: The value of the variable, or `na` if that variable is not stored for the bar index.
method value(chartData, name, length)
Retrieves a variable value of the bar that is `length` bars back relative to the latest bar.
Namespace types: ChartData
Parameters:
chartData (series ChartData) : The `ChartData` object.
name (series string) : The variable name.
length (series int) : Number of bars back.
Returns: The value `length` bars ago, or `na` if that variable is not stored for the bar index.
method getAllVariablesAtBarIndex(chartData, barIndex)
Retrieves all custom variables for the specified bar index.
Namespace types: ChartData
Parameters:
chartData (series ChartData) : The `ChartData` object.
barIndex (series int) : The bar index.
Returns: Map of all custom variables that are stored for the specified bar index.
method getEarliestStoredData(chartData)
Gets all values from the earliest bar data that is currently stored in memory.
Namespace types: ChartData
Parameters:
chartData (series ChartData) : The `ChartData` object.
Returns: A tuple:
method getLatestStoredData(chartData, futureData)
Gets all values from the latest bar data that is currently stored in memory.
Namespace types: ChartData
Parameters:
chartData (series ChartData) : The `ChartData` object.
futureData (series bool) : Whether to include the future data that is stored in memory.
Returns: A tuple:
