חפש סקריפטים עבור "纳斯达克指数期货cfd"
Needle XRThe Didi Index with Full Validation is a technical indicator developed for the TradingView platform, based on the concept of the Didi Index, created by Odir Aguiar (Didi). It uses the relationship between three exponential moving averages (EMAs) of different periods to identify trend reversal or continuation points, known as "needle points." To increase signal reliability, the indicator incorporates validations from four widely used technical indicators: MACD, TRIX, DMI/ADX, and Stochastic. Buy and sell signals are displayed only when all validation conditions are met, ensuring greater accuracy.
The indicator is plotted in a separate panel below the price chart, displaying the Didi Index lines (positive and negative), a central reference line, and clear buy (green triangles) and sell (red triangles) signals.

SuperTrended Moving Averages Strategyself use
used in 1 second timeframe
please let me publish it aaa


John Bollinger's Bollinger BandsJapanese below / 日本語説明は下記
This indicator replicates how John Bollinger, the inventor of Bollinger Bands, uses Bollinger Bands, displaying Bollinger Bands, %B and Bandwidth in one indicator with alerts and signals.
Bollinger Bands is created by John Bollinger in 1980s who is an American financial trader and analyst. He introduced %B and Bandwidth 30 years later.
🟦 What's different from other Bollinger Bands indicator?
Unlike the default Bollinger Bands or other custom Bollinger Bands indicators on TradingView, this indicator enables to display three Bollinger Bands tools into a single indicator with signals and alerts capability.
You can plot the classic Bollinger Bands together with either %B or Bandwidth or three tools altogether which requires the specific setting(see below settings).
This makes it easy to quantitatively monitor volatility changes and price position in relation to Bollinger Bands in one place.
🟦 Features:
Plots Bollinger Bands (Upper, Basis, Lower) with fill between bands.
Option to display %B or Bandwidth with Bollinger Bands.
Plots highest and lowest Bandwidth levels over a customizable lookback period.
Adds visual markers when Bandwidth reaches its highest (Bulge) or lowest (Squeeze) value.
Includes ready-to-use alert conditions for Bulge and Squeeze events.
📈Chart
Green triangles and red triangles in the bottom chart mark Bulges and Squeezes respectively.
🟦 Settings:
Length: Number of bars used for Bollinger Band middleline calculation.
Basis MA Type: Choose SMA, EMA, SMMA (RMA), WMA, or VWMA for the midline.
StdDev: Standard deviation multiplier (default = 2.0).
Option: Select "Bandwidth" or "%B" (add the indicator twice if you want to display both).
Period for Squeeze and Bulge: Lookback period for detecting the highest and lowest Bandwidth levels.(default = 125 as specified by John Bollinger )
Style Settings: Colors, line thickness, and transparency can be customized.
📈Chart
The chart below shows an example of three Bollinger Bands tools: Bollinger Band, %B and Bandwidth are in display.
To do this, you need to add this indicator TWICE where you select %B from Option in the first addition of this indicator and Bandwidth from Option in the second addition.
🟦 Usage:
🟠Monitor Volatility:
Watch Bandwidth values to spot volatility contractions (Squeeze) and expansions (Bulge) that often precede strong price moves.
John Bollinger defines Squeeze and Bulge as follows;
Squeeze:
The lowest bandwidth in the past 125 period, where trend is born.
Bulge:
The highest bandwidth in the past 125 period where trend is going to die.
According to John Bollinger, this 125 period can be used in any timeframe.
📈Chart1
Example of Squeeze
You can see uptrends start after squeeze(red triangles)
📈Chart2
Example of Bulge
You can see the trend reversal from downtrend to uptrends at the bulge(green triangles)
📈Chart3
Bulge DOES NOT NECESSARILY mean the beginning of a trend in opposite direction.
For example, you can see a bulge happening in the right side of the chart where green triangles are marked. Nevertheless, uptrend still continues after the bulge.
In this case, the bulge marks the beginning of a consolidation which lead to the continuation of the trend. It means that a phase of the trend highlighted in the light blue box came to an end.
Note: light blue box is not drawn by the indicator.
Like other technical analysis methods or tools, these setups do not guarantee birth of new trends and trend reversals. Traders should be carefully observing these setups along with other factors for making decisions.
🟠Track Price Position:
Use %B to see where price is located in relation to the Bollinger Bands.
If %B is close to 1, the price is near upper band while %B is close to 0, the price is near lower band.
🟠Set Alerts:
Receive alerts when Bandwidth hits highest and lowest values of bandwidth, helping you prepare for potential breakout, ending of trends and trend reversal opportunities.
🟠Combine with Other Tools:
This indicator would work best when combined with price action, trend analysis, or
market environmental analysis.
—————————————————————————————
このインジケーターはボリンジャーバンドの考案者であるジョン・ボリンジャー氏が提唱するボリンジャーバンドの使い方を再現するために、ボリンジャーバンド、%B、バンドウィズ(Bandwidth) の3つを1つのインジケーターで表示可能にしたものです。シグナルやアラートにも対応しています。
ボリンジャーバンドは1980年代にアメリカ人トレーダー兼アナリストのジョン・ボリンジャー氏によって開発されました。彼はその30年後に%Bとバンドウィズを導入しました。
🟦 他のボリンジャーバンドとの違い
TradingView標準のボリンジャーバンドや他のボリンジャーバンドとは異なり、このインジケーターでは3つのボリンジャーバンドツールを1つのインジケーターで表示し、シグナルやアラート機能も利用できるようになっています。
一般的に知られている通常のボリンジャーバンドに加え、%Bやバンドウィズを組み合わせて表示でき、設定次第では3つすべてを同時にモニターすることも可能です。これにより、価格とボリンジャーバンドの位置関係とボラティリティ変化をひと目で、かつ定量的に把握することができます。
🟦 機能:
ボリンジャーバンド(アッパーバンド・基準線・ロワーバンド)を描画し、バンド間を塗りつぶし表示。
オプションで%Bまたはバンドウィズを追加表示可能。
バンドウィズの最高値・最安値を、任意の期間で検出して表示。
バンドウィズが指定期間の最高値(バルジ※)または最安値(スクイーズ)に達した際にシグナルを表示。
※バルジは一般的にボリンジャーバンドで用いられるエクスパンションとほぼ同じ意味ですが、定義が異なります。(下記参照)
バルジおよびスクイーズ発生時のアラート設定が可能。
📈 チャート例
下記チャートの緑の三角と赤の三角は、それぞれバルジとスクイーズを示しています。
🟦 設定:
Length: ボリンジャーバンドの基準線計算に使う期間。
Basis MA Type: SMA, EMA, SMMA (RMA), WMA, VWMAから選択可能。
StdDev: 標準偏差の乗数(デフォルト2.0)。
Option: 「Bandwidth」または「%B」を選択(両方表示するにはこのインジケーターを2回追加)。
Period for Squeeze and Bulge: Bandwidthの最高値・最安値を検出する期間(デフォルトはジョン・ボリンジャー氏が推奨する125)。
Style Settings: 色、線の太さ、透明度などをカスタマイズ可能。
📈 チャート例
下のチャートは「ボリンジャーバンド」「%B」「バンドウィズ」の3つを同時に表示した例です。
この場合、インジケーターを2回追加し、最初に追加した方ではOptionを「%B」に、次に追加した方では「Bandwidth」を選択します。
🟦 使い方:
🟠 ボラティリティを監視する:
バンドウィズの値を見ることで、価格変動の収縮(スクイーズ)や拡大(バルジ)を確認できます。
これらはしばしば強い値動きの前兆となります。
ジョン・ボリンジャー氏はスクイーズとバルジを次のように定義しています:
スクイーズ: 過去125期間の中で最も低いバンドウィズ→ 新しいトレンドが生まれる場所。
バルジ: 過去125期間の中で最も高いバンドウィズ → トレンドが終わりを迎える場所。
この「125期間」はどのタイムフレームでも利用可能とされています。
📈 チャート1
スクイーズの例
赤い三角のスクイーズの後に上昇トレンドが始まっているのが確認できます。
📈 チャート2
バルジの例
緑の三角のバルジの箇所で下降トレンドから上昇トレンドへの反転が見られます。
📈 チャート3
バルジが必ずしも反転を意味しない例
下記のチャート右側の緑の三角で示されたバルジの後も、上昇トレンドが継続しています。
この場合、バルジは反転ではなく「トレンド一時的な調整(レンジ入り)」を示しており、結果的に上昇トレンドが継続しています。
この場合、バルジは水色のボックスで示されたトレンドのフェーズの終わりを示しています。
※水色のボックスはインジケーターが描画したものではありません。
また、他のテクニカル分析と同様に、これらのセットアップは必ず新しいトレンドの発生やトレンド転換を保証するものではありません。トレーダーは他の要素も考慮し、慎重に意思決定する必要があります。
🟠 価格とボリンジャーバンドの位置関係を確認する:
%Bを利用すれば、価格がバンドのどこに位置しているかを簡単に把握できます。
%Bが1に近ければ価格はアッパーバンド付近、0に近ければロワーバンド付近にあります。
🟠 アラートを設定する:
バンドウィズが一定期間の最高値または最安値に到達した際にアラートを設定することで、ブレイクアウトやトレンド終了、反転の可能性に備えることができます。
🟠 他のツールと組み合わせる:
このインジケーターは、プライスアクション、トレンド分析、環境認識などと組み合わせて活用すると最も効果的です。

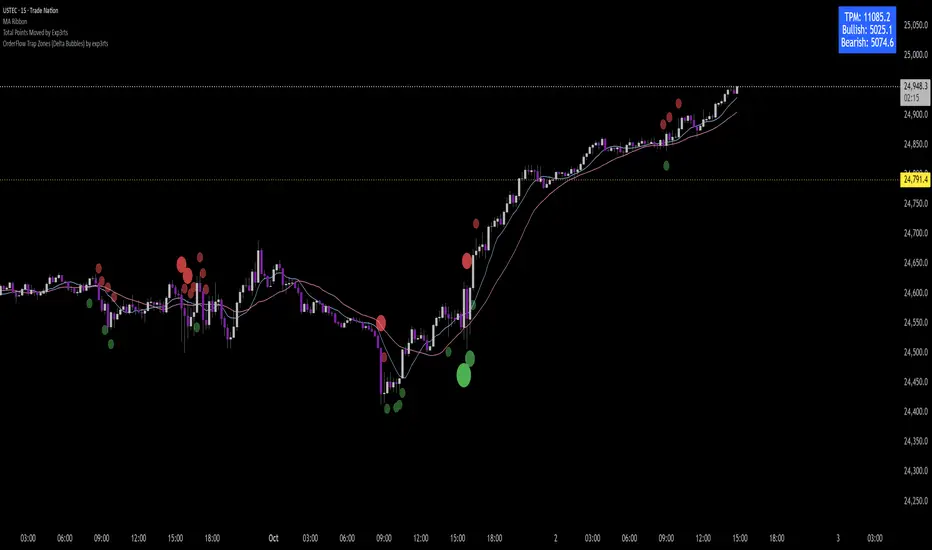
Total Points Range by exp3rtsThis indicator measures and displays the true intraday movement of a market by approximating tick-level activity using 1-second data aggregation. Instead of only looking at net candle movement, it sums every price change during a session, giving traders a more accurate picture of market effort and volatility.
Total Points Moved (TPM) – Captures the full distance traveled by price, not just the net gain/loss.
Bullish vs. Bearish Movement – Separates upward and downward moves so you can see who dominated the session.
Custom Sessions – Define your own session start/end times and time zone for precise tracking.
End-of-Session Summary – Automatically plots a label at session completion with totals for TPM, bullish, and bearish movement.
Visual Session Highlighting – Background shading makes it easy to see when the chosen session is active.
This tool is useful for:
Understanding the true effort vs. result of price movement
Comparing volatility across sessions
Identifying whether bulls or bears contributed more to market swings
Supporting order flow and tick-based trading strategies

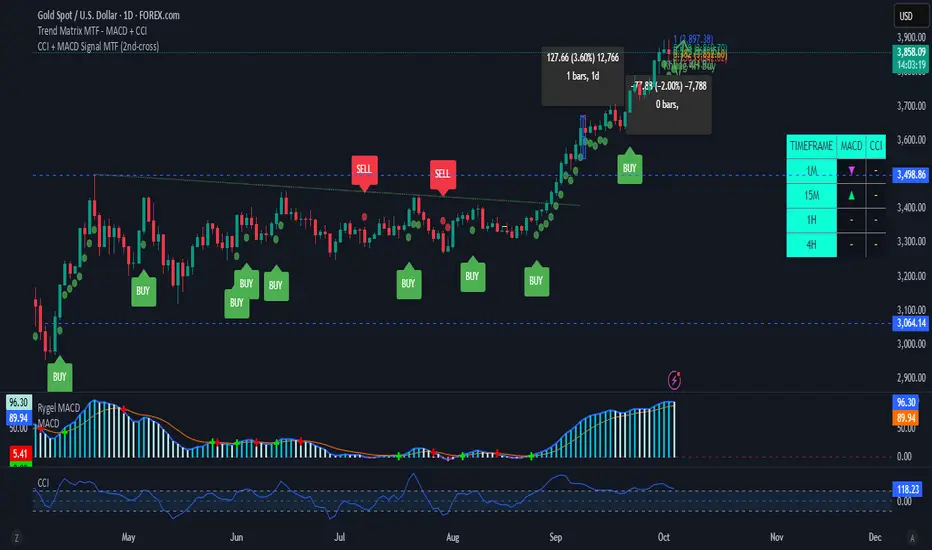
CCI + MACD Signal MTF (2nd-cross)This custom indicator combines the Commodity Channel Index (CCI) and the MACD to generate trading signals.
Basic signals (dots):
A green dot is plotted when CCI is above +100 and MACD is positive.
A red dot is plotted when CCI is below –100 and MACD is negative.
These dots help visualize momentum alignment between the two indicators.
Second-cross signals (text + alert):
The indicator also tracks cycles of the CCI.
When CCI first moves above +100 and later falls back below +100, this is counted as one completed cycle.
The next time CCI crosses back above +100 (the second cross), if MACD is still positive, a “BUY” label is plotted and a buy alert is triggered.
Conversely, when CCI first moves below –100 and later rises back above –100, that is one completed cycle.
The next time CCI crosses back below –100 (the second cross), if MACD is negative, a “SELL” label is plotted and a sell alert is triggered.
Alerts:
Alerts are only fired on the second-cross events (BUY or SELL), making them rarer but potentially more reliable than the basic dot conditions.
Timeframe flexibility:
Both the CCI and the MACD can be calculated on custom timeframes independently of the chart’s timeframe.

VWAP Multi Sessions + EMA + TEMA + PivotThis indicator combines several technical tools in one, designed for both intraday and swing traders to provide a complete view of market dynamics.
- VWAP Multi Sessions: calculates and plots five independent VWAPs, each based on a specific time range. This allows you to better identify value zones and price evolution during different phases of the trading day.
- Moving Averages (EMA): three strategic EMAs (55, 144, and 233 periods) are included to track the broader trend and highlight potential crossovers.
- TEMA (Triple Exponential Moving Average): two TEMAs (144 and 233 periods) offer a more responsive alternative to EMAs, reducing lag while filtering out some market noise.
- Daily Levels: the previous day’s open, close, high, and low are plotted as key support and resistance references.
- Pivot Point (P): also included is the classic daily pivot from the previous session, calculated as (High + Low + Close) / 3, which acts as a central level around which price often gravitates.
In summary, this indicator combines:
- intraday value references (session VWAPs),
- trend indicators (EMA and TEMA),
- and daily reference points (OHLC and Pivot).
It is particularly suited for intraday, scalping, and swing trading strategies, helping traders anticipate potential reaction zones in the market more effectively.

Exhaustion Detector by exp3rtsThis advanced indicator is designed to spot buyer and seller exhaustion zones by combining candle structure, volume anomalies, momentum oscillators, and support/resistance context. Optimized for the 5-minute chart, it highlights potential turning points where momentum is likely fading.
Multi-factor detection – Uses RSI, Stochastic, volume spikes, wick-to-body ratios, and ATR context to identify exhaustion.
Smart filtering – Optional trend filter (EMA) and support/resistance proximity filter refine signals.
Cooldown logic – Prevents repeated signals in rapid succession to reduce noise.
Confidence scoring – Each exhaustion signal is graded for strength, so you can gauge conviction.
Visual clarity – Clear arrows mark exhaustion signals, background zones highlight pressure areas, and debug labels show score breakdowns (toggleable).
Use this tool to:
Anticipate potential reversals before price turns
Spot exhaustion at key support/resistance zones
Add a contrarian signal filter to your trading system

Nth Candle by exp3rtsThis lightweight and versatile TradingView indicator highlights every Xth candle on your chart, making it easy to spot cyclical price behavior or track specific intervals in the market.
- Custom Interval – Choose how often candles should be highlighted (e.g., every 5th, 10th, or
20th bar).
- Color Coding – Highlighted candles are shaded green if bullish and red if bearish, giving you
quick visual insights into momentum at those intervals.
- Clean Overlay – The indicator draws directly on your main chart without clutter, so you can
combine it with your favorite setups and strategies.
Use this tool to:
1) Identify repeating patterns and cycles
2) Mark periodic reference candles
3) Support discretionary trading decisions with clear visual cues

HUNT_line [Dr.Forexy]HUNT_line Indicator
📊 **Category:** Price Action & Market Structure
⏰ **Recommended Timeframe:** 5-minute and higher
🎯 **Purpose:** Advanced market structure visualization for professional traders
⸻
⚡ **Key Features:**
• Break of Structure (BOS) and Change of Character (CHOCH) detection
• Internal & Swing Market Structure analysis
• Order Blocks identification with smart filtering
• Fair Value Gaps (FVG) visualization
• Premium/Discount Zones
• Multi-timeframe support
• Real-time structure alerts
⸻
🛠 **How to Use:**
1. Apply on 5M or higher timeframes for best results
2. Monitor BOS/CHOCH for trend direction changes
3. Use Order Blocks as potential support/resistance areas
4. Watch for FVG fills as price inefficiency zones
5. Combine multiple confluences for higher probability setups
⸻
⚠️ **Risk Disclaimer:**
This indicator is for educational purposes only.
Not financial advice. Always conduct your own research.
⸻
🔹 **Credits:**
Inspired by LuxAlgo's "Smart Money Concepts" with custom improvements

EMA CloudThe EMA Crossover Cloud is a clean and intuitive indicator that combines two Exponential Moving Averages (EMA) into a visual cloud.
Key features:
Cloud visualization: The space between EMA A and EMA B is shaded, making the current trend direction easier to identify.
Crossover signals: A clear LONG signal is plotted when EMA A crosses above EMA B, and a SHORT signal when EMA A crosses below EMA B.
Bar coloring: Candles are automatically colored according to the trend (uptrend, downtrend, or neutral).
Customizable colors: Cloud, signals, and bars can all be customized to match your chart style.
Alerts ready: Built-in alerts for EMA crossovers (LONG/SHORT).
Status label: A compact label shows the current cloud trend state in real time.
This indicator is ideal for traders who prefer simple and reliable crossover signals combined with a clear trend visualization. It works on any timeframe or asset.

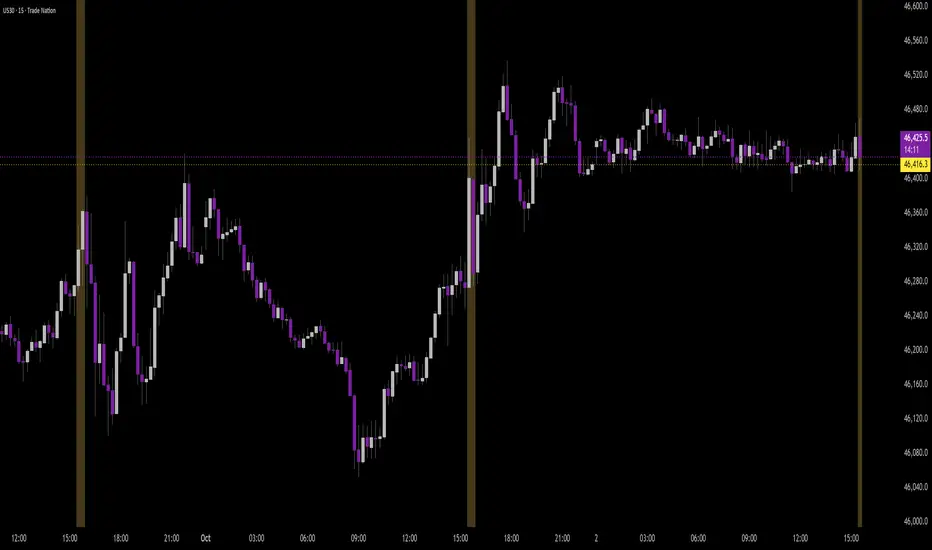
Time Range by exp3rtsTime Window highlights a custom time range directly on your chart, helping you focus on specific market sessions or trading hours.
Key Features:
Highlights a custom time range with a shaded background
Fully adjustable start and end time (hour & minute)
Supports multiple time zones (e.g., GMT, UTC, Europe/Berlin)
Optional market color shading inside the window (bull/bear neutral tone)
Use Cases:
Mark London Open, New York Session, or any session overlap
Focus on high-probability trading hours
Visualize your backtesting timeframe or algo activity window
Track premarket or after-hours activity for futures or indices
Customization:
Set the beginning and end time in your local or exchange time zone
Choose your timezone string (e.g., "GMT", "Etc/UTC", "America/New_York")
Automatically colors candles in the time window for easy visibility

Total Points Moved by exp3rtsThis lightweight utility tracks the total intraday range of price movement, giving you real-time insight into market activity.
It calculates:
🟩 Bullish Points – Total range from bullish candles (close > open)
🟥 Bearish Points – Total range from bearish candles (close < open)
🔁 Total Points Moved (TPM) – Sum of all high–low ranges for the day
Values are pulled from the 1-second chart for high precision and displayed in a compact tag in the top-right corner.
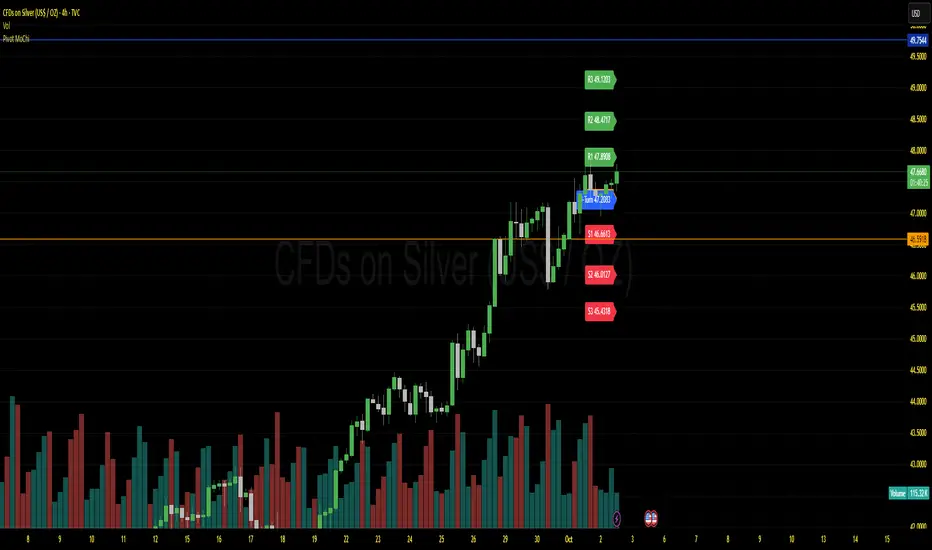
Pivot MoChiThis uses Current Day opening in place of previous day close
More Dynamic than Traditional Pivots
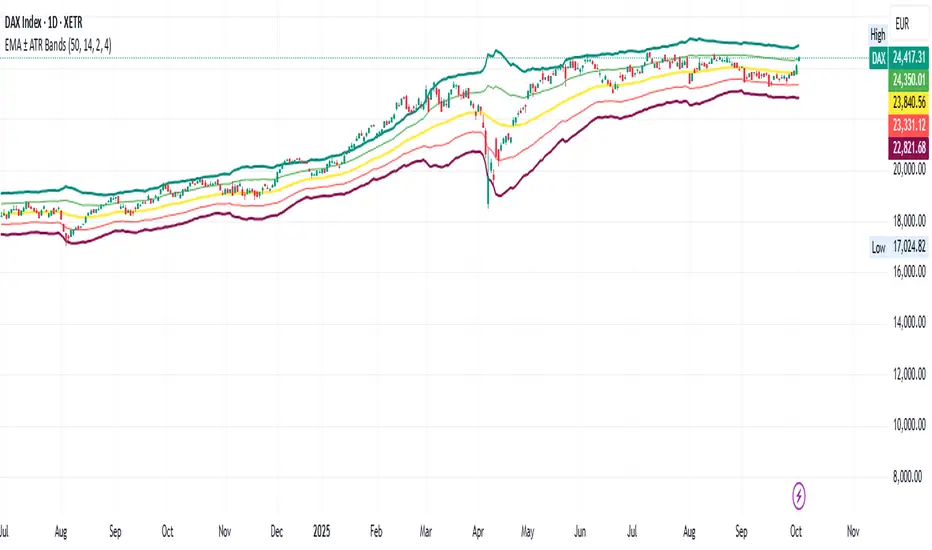
EMA ± ATR BandsPlot the bands from EMA as potential points where may want to enter/exit on principle that price returns to mean over time.
This script was created using Chat GPT.
Open Range Breakout (ORB) with Alerts and LabelsThis is a classic 5min ORB indicator that highlights the orb range for your chosen session. This makes it easy to reference the range later in the trading day. In addition to the original orb signals for both buy and sell you can play off that zone for powerful entries later in the session. The signals give TP1 1:1 TP2 2:1
Options
You can set the name of the session
The color of the range.
The buffer for the SL
How many entries for the orb
EQ + Bandas Pro 📊 EQ + Bands Pro is an advanced indicator built on OHLC analysis. It calculates a synthetic equilibrium price and plots dynamic, robust bands that adapt to volatility while filtering outliers. The tool highlights zones of overvaluation and undervaluation, helping traders identify key imbalances, potential reversals, and trend confirmations.

ICT Venom Trading Model [TradingFinder] SMC NY Session 2025SetupIntroduction
The ICT Venom Model is one of the most advanced strategies in the ICT framework, designed for intraday trading on major US indices such as US100, US30, and US500. This model is rooted in liquidity theory, time and price dynamics, and institutional order flow.
The Venom Model focuses on detecting Liquidity Sweeps, identifying Fair Value Gaps (FVG), and analyzing Market Structure Shifts (MSS). By combining these ICT core concepts, traders can filter false breakouts, capture sharp reversals, and align their entries with the real institutional liquidity flow during the New York Session.
Key Highlights of ICT Venom Model :
Intraday focus : Optimized for US indices (US100, US30, US500).
Time element : Critical window is 08:00–09:30 AM (Venom Box).
Liquidity sweep logic : Price grabs liquidity at 09:30 AM open.
Confirmation tools : MSS, CISD, FVG, and Order Blocks.
Dual setups : Works in both Bullish Venom and Bearish Venom conditions.
At its core, the ICT Venom Strategy is a framework that explains how institutional players manipulate liquidity pools by engineering false breakouts around the initial range of the market. Between 08:00 and 09:30 AM New York time, a range called the “Venom Box” is formed.
This range acts as a trap for retail traders, and once the 09:30 AM market open occurs, price usually sweeps either the high or the low of this box to collect stop-loss liquidity. After this liquidity grab, the market often reverses sharply, giving birth to a classic Bullish Venom Setup or Bearish Venom Setup
The Venom Model (ICT Venom Trading Strategy) is not just a pattern recognition tool but a precise institutional trading model based on time, liquidity, and market structure. By understanding the Initial Balance Range, watching for Liquidity Sweeps, and entering trades from FVG zones or Order Blocks, traders can anticipate market reversals with high accuracy. This strategy is widely respected among ICT followers because it offers both risk management discipline and clear entry/exit conditions. In short, the Venom Model transforms liquidity manipulation into actionable trading opportunities.
Bullish Setup :
Bearish Setup :
🔵 How to Use
The ICT Venom Model is applied by observing price behavior during the early hours of the New York session. The first step is to define the Initial Range, also called the Venom Box, which is formed between 08:00 and 09:30 AM EST. This range marks the high and low points where institutional traders often create traps for retail participants. Once the official market opens at 09:30 AM, price usually sweeps either the top or bottom of this box to collect liquidity.
After this liquidity grab, the market tends to reverse in alignment with the true directional bias. To confirm the setup, traders look for signals such as a Market Structure Shift (MSS), Change in State of Delivery (CISD), or the appearance of a Fair Value Gap (FVG). These elements validate the reversal and provide precise levels for trade execution.
🟣 Bullish Setup
In a Bullish Venom Setup, the market first sweeps the low of the Venom Box after 09:30 AM, triggering sell-side liquidity collection. This downward move is often sharp and deceptive, designed to stop out retail long positions and attract new sellers. Once liquidity is taken, the market typically shifts direction, forming an MSS or CISD that signals a reversal to the upside.
Traders then wait for price to retrace into a Fair Value Gap or a demand-side Order Block created during the reversal leg. This retracement offers the ideal entry point for long positions. Stop-loss placement should be just below the liquidity sweep low, while profit targets are set at the Venom Box high and, if momentum continues, at higher session or daily highs.
🟣 Bearish Setup
In a Bearish Venom Setup, the process is similar but reversed. After the Initial Range is defined, if price breaks above the Venom Box high following the 09:30 AM open, it signals a false breakout designed to collect buy-side liquidity. This move usually traps eager buyers and clears out stop-losses above the high.
After the liquidity sweep, confirmation comes through an MSS or CISD pointing to a reversal downward. At this stage, traders anticipate a retracement into a Fair Value Gap or a supply-side Order Block formed during the reversal. Short entries are taken within this zone, with stop-loss positioned just above the liquidity sweep high. The logical profit targets include the Venom Box low and, in stronger bearish momentum, deeper session or daily lows.
🔵 Settings
Refine Order Block : Enables finer adjustments to Order Block levels for more accurate price responses.
Mitigation Level OB : Allows users to set specific reaction points within an Order Block, including: Proximal: Closest level to the current price. 50% OB: Midpoint of the Order Block. Distal: Farthest level from the current price.
FVG Filter : The Judas Swing indicator includes a filter for Fair Value Gap (FVG), allowing different filtering based on FVG width: FVG Filter Type: Can be set to "Very Aggressive," "Aggressive," "Defensive," or "Very Defensive." Higher defensiveness narrows the FVG width, focusing on narrower gaps.
Mitigation Level FVG : Like the Order Block, you can set price reaction levels for FVG with options such as Proximal, 50% OB, and Distal.
CISD : The Bar Back Check option enables traders to specify the number of past candles checked for identifying the CISD Level, enhancing CISD Level accuracy on the chart.
🔵 Conclusion
The ICT Venom Model is more than just a reversal setup; it is a complete intraday trading framework that blends liquidity theory, time precision, and market structure analysis. By focusing on the Initial Range between 08:00 and 09:30 AM New York time and observing how price reacts at the 09:30 AM open, traders can identify liquidity sweeps that reveal institutional intentions.
Whether in a Bullish Venom Setup or a Bearish Venom Setup, the model allows for precise entries through Fair Value Gaps (FVGs) and Order Blocks, while maintaining clear risk management with well-defined stop-loss and target levels.
Ultimately, the ICT Venom Model provides traders with a structured way to filter false moves and align their trades with institutional order flow. Its strength lies in transforming liquidity manipulation into actionable opportunities, giving intraday traders an edge in timing, accuracy, and consistency. For those who master its logic, the Venom Model becomes not only a strategy for entry and exit, but also a deeper framework for understanding how liquidity truly drives price in the New York session.

Market Structure DashboardThis indicator displays a **multi-timeframe dashboard** that helps traders track market structure across several horizons: Monthly, Weekly, Daily, H4, H1, M15, and M5.
It identifies the current trend (Bullish, Bearish, or Neutral) based on the progression of **swing highs and lows** (HH/HL, LH/LL).
For each timeframe, the dashboard shows:
* The **current structure** (Bullish, Bearish, Neutral) with a clear color code (green, red, gray).
* **Pivot information**:
* either the latest swing high/low values,
* or the exact date and time of their occurrence (user-selectable in the settings).
An integrated **alert system** notifies you whenever the market structure changes (e.g., "Daily: Neutral → Bullish").
### Key Features:
* Clear overview of multi-timeframe market structures.
* Customizable pivot info display (values or timestamps).
* Built-in alerts on trend changes.
* Compact and readable dashboard, displayed in the top-right corner of the chart.
This tool is ideal for traders who want to quickly assess the **overall market structure** across multiple timeframes and be instantly alerted to potential reversals.

EMA 50/200/100 [NevoxCore]⯁ OVERVIEW
EMA 50/200/100 is a clean EMA trio for trend mapping.
It highlights the classic 50/200 bias, keeps a constant EMA-100 anchor in white, plots cross dots, and can mark the first pullback back to a target EMA within an ATR tolerance.
Solid bias bar coloring (Nevox pink/orange or classic green/red) and compact visuals make it fast and reliable with no repainting.
⯁ HOW IT WORKS
Calculates Fast EMA 50, Slow EMA 200, and an always-on EMA 100 (white).
Bias = Fast vs. Slow: Fast > Slow → long regime; Fast < Slow → short regime.
Cross dots appear at confirmed 50/200 crosses (once per bar close).
First Pullback: after a cross, the script arms a window and marks the first return to the chosen EMA (100 or Fast) within ATR × tolerance.
Bar coloring is solid by regime (pink/orange by default, classic green/red when enabled).
No lookahead; signals confirm on bar close.
⯁ KEY FEATURES
• EMA 50/200 with EMA-100 anchor (always visible, white)
• Cross Up/Down dots (style-configurable)
• First Pullback marker (toggle) with ATR tolerance & window
• Solid bias bar coloring (Nevox or classic)
• Optional bias fill between Fast/Slow
• Minimal 1-cell HUD (OFF by default)
• Ready-made alerts with clean prefixes
⯁ SETTINGS (quick)
Visual: Classic colors toggle; Bias Fill (ON); Fill Transparency (85); Bar Color (solid, ON; auto-disabled when Classic is ON).
Core: Source = Close; EMA Fast = 50; EMA Slow = 200.
Pullback: Show marker (ON); Target EMA = EMA 100; Tolerance × ATR = 0.5; Max Bars After Cross = 40; ATR Length = 14.
HUD: Mini HUD OFF; Position selector.
Status Line: OFF by default (optional EMA values).
⯁ ALERTS (built-in)
• Cross Up (Fast above Slow) — confirmed at bar close
• Cross Down (Fast below Slow) — confirmed at bar close
• First Pullback LONG — first return to target after long cross
• First Pullback SHORT — first return to target after short cross
Prefix: EMA and message includes {{ticker}} {{interval}} @ {{close}}.
Suggested: set TradingView alerts to Once Per Bar Close.
⯁ HOW TO USE
• Read trend quickly: 50 above 200 with a rising 100 = healthy long bias.
• Use the First Pullback to time entries after a cross (default target = EMA 100).
• Tune Tolerance × ATR by symbol/TF; 0.3–0.7 is a good start.
• Keep charts clean: bias fill + barcolor ON; switch to Classic for green/red if preferred.
⯁ WHY IT’S DIFFERENT
It preserves the classic 50/200 logic but adds a consistent EMA-100 anchor, a single, one-shot pullback detector, and clean bias bars — all in a lightweight overlay with no repaint tricks.
⯁ DISCLAIMER
Backtest and paper-trade before using live. Not financial advice. Performance depends on market, timeframe, and parameters.
