DR/IDR Candles [LuxAlgo]This indicator displays defining ranges (DR) and implied defining ranges (IDR) constructed from two user set sessions (RDR/ODR) as graphical candles on the chart. The script introduces additional graphical elements to the original DR/IDR concept and as such can be thought as a graphical method in addition to a technical indicator.
Additionally, this script can display various Fibonacci retracements from the constructed DR/IDR if enabled within the settings.
Settings
Regular Session: Enable/disable regular session's DR/IDR alongside setting the session time. By default, 09:30 - 10:30 am.
Overnight Session: Enable/disable overnight session's DR/IDR alongside setting the session time. By default, 03:00 - 04:00 am.
UTC Offset: UTC offset for the time zone, by default -5 (EST)
Retracements
Reverse: Inverts source range upper/lower value for constructing the retracements.
From: Source range used to construct the retracements, by default DR is used.
By default, the 0.5 retracement (average line) is displayed.
Usage
The used sessions are highlighted by a gray background. DRs are highlighted by dashed lines while IDRs are highlighted by solid ones. The maximum/minimum price between each user set session is highlighted by solid wicks.
The color of the DRs/IDRs/wicks are determined by the price position relative to the DR; if price is above the DR maximum, then a blue color is used. If price is below, then an orange color is used, and if price is within the DR range, then a gray color is used.
Additionally, the area of the DR range is used to highlight the number of time price is located within the DR, with a longer background highlighting a higher number of occurrences. This can help highlight if the DR levels were potentially useful as support/resistance.
When price is outside the IDR range, the area between the price and IDR is highlighted, in blue if price is above the IDR, and orange if it is under.
The original author of the DR/IDR concept describes 3 rules using the price position relative to the DR/IDR levels:
1.) If price on the 5-minute timeframe closes above the DR high after 10:30 AM or 04:00 AM then the DR low will likely be the low of the trading session.
2.) If price on the 5-minute timeframe closes below the DR low after 10:30 AM or 04:00 AM then the DR high will likely be the high of the trading session.
3.) If price closes above the IDR high after 10:30 AM or 04:00 AM it is an early indication that the low of the DR will be the low of the day and vice versa.
We can see that the above rules are cases of conditional probabilities.
There is no significant data supporting or regarding any statistical probability of the above rules to be true, which are more than uncertain given the stochastic nature of prices. The lack of precision of these rules is also a concern (time zone dependance, applicable markets, etc...).
Credits
Credits to trader TheMas7er who originally created the DR/IDR concept in November of 2022. This script was derived from his proposed session times & rules for trading.
חפש סקריפטים עבור "通达信+选股公式+换手率+0.5+源码"

TechnicalRating█ OVERVIEW
This library is a Pine Script™ programmer’s tool for incorporating TradingView's well-known technical ratings within their scripts. The ratings produced by this library are the same as those from the speedometers in the technical analysis summary and the "Rating" indicator in the Screener , which use the aggregate biases of 26 technical indicators to calculate their results.
█ CONCEPTS
Ensemble analysis
Ensemble analysis uses multiple weaker models to produce a potentially stronger one. A common form of ensemble analysis in technical analysis is the usage of aggregate indicators together in hopes of gaining further market insight and reinforcing trading decisions.
Technical ratings
Technical ratings provide a simplified way to analyze financial markets by combining signals from an ensemble of indicators into a singular value, allowing traders to assess market sentiment more quickly and conveniently than analyzing each constituent separately. By consolidating the signals from multiple indicators into a single rating, traders can more intuitively and easily interpret the "technical health" of the market.
Calculating the rating value
Using a variety of built-in TA functions and functions from our ta library, this script calculates technical ratings for moving averages, oscillators, and their overall result within the `calcRatingAll()` function.
The function uses the script's `calcRatingMA()` function to calculate the moving average technical rating from an ensemble of 15 moving averages and filters:
• Six Simple Moving Averages and six Exponential Moving Averages with periods of 10, 20, 30, 50, 100, and 200
• A Hull Moving Average with a period of 9
• A Volume-Weighted Moving Average with a period of 20
• An Ichimoku Cloud with a conversion line length of 9, base length of 26, and leading span B length of 52
The function uses the script's `calcRating()` function to calculate the oscillator technical rating from an ensemble of 11 oscillators:
• RSI with a period of 14
• Stochastic with a %K period of 14, a smoothing period of 3, and a %D period of 3
• CCI with a period of 20
• ADX with a DI length of 14 and an ADX smoothing period of 14
• Awesome Oscillator
• Momentum with a period of 10
• MACD with fast, slow, and signal periods of 12, 26, and 9
• Stochastic RSI with an RSI period of 14, a %K period of 14, a smoothing period of 3, and a %D period of 3
• Williams %R with a period of 14
• Bull Bear Power with a period of 50
• Ultimate Oscillator with fast, middle, and slow lengths of 7, 14, and 28
Each indicator is assigned a value of +1, 0, or -1, representing a bullish, neutral, or bearish rating. The moving average rating is the mean of all ratings that use the `calcRatingMA()` function, and the oscillator rating is the mean of all ratings that use the `calcRating()` function. The overall rating is the mean of the moving average and oscillator ratings, which ranges between +1 and -1. This overall rating, along with the separate MA and oscillator ratings, can be used to gain insight into the technical strength of the market. For a more detailed breakdown of the signals and conditions used to calculate the indicators' ratings, consult our Help Center explanation.
Determining rating status
The `ratingStatus()` function produces a string representing the status of a series of ratings. The `strongBound` and `weakBound` parameters, with respective default values of 0.5 and 0.1, define the bounds for "strong" and "weak" ratings.
The rating status is determined as follows:
Rating Value Rating Status
< -strongBound Strong Sell
< -weakBound Sell
-weakBound to weakBound Neutral
> weakBound Buy
> strongBound Strong Buy
By customizing the `strongBound` and `weakBound` values, traders can tailor the `ratingStatus()` function to fit their trading style or strategy, leading to a more personalized approach to evaluating ratings.
Look first. Then leap.
█ FUNCTIONS
This library contains the following functions:
calcRatingAll()
Calculates 3 ratings (ratings total, MA ratings, indicator ratings) using the aggregate biases of 26 different technical indicators.
Returns: A 3-element tuple: ( [(float) ratingTotal, (float) ratingOther, (float) ratingMA ].
countRising(plot)
Calculates the number of times the values in the given series increase in value up to a maximum count of 5.
Parameters:
plot : (series float) The series of values to check for rising values.
Returns: (int) The number of times the values in the series increased in value.
ratingStatus(ratingValue, strongBound, weakBound)
Determines the rating status of a given series based on its values and defined bounds.
Parameters:
ratingValue : (series float) The series of values to determine the rating status for.
strongBound : (series float) The upper bound for a "strong" rating.
weakBound : (series float) The upper bound for a "weak" rating.
Returns: (string) The rating status of the given series ("Strong Buy", "Buy", "Neutral", "Sell", or "Strong Sell").

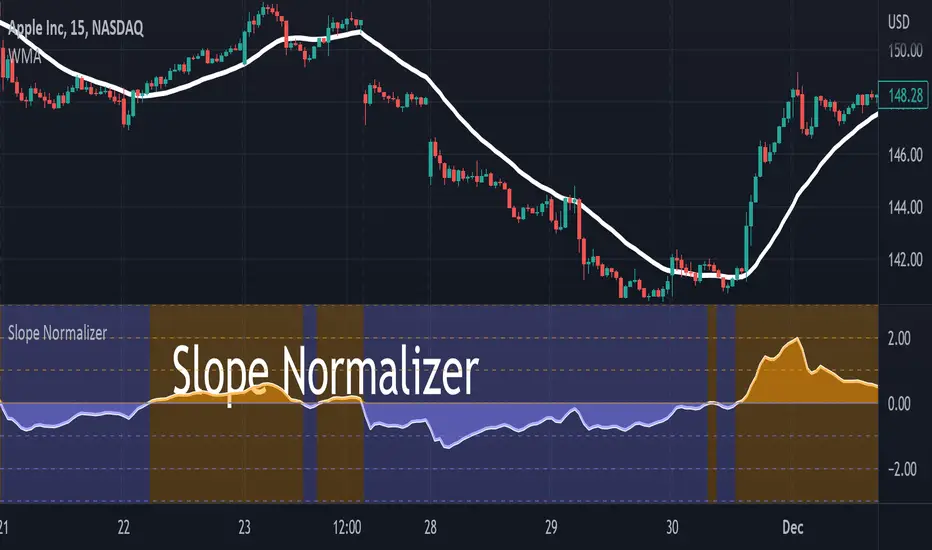
Slope NormalizerBrief:
This oscillator style indicator takes another indicator as its source and measures the change over time (the slope). It then isolates the positive slope values from the negative slope values to determine a 'normal' slope value for each.
** A 'normal' value of 1.0 is determined by the average slope plus the standard deviation of that slope.
The Scale
This indicator is not perfectly linear. The values are interpolated differently from 0.0 - 1.0 than values greater than 1.0.
From values 0.0 to 1.0 (positive or negative): it means that the value of the slope is less than 'normal' **.
Any value above 1.0 means the current slope is greater than 'normal' **.
A value of 2.0 means the value is the average plus 2x the standard deviation.
A value of 3.0 means the value is the average plus 3x the standard deviation.
A value greater than 4.0 means the value is greater than the average plus 4x the standard deviation.
Because the slope value is normalized, the meaning of these values can remain generally the same for different symbols.
Potential Usage Examples/b]
Using this in conjunction with an SMA or WMA may indicate a change in trend, or a change in trend-strength.
Any values greater than 4 indicate a very strong (and unusual) trend that may not likely be sustainable.
Any values cycling between +1.0 and -1.0 may mean indecision.
A value that is decreasing below 0.5 may predict a change in trend (slope may soon invert).
Price Heat MapWhat does this chart show? Take the highest high and lowest low of 200 bars. Divide that into 20 chunks. The more time the price spends in one of those 1/20th pockets, the brighter it is lit up on the chart. Number of bars back can be modified to around 500. It starts to chug beyond that. Brightness level of heat map can be adjusted. 0.5 is default. 1 = brighter, 0 = dimmer. Use on any time frame. When price moves out of a hot zone, it can move very quickly. There's no trading strategy here, just something to help you visualize recent price action. The blue band shows the price at the center of the current "hottest" band. The yellow band is the ema (exponential moving average) of the price using the "bars back" input. --enjoy!

Generalized Bollinger Bands %B And Bandwidth (Tartigradia)Bollinger Band is simply a representation of the rolling average of price and its standard deviation around the average (called the "basis").
This indicator generalizes the Bollinger Band by implementing many different equations to calculate the Bollinger Bands beyond the standard deviation and sma, and then plot the %B (where the current price falls inside the Bollinger Band), Bandwidth (size of the Bollinger Band) as well as the Bollinger Band itself and a reproduction of the OHLC price candles in a separate pane.
Whereas other Bollinger Bands indicators often just change the basis but not the stdev calculation, the correct way to change the basis is to also change it inside the stdev calculation.
Advanced features such as temporal discounting (ie, newer bars can have more weights), median absolute deviation and multiple sigma bands (eg, 3-sigma) are available.
Up to 3 different Bollinger Bands can be displayed, and the background can be highlighted when price is overbought/oversold (beyond the Bollinger Band of choice). Tip: BB3, which is the bollinger band with standard deviation of 3, which represents 99% of observed values in the lookback period, is a good choice to highlight overbought/oversold conditions.
Three "Sentiment Bars" are provided to see at a glance the sentiments on the price action relative to the Bollinger Bands as reflected by the %B value.
Usage:
Use the %B as a measure of sentiment: bullish if > 0.5, bearish if < 0.5. You can use the Sentiment Bars at the bottom for a quick reference: aqua if bullish, red if bearish, gray if undefined (too close to the middle line).
Use the bandwidth as a measure of volatility: higher is more volatile, lower is less.
When overbought, it can be a good time to sell/short. Use a higher Bollinger Band Multiplier such as 3 or more to reduce false positives.
When oversold, it can be a good time to buy/long. Use a higher Bollinger Band Multiplier such as 3 or more to reduce false positives.
Consider setting a much tighter lookback period of 4 as recommended in backtested works (en.wikipedia.org), use zlma instead of sma, and finally set a higher timeframe for the Bollinger Bands than the one you are currently studying. Then, the Bollinger Bands can help in detecting overbought and oversold regions (price going "out of bands").
Note that I tried to automate the setting of a higher timeframe, but for some reason the output is different when I manually do it using request.security() than when it's in indicator(timeframe=""). If someone has any suggestion as to why it happens, please let me know! (You can try it for yourself by uncommenting the auto_timeframe parameter line).

ERDAL SARIDAS Visual RSIOne-stop shop for all your divergence needs, including:
(1) A single metric for divergence strength across multiple indicators.
(2) Labels that make it easy to spot where the truly strong divergence is by showing the overall divergence strength value along with the number of divergent indicators. Hovering over the label shows a breakdown of each divergent indicator and its individual divergence strength value.
(3) Fully customizable, including inputs for pivot lengths, divergence types, and weights for every component of the divergence strength calculation. This allows you to quickly and easily optimize the output for any chart. Don't worry, the default settings will have you covered if you're not interested in what's going on under the hood.
The Divergence Strength Calculation:
The total divergence strength value is the sum of the divergence strengths of all indicators for which divergence was detected at a given bar. Each indicator's individual divergence strength is comprised of two basic components: (1) |ΔPrice| - the magnitude of the change in price over the divergence period (pivot-to-pivot), and (2) |ΔIndicator| - the magnitude of the change in indicator value over the divergence period.
Because different indicators' scales and volatility can vary greatly, the Δ values are expressed in terms of standard deviation to ensure that the values are meaningful and equitable across all indicators and assets/instruments/currency pairs, etc:
|ΔIndicator| = |indicator_value_1 - indicator_value_2| / 2 * StDev(indicator_series,100)
Calculation Weights:
All components of the calculation are weighted and can be modified on the Inputs page in settings (weights are simply multipliers). For example, if you think hidden divergence should carry less weight than regular divergence, you can assign it a lesser weight. Or if you think RSI divergence is worth more than OBV divergence, you can adjust their weights accordingly. List of weights:
Regular divergence weight - default = 1
Hidden divergence weight - default = 1
ΔPrice weight - default = 0.5 (multiplied by the ΔPrice component)
ΔIndicator weight - default = 1.5 (multiplied by the ΔIndicator component)
RSI weight - default = 1.1
OBV weight - default = 0.8
MACD weight - default = 0.9
STOCH weight - default = 0.9
Development for additional indicators is ongoing, as is research into the optimal weight configuration(s).
Other Inputs:
Pivot lengths - specify the number of bars before and after each pivot high/low to consider it a valid candidate for divergence.
Lookback bars and Lookback pivots - specify the number of bars or the number of pivots to look back across.
Price sources - specify separate price sources for bullish and bearish divergence
Display settings - specify how lines and labels should display, including which divergence strength values should show the largest labels. Include/exclude specific divergence types and indicators.
Please report any bugs, or let me know if you have any enhancement suggestions or requests for additional indicators.

Log Option [Loxx]A log option introduced by Wilmott (2000) has a payoff at maturity equal to max(log(S/X), 0), which is basically an option on the rate of return on the underlying asset with strike log(X). The value of a log option is given by: (via "The Complete Guide to Option Pricing Formulas")
e^−rT * n(d2)σ√(T − t) + e^−rT*(log(S/K) + (b −σ^2/2)T) * N(d2)
where N(*) is the cumulative normal distribution function, n(*) is the normal density function, and
d = ((log(S/X) + (b - v^2/2)*T) / (v*T^0.5)
b=r options on non-dividend paying stock
b=r-q options on stock or index paying a dividend yield of q
b=0 options on futures
b=r-rf currency options (where rf is the rate in the second currency)
Inputs
S = Stock price.
K = Strike price of option.
T = Time to expiration in years.
r = Risk-free rate
c = Cost of Carry
V = Variance of the underlying asset price
cnd1(x) = Cumulative Normal Distribution
nd(x) = Standard Normal Density Function
convertingToCCRate(r, cmp ) = Rate compounder
Numerical Greeks or Greeks by Finite Difference
Analytical Greeks are the standard approach to estimating Delta, Gamma etc... That is what we typically use when we can derive from closed form solutions. Normally, these are well-defined and available in text books. Previously, we relied on closed form solutions for the call or put formulae differentiated with respect to the Black Scholes parameters. When Greeks formulae are difficult to develop or tease out, we can alternatively employ numerical Greeks - sometimes referred to finite difference approximations. A key advantage of numerical Greeks relates to their estimation independent of deriving mathematical Greeks. This could be important when we examine American options where there may not technically exist an exact closed form solution that is straightforward to work with. (via VinegarHill FinanceLabs)
Things to know
Only works on the daily timeframe and for the current source price.
You can adjust the text size to fit the screen
GKYZ-Filtered, Non-Linear Regression MA [Loxx]GKYZ-Filtered, Non-Linear Regression MA is a Non-Linear Regression of price moving average. Use this as you would any other moving average. This also includes a Garman-Klass-Yang-Zhang Historical Volatility Filter to reduce noise.
What is Non-Linear Regression?
In statistics, nonlinear regression is a form of regression analysis in which observational data are modeled by a function which is a nonlinear combination of the model parameters and depends on one or more independent variables. The data are fitted by a method of successive approximations.
What is Garman-Klass-Yang-Zhang Historical Volatility?
Yang and Zhang derived an extension to the Garman Klass historical volatility estimator that allows for opening jumps. It assumes Brownian motion with zero drift. This is currently the preferred version of open-high-low-close volatility estimator for zero drift and has an efficiency of 8 times the classic close-to-close estimator. Note that when the drift is nonzero, but instead relative large to the volatility , this estimator will tend to overestimate the volatility . The Garman-Klass-Yang-Zhang Historical Volatility calculation is as follows:
GKYZHV = sqrt((Z/n) * sum((log(open(k)/close( k-1 )))^2 + (0.5*(log(high(k)/low(k)))^2) - (2*log(2) - 1)*(log(close(k)/open(2:end)))^2))
Included
Alerts
Signals
Loxx's Expanded Source Types
Bar coloring
Strength of Divergence Across Multiple IndicatorsOverview:
One-stop shop for all your divergence needs, including:
(1) A single metric for divergence strength across multiple indicators.
(2) Labels that make it easy to spot where the truly strong divergence is by showing the overall divergence strength value along with the number of divergent indicators. Hovering over the label shows a breakdown of each divergent indicator and its individual divergence strength value.
(3) Fully customizable, including inputs for pivot lengths, divergence types, and weights for every component of the divergence strength calculation. This allows you to quickly and easily optimize the output for any chart. Don't worry, the default settings will have you covered if you're not interested in what's going on under the hood.
The Divergence Strength Calculation:
The total divergence strength value is the sum of the divergence strengths of all indicators for which divergence was detected at a given bar. Each indicator's individual divergence strength is comprised of two basic components: (1) |ΔPrice| - the magnitude of the change in price over the divergence period (pivot-to-pivot), and (2) |ΔIndicator| - the magnitude of the change in indicator value over the divergence period.
Because different indicators' scales and volatility can vary greatly, the Δ values are expressed in terms of standard deviation to ensure that the values are meaningful and equitable across all indicators and assets/instruments/currency pairs, etc:
|ΔIndicator| = |indicator_value_1 - indicator_value_2| / 2 * StDev(indicator_series,100)
Calculation Weights:
All components of the calculation are weighted and can be modified on the Inputs page in settings (weights are simply multipliers). For example, if you think hidden divergence should carry less weight than regular divergence, you can assign it a lesser weight. Or if you think RSI divergence is worth more than OBV divergence, you can adjust their weights accordingly. List of weights:
Regular divergence weight - default = 1
Hidden divergence weight - default = 1
ΔPrice weight - default = 0.5 (multiplied by the ΔPrice component)
ΔIndicator weight - default = 1.5 (multiplied by the ΔIndicator component)
RSI weight - default = 1.1
OBV weight - default = 0.8
MACD weight - default = 0.9
STOCH weight - default = 0.9
Development for additional indicators is ongoing, as is research into the optimal weight configuration(s).
Other Inputs:
Pivot lengths - specify the number of bars before and after each pivot high/low to consider it a valid candidate for divergence.
Lookback bars and Lookback pivots - specify the number of bars or the number of pivots to look back across.
Price sources - specify separate price sources for bullish and bearish divergence
Display settings - specify how lines and labels should display, including which divergence strength values should show the largest labels. Include/exclude specific divergence types and indicators.
Please report any bugs, or let me know if you have any enhancement suggestions or requests for additional indicators.
@reees

Free Volume RSIdear fellows,
this indicator is a mod or tweak on the standard RSI here available.
the original RSI formula is, as you know,
100 - 100/(1+RS)
which equals to
100 * RS/(1+RS)
where
the 100 factor is merely a scale adjustment to 100's percent basis
the RS is the ratio between average gain and average loss within the last N candles.
thus, the absolute gain of the up candles within the last N candles window is averaged; same for absolute loss.
this averaging uses EMA.
the ratio between this averages is RS.
the RS ranges from 0 to infinity, thus the ratio RS/(1+RS) locks it between 0 and 1.
in regard of our changes
we use VWMA instead of EMA
we plot the resulting RS directly, instead of its smooth version RS/(1+RS)
we dismiss the 100 factor.
we specify logarithmic scale for the resulting plot
on the justifications of our changes
by using VWMA instead of EMA we get both a more dynamic averaging (WMA is faster) as well as a de facto strength of the price action, since now volume is considered alongside the price change. this way one can quantify accumulation and distribution intensities.
to anyone who ever was restricted against his will over a sufficiently large period of time on his freedom to move, would understand that an unrestricted indicator conveys better its info.
as we're dealing with ratios, the distance between 1 and 2 is the same between 1 and 0.5; thus, a log scale is specified for reading this indicator without distortions.
on how to use this indicators
this is still an early result, hence it lacks more testing.
so far, when it's oversold, buy; and vice versa.
best regards.

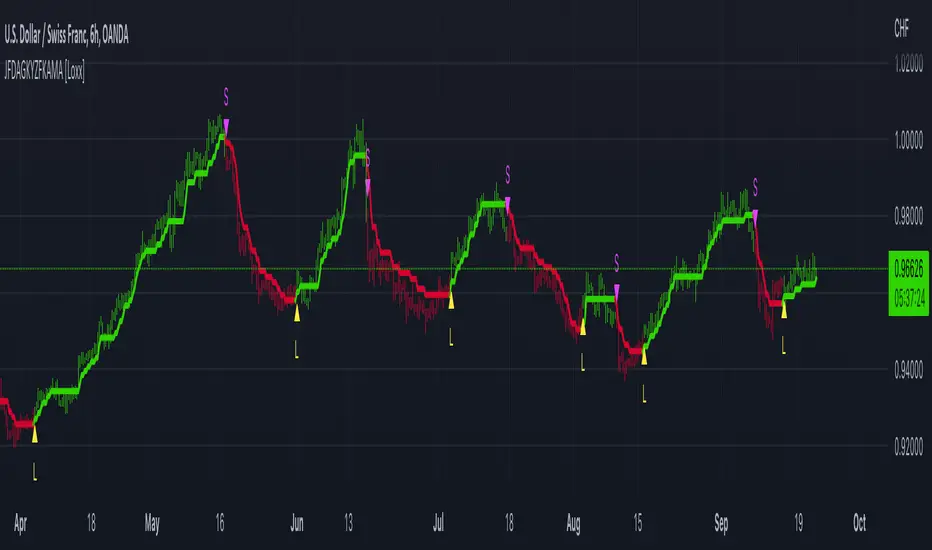
JFD-Adaptive, GKYZ-Filtered KAMA [Loxx]JFD-Adaptive, GKYZ-Filtered KAMA is a Kaufman Adaptive Moving Average with the option to make it Jurik Fractal Dimension Adaptive. This also includes a Garman-Klass-Yang-Zhang Historical Volatility Filter to reduce noise.
What is KAMA?
Developed by Perry Kaufman, Kaufman's Adaptive Moving Average ( KAMA ) is a moving average designed to account for market noise or volatility . KAMA will closely follow prices when the price swings are relatively small and the noise is low. KAMA will adjust when the price swings widen and follow prices from a greater distance. This trend-following indicator can be used to identify the overall trend, time turning points and filter price movements.
What is Jurik Fractal Dimension?
There is a weak and a strong way to measure the random quality of a time series.
The weak way is to use the random walk index ( RWI ). You can download it from the Omega web site. It makes the assumption that the market is moving randomly with an average distance D per move and proposes an amount the market should have changed over N bars of time. If the market has traveled less, then the action is considered random, otherwise it's considered trending.
The problem with this method is that taking the average distance is valid for a Normal (Gaussian) distribution of price activity. However, price action is rarely Normal, with large price jumps occuring much more frequently than a Normal distribution would expect. Consequently, big jumps throw the RWI way off, producing invalid results.
The strong way is to not make any assumption regarding the distribution of price changes and, instead, measure the fractal dimension of the time series. Fractal Dimension requires a lot of data to be accurate. If you are trading 30 minute bars, use a multi-chart where this indicator is running on 5 minute bars and you are trading on 30 minute bars.
What is Garman-Klass-Yang-Zhang Historical Volatility?
Yang and Zhang derived an extension to the Garman Klass historical volatility estimator that allows for opening jumps. It assumes Brownian motion with zero drift. This is currently the preferred version of open-high-low-close volatility estimator for zero drift and has an efficiency of 8 times the classic close-to-close estimator. Note that when the drift is nonzero, but instead relative large to the volatility , this estimator will tend to overestimate the volatility . The Garman-Klass-Yang-Zhang Historical Volatility calculation is as follows:
GKYZHV = sqrt((Z/n) * sum((log(open(k)/close( k-1 )))^2 + (0.5*(log(high(k)/low(k)))^2) - (2*log(2) - 1)*(log(close(k)/open(2:end)))^2))
Included
Alerts
Signals
Loxx's Expanded Source Types
Bar coloring
RSI-Adaptive, GKYZ-Filtered DEMA [Loxx]RSI-Adaptive, GKYZ-Filtered DEMA is a Garman-Klass-Yang-Zhang Historical Volatility Filtered, RSI-Adaptive Double Exponential Moving Average. This is an experimental indicator. The way this is calculated is by turning RSI into an alpha value that is then injected into a DEMA function to output price. Price is then filtered using GKYZ Historical volatility. This process of creating an alpha out of RSI is only relevant to EMA-based moving averages that use an alpha value for it's calculation.
What is Garman-Klass-Yang-Zhang Historical Volatility?
Yang and Zhang derived an extension to the Garman Klass historical volatility estimator that allows for opening jumps. It assumes Brownian motion with zero drift. This is currently the preferred version of open-high-low-close volatility estimator for zero drift and has an efficiency of 8 times the classic close-to-close estimator. Note that when the drift is nonzero, but instead relative large to the volatility , this estimator will tend to overestimate the volatility . The Garman-Klass-Yang-Zhang Historical Volatility calculation is as follows:
GKYZHV = sqrt((Z/n) * sum((log(open(k)/close( k-1 )))^2 + (0.5*(log(high(k)/low(k)))^2) - (2*log(2) - 1)*(log(close(k)/open(2:end)))^2))
Included
Alerts
Signals
Loxx's Expanded Source Types
Bar coloring

Stochastic of Two-Pole SuperSmoother [Loxx]Stochastic of Two-Pole SuperSmoother is a Stochastic Indicator that takes as input Two-Pole SuperSmoother of price. Includes gradient coloring and Discontinued Signal Lines signals with alerts.
What is Ehlers ; Two-Pole Super Smoother?
From "Cycle Analytics for Traders Advanced Technical Trading Concepts" by John F. Ehlers
A SuperSmoother filter is used anytime a moving average of any type would otherwise be used, with the result that the SuperSmoother filter output would have substantially less lag for an equivalent amount of smoothing produced by the moving average. For example, a five-bar SMA has a cutoff period of approximately 10 bars and has two bars of lag. A SuperSmoother filter with a cutoff period of 10 bars has a lag a half bar larger than the two-pole modified Butterworth filter.Therefore, such a SuperSmoother filter has a maximum lag of approximately 1.5 bars and even less lag into the attenuation band of the filter. The differential in lag between moving average and SuperSmoother filter outputs becomes even larger when the cutoff periods are larger.
Market data contain noise, and removal of noise is the reason for using smoothing filters. In fact, market data contain several kinds of noise. I’ll group one kind of noise as systemic, caused by the random events of trades being exercised. A second kind of noise is aliasing noise, caused by the use of sampled data. Aliasing noise is the dominant term in the data for shorter cycle periods.
It is easy to think of market data as being a continuous waveform, but it is not. Using the closing price as representative for that bar constitutes one sample point. It doesn’t matter if you are using an average of the high and low instead of the close, you are still getting one sample per bar. Since sampled data is being used, there are some dSP aspects that must be considered. For example, the shortest analysis period that is possible (without aliasing)2 is a two-bar cycle.This is called the Nyquist frequency, 0.5 cycles per sample.A perfect two-bar sine wave cycle sampled at the peaks becomes a square wave due to sampling. However, sampling at the cycle peaks can- not be guaranteed, and the interference between the sampling frequency and the data frequency creates the aliasing noise.The noise is reduced as the data period is longer. For example, a four-bar cycle means there are four samples per cycle. Because there are more samples, the sampled data are a better replica of the sine wave component. The replica is better yet for an eight-bar data component.The improved fidelity of the sampled data means the aliasing noise is reduced at longer and longer cycle periods.The rate of reduction is 6 dB per octave. My experience is that the systemic noise rarely is more than 10 dB below the level of cyclic information, so that we create two conditions for effective smoothing of aliasing noise:
1. It is difficult to use cycle periods shorter that two octaves below the Nyquist frequency.That is, an eight-bar cycle component has a quantization noise level 12 dB below the noise level at the Nyquist frequency. longer cycle components therefore have a systemic noise level that exceeds the aliasing noise level.
2. A smoothing filter should have sufficient selectivity to reduce aliasing noise below the systemic noise level. Since aliasing noise increases at the rate of 6 dB per octave above a selected filter cutoff frequency and since the SuperSmoother attenuation rate is 12 dB per octave, the Super- Smoother filter is an effective tool to virtually eliminate aliasing noise in the output signal.
What are DSL Discontinued Signal Line?
A lot of indicators are using signal lines in order to determine the trend (or some desired state of the indicator) easier. The idea of the signal line is easy : comparing the value to it's smoothed (slightly lagging) state, the idea of current momentum/state is made.
Discontinued signal line is inheriting that simple signal line idea and it is extending it : instead of having one signal line, more lines depending on the current value of the indicator.
"Signal" line is calculated the following way :
When a certain level is crossed into the desired direction, the EMA of that value is calculated for the desired signal line
When that level is crossed into the opposite direction, the previous "signal" line value is simply "inherited" and it becomes a kind of a level
This way it becomes a combination of signal lines and levels that are trying to combine both the good from both methods.
In simple terms, DSL uses the concept of a signal line and betters it by inheriting the previous signal line's value & makes it a level.
Included:
Bar coloring
Alerts
Signals
Loxx's Expanded Source Types
Adaptive Two-Pole Super Smoother Entropy MACD [Loxx]Adaptive Two-Pole Super Smoother Entropy (Math) MACD is an Ehlers Two-Pole Super Smoother that is transformed into an MACD oscillator using entropy mathematics. Signals are generated using Discontinued Signal Lines.
What is Ehlers; Two-Pole Super Smoother?
From "Cycle Analytics for Traders Advanced Technical Trading Concepts" by John F. Ehlers
A SuperSmoother filter is used anytime a moving average of any type would otherwise be used, with the result that the SuperSmoother filter output would have substantially less lag for an equivalent amount of smoothing produced by the moving average. For example, a five-bar SMA has a cutoff period of approximately 10 bars and has two bars of lag. A SuperSmoother filter with a cutoff period of 10 bars has a lag a half bar larger than the two-pole modified Butterworth filter.Therefore, such a SuperSmoother filter has a maximum lag of approximately 1.5 bars and even less lag into the attenuation band of the filter. The differential in lag between moving average and SuperSmoother filter outputs becomes even larger when the cutoff periods are larger.
Market data contain noise, and removal of noise is the reason for using smoothing filters. In fact, market data contain several kinds of noise. I’ll group one kind of noise as systemic, caused by the random events of trades being exercised. A second kind of noise is aliasing noise, caused by the use of sampled data. Aliasing noise is the dominant term in the data for shorter cycle periods.
It is easy to think of market data as being a continuous waveform, but it is not. Using the closing price as representative for that bar constitutes one sample point. It doesn’t matter if you are using an average of the high and low instead of the close, you are still getting one sample per bar. Since sampled data is being used, there are some dSP aspects that must be considered. For example, the shortest analysis period that is possible (without aliasing)2 is a two-bar cycle.This is called the Nyquist frequency, 0.5 cycles per sample.A perfect two-bar sine wave cycle sampled at the peaks becomes a square wave due to sampling. However, sampling at the cycle peaks can- not be guaranteed, and the interference between the sampling frequency and the data frequency creates the aliasing noise.The noise is reduced as the data period is longer. For example, a four-bar cycle means there are four samples per cycle. Because there are more samples, the sampled data are a better replica of the sine wave component. The replica is better yet for an eight-bar data component.The improved fidelity of the sampled data means the aliasing noise is reduced at longer and longer cycle periods.The rate of reduction is 6 dB per octave. My experience is that the systemic noise rarely is more than 10 dB below the level of cyclic information, so that we create two conditions for effective smoothing of aliasing noise:
1. It is difficult to use cycle periods shorter that two octaves below the Nyquist frequency.That is, an eight-bar cycle component has a quantization noise level 12 dB below the noise level at the Nyquist frequency. longer cycle components therefore have a systemic noise level that exceeds the aliasing noise level.
2. A smoothing filter should have sufficient selectivity to reduce aliasing noise below the systemic noise level. Since aliasing noise increases at the rate of 6 dB per octave above a selected filter cutoff frequency and since the SuperSmoother attenuation rate is 12 dB per octave, the Super- Smoother filter is an effective tool to virtually eliminate aliasing noise in the output signal.
What are DSL Discontinued Signal Line?
A lot of indicators are using signal lines in order to determine the trend (or some desired state of the indicator) easier. The idea of the signal line is easy : comparing the value to it's smoothed (slightly lagging) state, the idea of current momentum/state is made.
Discontinued signal line is inheriting that simple signal line idea and it is extending it : instead of having one signal line, more lines depending on the current value of the indicator.
"Signal" line is calculated the following way :
When a certain level is crossed into the desired direction, the EMA of that value is calculated for the desired signal line
When that level is crossed into the opposite direction, the previous "signal" line value is simply "inherited" and it becomes a kind of a level
This way it becomes a combination of signal lines and levels that are trying to combine both the good from both methods.
In simple terms, DSL uses the concept of a signal line and betters it by inheriting the previous signal line's value & makes it a level.
Included:
Bar coloring
Alerts
Signals
Loxx's Expanded Source Types

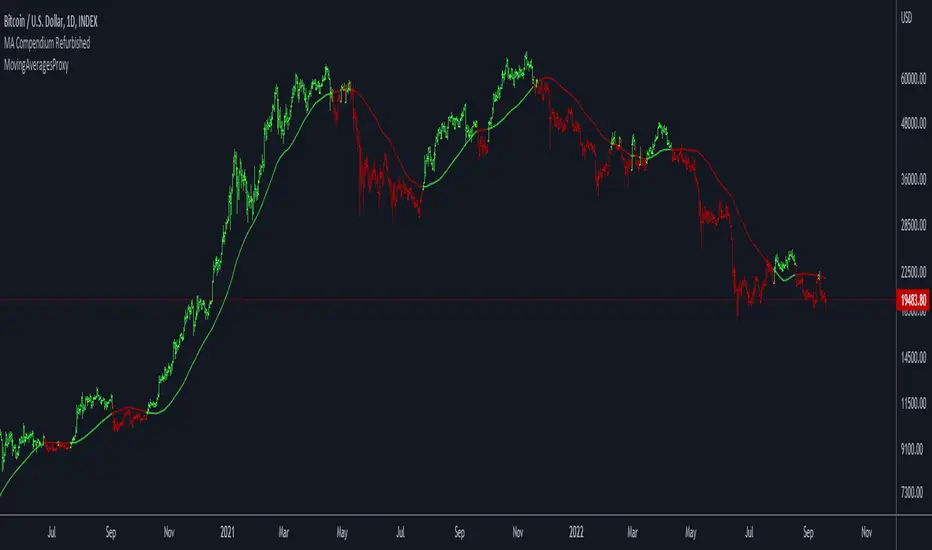
Moving Averages ProxyLibrary "MovingAveragesProxy"
Moving Averages Proxy - Library of all moving averages spread out in different libraries
rvwap(_src, fixedTfInput, minsInput, hoursInput, daysInput, minBarsInput)
Calculates the Rolling VWAP (customized VWAP developed by the team of TradingView)
Parameters:
_src : (float) Source. Default: close
fixedTfInput : (bool) Use a fixed time period. Default: false
minsInput : (int) Minutes. Default: 0
hoursInput : (int) Hours. Default: 0
daysInput : (int) Days. Default: 1
minBarsInput : (int) Bars. Default: 10
Returns: (float) Rolling VWAP
correlationMa(src, len, factor)
Correlation Moving Average
Parameters:
src : (float) Source. Default: close
len : (int) Length
factor : (float) Factor. Default: 1.7
Returns: (float) Correlation Moving Average
regma(src, len, lambda)
Regularized Exponential Moving Average
Parameters:
src : (float) Source. Default: close
len : (int) Length
lambda : (float) Lambda. Default: 0.5
Returns: (float) Regularized Exponential Moving Average
repma(src, len)
Repulsion Moving Average
Parameters:
src : (float) Source. Default: close
len : (int) Length
Returns: (float) Repulsion Moving Average
epma(src, length, offset)
End Point Moving Average
Parameters:
src : (float) Source. Default: close
length : (int) Length
offset : (float) Offset. Default: 4
Returns: (float) End Point Moving Average
lc_lsma(src, length)
1LC-LSMA (1 line code lsma with 3 functions)
Parameters:
src : (float) Source. Default: close
length : (int) Length
Returns: (float) 1LC-LSMA Moving Average
aarma(src, length)
Adaptive Autonomous Recursive Moving Average
Parameters:
src : (float) Source. Default: close
length : (int) Length
Returns: (float) Adaptive Autonomous Recursive Moving Average
alsma(src, length)
Adaptive Least Squares
Parameters:
src : (float) Source. Default: close
length : (int) Length
Returns: (float) Adaptive Least Squares
ahma(src, length)
Ahrens Moving Average
Parameters:
src : (float) Source. Default: close
length : (int) Length
Returns: (float) Ahrens Moving Average
adema(src)
Ahrens Moving Average
Parameters:
src : (float) Source. Default: close
Returns: (float) Moving Average
autol(src, lenDev)
Auto-Line
Parameters:
src : (float) Source. Default: close
lenDev : (int) Length for standard deviation
Returns: (float) Auto-Line
fibowma(src, length)
Fibonacci Weighted Moving Average
Parameters:
src : (float) Source. Default: close
length : (int) Length
Returns: (float) Moving Average
fisherlsma(src, length)
Fisher Least Squares Moving Average
Parameters:
src : (float) Source. Default: close
length : (int) Length
Returns: (float) Moving Average
leoma(src, length)
Leo Moving Average
Parameters:
src : (float) Source. Default: close
length : (int) Length
Returns: (float) Moving Average
linwma(src, period, weight)
Linear Weighted Moving Average
Parameters:
src : (float) Source. Default: close
period : (int) Length
weight : (int) Weight
Returns: (float) Moving Average
mcma(src, length)
McNicholl Moving Average
Parameters:
src : (float) Source. Default: close
length : (int) Length
Returns: (float) Moving Average
srwma(src, length)
Square Root Weighted Moving Average
Parameters:
src : (float) Source. Default: close
length : (int) Length
Returns: (float) Moving Average
EDSMA(src, len)
Ehlers Dynamic Smoothed Moving Average.
Parameters:
src : Series to use ('close' is used if no argument is supplied).
len : Lookback length to use.
Returns: EDSMA smoothing.
dema(x, t)
Double Exponential Moving Average.
Parameters:
x : Series to use ('close' is used if no argument is supplied).
t : Lookback length to use.
Returns: DEMA smoothing.
tema(src, len)
Triple Exponential Moving Average.
Parameters:
src : Series to use ('close' is used if no argument is supplied).
len : Lookback length to use.
Returns: TEMA smoothing.
smma(src, len)
Smoothed Moving Average.
Parameters:
src : Series to use ('close' is used if no argument is supplied).
len : Lookback length to use.
Returns: SMMA smoothing.
hullma(src, len)
Hull Moving Average.
Parameters:
src : Series to use ('close' is used if no argument is supplied).
len : Lookback length to use.
Returns: Hull smoothing.
frama(x, t)
Fractal Reactive Moving Average.
Parameters:
x : Series to use ('close' is used if no argument is supplied).
t : Lookback length to use.
Returns: FRAMA smoothing.
kama(x, t)
Kaufman's Adaptive Moving Average.
Parameters:
x : Series to use ('close' is used if no argument is supplied).
t : Lookback length to use.
Returns: KAMA smoothing.
vama(src, len)
Volatility Adjusted Moving Average.
Parameters:
src : Series to use ('close' is used if no argument is supplied).
len : Lookback length to use.
Returns: VAMA smoothing.
donchian(len)
Donchian Calculation.
Parameters:
len : Lookback length to use.
Returns: Average of the highest price and the lowest price for the specified look-back period.
Jurik(src, len)
Jurik Moving Average.
Parameters:
src : Series to use ('close' is used if no argument is supplied).
len : Lookback length to use.
Returns: JMA smoothing.
xema(src, len)
Optimized Exponential Moving Average.
Parameters:
src : Series to use ('close' is used if no argument is supplied).
len : Lookback length to use.
Returns: XEMA smoothing.
ehma(src, len)
EHMA - Exponential Hull Moving Average
Parameters:
src : Source
len : Period
Returns: Exponential Hull Moving Average (EHMA)
covwema(src, len)
Coefficient of Variation Weighted Exponential Moving Average (COVWEMA)
Parameters:
src : Source
len : Period
Returns: Coefficient of Variation Weighted Exponential Moving Average (COVWEMA)
covwma(src, len)
Coefficient of Variation Weighted Moving Average (COVWMA)
Parameters:
src : Source
len : Period
Returns: Coefficient of Variation Weighted Moving Average (COVWMA)
eframa(src, len, FC, SC)
Ehlrs Modified Fractal Adaptive Moving Average (EFRAMA)
Parameters:
src : Source
len : Period
FC : Lower Shift Limit for Ehlrs Modified Fractal Adaptive Moving Average
SC : Upper Shift Limit for Ehlrs Modified Fractal Adaptive Moving Average
Returns: Ehlrs Modified Fractal Adaptive Moving Average (EFRAMA)
etma(src, len)
Exponential Triangular Moving Average (ETMA)
Parameters:
src : Source
len : Period
Returns: Exponential Triangular Moving Average (ETMA)
rma(src, len)
RMA - RSI Moving average
Parameters:
src : Source
len : Period
Returns: RSI Moving average (RMA)
thma(src, len)
THMA - Triple Hull Moving Average
Parameters:
src : Source
len : Period
Returns: Triple Hull Moving Average (THMA)
vidya(src, len)
Variable Index Dynamic Average (VIDYA)
Parameters:
src : Source
len : Period
Returns: Variable Index Dynamic Average (VIDYA)
zsma(src, len)
Zero-Lag Simple Moving Average (ZSMA)
Parameters:
src : Source
len : Period
Returns: Zero-Lag Simple Moving Average (ZSMA)
zema(src, len)
Zero-Lag Exponential Moving Average (ZEMA)
Parameters:
src : Source
len : Period
Returns: Zero-Lag Exponential Moving Average (ZEMA)
evwma(src, len)
EVWMA - Elastic Volume Weighted Moving Average
Parameters:
src : Source
len : Period
Returns: Elastic Volume Weighted Moving Average (EVWMA)
tt3(src, len, a1_t3)
Tillson T3
Parameters:
src : Source
len : Period
a1_t3 : Tillson T3 Volume Factor
Returns: Tillson T3
gma(src, len)
GMA - Geometric Moving Average
Parameters:
src : Source
len : Period
Returns: Geometric Moving Average (GMA)
wwma(src, len)
WWMA - Welles Wilder Moving Average
Parameters:
src : Source
len : Period
Returns: Welles Wilder Moving Average (WWMA)
cma(src, len)
Corrective Moving average (CMA)
Parameters:
src : Source
len : Period
Returns: Corrective Moving average (CMA)
edma(src, len)
Exponentially Deviating Moving Average (MZ EDMA)
Parameters:
src : Source
len : Period
Returns: Exponentially Deviating Moving Average (MZ EDMA)
rema(src, len)
Range EMA (REMA)
Parameters:
src : Source
len : Period
Returns: Range EMA (REMA)
sw_ma(src, len)
Sine-Weighted Moving Average (SW-MA)
Parameters:
src : Source
len : Period
Returns: Sine-Weighted Moving Average (SW-MA)
mama(src, len)
MAMA - MESA Adaptive Moving Average
Parameters:
src : Source
len : Period
Returns: MESA Adaptive Moving Average (MAMA)
fama(src, len)
FAMA - Following Adaptive Moving Average
Parameters:
src : Source
len : Period
Returns: Following Adaptive Moving Average (FAMA)
hkama(src, len)
HKAMA - Hilbert based Kaufman's Adaptive Moving Average
Parameters:
src : Source
len : Period
Returns: Hilbert based Kaufman's Adaptive Moving Average (HKAMA)
getMovingAverage(type, src, len, lsmaOffset, inputAlmaOffset, inputAlmaSigma, FC, SC, a1_t3, fixedTfInput, daysInput, hoursInput, minsInput, minBarsInput, lambda, volumeWeighted, gamma_aarma, smooth, linweight, volatility_lookback, jurik_phase, jurik_power)
Abstract proxy function that invokes the calculation of a moving average according to type
Parameters:
type : (string) Type of moving average
src : (float) Source of series (close, high, low, etc.)
len : (int) Period of loopback to calculate the average
lsmaOffset : (int) Offset for Least Squares MA
inputAlmaOffset : (float) Offset for ALMA
inputAlmaSigma : (float) Sigma for ALMA
FC : (int) Lower Shift Limit for Ehlrs Modified Fractal Adaptive Moving Average
SC : (int) Upper Shift Limit for Ehlrs Modified Fractal Adaptive Moving Average
a1_t3 : (float) Tillson T3 Volume Factor
fixedTfInput : (bool) Use a fixed time period in Rolling VWAP
daysInput : (int) Days in Rolling VWAP
hoursInput : (int) Hours in Rolling VWAP
minsInput : (int) Minutrs in Rolling VWAP
minBarsInput : (int) Bars in Rolling VWAP
lambda : (float) Regularization Constant in Regularized EMA
volumeWeighted : (bool) Apply volume weighted calculation in selected moving average
gamma_aarma : (float) Gamma for Adaptive Autonomous Recursive Moving Average
smooth : (float) Smooth for Adaptive Least Squares
linweight : (float) Weight for Volume Weighted Moving Average
volatility_lookback : (int) Loopback for Volatility Adjusted Moving Average
jurik_phase : (int) Phase for Jurik Moving Average
jurik_power : (int) Power for Jurik Moving Average
Returns: (float) Moving average
Garman-Klass-Yang-Zhang Historical Volatility Bands [Loxx]Garman-Klass-Yang-Zhang Historical Volatility Bands are constructed using:
Average as the middle line.
Upper and lower bands using the Garman-Klass-Yang-Zhang Historical Volatility Bands for bands calculation.
What is Garman-Klass-Yang-Zhang Historical Volatility?
Yang and Zhang derived an extension to the Garman Klass historical volatility estimator that allows for opening jumps. It assumes Brownian motion with zero drift. This is currently the preferred version of open-high-low-close volatility estimator for zero drift and has an efficiency of 8 times the classic close-to-close estimator. Note that when the drift is nonzero, but instead relative large to the volatility, this estimator will tend to overestimate the volatility. The Garman-Klass-Yang-Zhang Historical Volatility calculation is as follows:
GKYZHV = sqrt((Z/n) * sum((log(open(k)/close(k-1)))^2 + (0.5*(log(high(k)/low(k)))^2) - (2*log(2) - 1)*(log(close(k)/open(2:end)))^2))
The color of the middle line, unlike the bands colors, has 3 colors. When colors of the bands are the same, then the middle line has the same color, otherwise it's white.
Included
Alerts
Signals
Loxx's Expanded Source Types
Bar coloring
Related Indicators
Garman & Klass Estimator Historical Volatility Bands

Garman & Klass Estimator Historical Volatility Bands [Loxx]Garman & Klass Estimator Historical Volatility Bands are constructed using:
Average as the middle line.
Upper and lower bands using the Garman & Klass Estimator Historical Volatility (instead of "regular" Historical Volatility ) for bands calculation.
What is Garman & Klaus Historical Volatility?
Garman Klass is a volatility estimator that incorporates open, low, high, and close prices of a security. The Garman and Klass estimator for estimating historical volatility assumes Brownian motion with zero drift and no opening jumps (i.e. the opening = close of the previous period). This estimator is 7.4 times more efficient than the close-to-close estimator. Garman-Klass volatility extends Parkinson's volatility by taking into account the opening and closing price. As markets are most active during the opening and closing of a trading session, it makes volatility estimation more accurate. Garman and Klass also assumed that the process of price change is a process of continuous diffusion (geometric Brownian motion). However, this assumption has several drawbacks. The method is not robust for opening jumps in price and trend movements. Despite its drawbacks, the Garman-Klass estimator is still more effective than the basic formula since it takes into account not only the price at the beginning and end of the time interval but also intraday price extremums.
The Garman & Klass Estimator is as follows:
GKE = sqrt((Z/n)* sum((0.5*(log(high./low)).^2) - (2*log(2) - 1).*(log(close./open)).^2))
The color of the middle line, unlike the bands colors, has 3 colors. When colors of the bands are the same, then the middle line has the same color, otherwise it's white.
Included
Alerts
Signals
Loxx's Expanded Source Types
Bar coloring
Related indicators:
Parkinson's Historical Volatility Bands
STD/C-Filtered, Truncated Taylor Family FIR Filter [Loxx]STD/C-Filtered, Truncated Taylor Family FIR Filter is a FIR Digital Filter that uses Truncated Taylor Family of Windows. Taylor functions are obtained by adding a weighted-cosine series to a constant (called a pedestal). A simpler form of these functions can be obtained by dropping some of the higher-order terms in the Taylor series expansion. If all other terms, except for the first two significant ones, are dropped, a truncated Taylor function is obtained. This is a generalized window that is expressed as:
(1 + K) / 2 + (1 - K) / 2 * math.cos(2.0 * math.pi *n / N) where 0 ≤ |n| ≤ N/2
Here k can take the values in the range 0≤k≤1. We note that the Hann 0 ≤ |n| ≤ window is a special case of the truncated Taylor family with k = 0 and Rectangular 0 ≤ |n| ≤ window (SMA) is a special case of the truncated Taylor family with k = 1.
Truncated Taylor Family of Windows amplitudes for this indicator with K = 0.5
This indicator also includes Standard Deviation and Clutter filtering.
What is a Standard Devaition Filter?
If price or output or both don't move more than the (standard deviation) * multiplier then the trend stays the previous bar trend. This will appear on the chart as "stepping" of the moving average line. This works similar to Super Trend or Parabolic SAR but is a more naive technique of filtering.
What is a Clutter Filter?
For our purposes here, this is a filter that compares the slope of the trading filter output to a threshold to determine whether to shift trends. If the slope is up but the slope doesn't exceed the threshold, then the color is gray and this indicates a chop zone. If the slope is down but the slope doesn't exceed the threshold, then the color is gray and this indicates a chop zone. Alternatively if either up or down slope exceeds the threshold then the trend turns green for up and red for down. Fro demonstration purposes, an EMA is used as the moving average. This acts to reduce the noise in the signal.
Included
Bar coloring
Loxx's Expanded Source Types
Signals
Alerts

STD-Filtered, Gaussian-Kernel-Weighted Moving Average [Loxx]STD-Filtered, Gaussian-Kernel-Weighted Moving Average is a moving average that weights price by using a Gaussian kernel function to calculate data points. This indicator also allows for filtering both source input price and output signal using a standard deviation filter.
Purpose
This purpose of this indicator is to take the concept of Kernel estimation and apply it in a way where instead of predicting past values, the weighted function predicts the current bar value at each bar to create a moving average that is suitable for trading. Normally this method is used to create an array of past estimators to model past data but this method is not useful for trading as the past values will repaint. This moving average does NOT repaint, however you much allow signals to close on the current bar before taking the signal. You can compare this to Nadaraya-Watson Estimator wherein they use Nadaraya-Watson estimator method with normalized kernel weighted function to model price.
What are Kernel Functions?
A kernel function is used as a weighing function to develop non-parametric regression model is discussed. In the beginning of the article, a brief discussion about properties of kernel functions and steps to build kernels around data points are presented.
Kernel Function
In non-parametric statistics, a kernel is a weighting function which satisfies the following properties.
A kernel function must be symmetrical. Mathematically this property can be expressed as K (-u) = K (+u). The symmetric property of kernel function enables its maximum value (max(K(u)) to lie in the middle of the curve.
The area under the curve of the function must be equal to one. Mathematically, this property is expressed as: integral −∞ + ∞ ∫ K(u)d(u) = 1
Value of kernel function can not be negative i.e. K(u) ≥ 0 for all −∞ < u < ∞.
Kernel Estimation
In this article, Gaussian kernel function is used to calculate kernels for the data points. The equation for Gaussian kernel is:
K(u) = (1 / sqrt(2pi)) * e^(-0.5 *(j / bw)^2)
Where xi is the observed data point. j is the value where kernel function is computed and bw is called the bandwidth. Bandwidth in kernel regression is called the smoothing parameter because it controls variance and bias in the output. The effect of bandwidth value on model prediction is discussed later in this article.
Included
Loxx's Expanded Source types
Signals
Alerts
Bar coloring
RedK Chop & Breakout Scout (C&B_Scout)The RedK Chop & Breakout Scout (C&BS or just CBS) is a centered oscillator that helps traders identify when the price is in a chop zone, where it's recommended to avoid trading or exit existing trades - and helps identify (good & tradeable) price breakouts.
i receive many questions asking for simple ways to identify chops .. Here's one way we can do that.
(This is work in progress - i was exploring with the idea, and wasn't sure how interesting other may find it. )
Quick Intro:
==================
Quick techno piece: This concept is similar to a Stochastic Oscillator - with the main difference being that we're utilizing units of ATR (instead of a channel width) to calculate the main indicator line - which will then lead to a non-restricted oscillator (rather than a +/- 100%) - given that ATR changes with the underlying and the timeframe, among other variables.
to make this easy, and avoid a lot of technical speak in the next part, :) i created (on the top price panel) the same setup that the C&B Scout represents as a lower-panel indicator.
So as you read below, please look back and compare what C&BS is doing in its lower panel, with how the price is behaving on the price chart.
how this works
========================
- To identify chops and breakouts, we need to first agree on a definition that we will use for these terms.
- for the sake of this exercise, let's agree that the price is in a chop zone, as long as the price is moving within a certain distance from a "price baseline" of choice ( which we can adjust based on the underlying, the volatility, the timeframe, the trading style..etc)
- when the price moves out of that chop zone, we consider this a breakout
- Now not all breakouts are "good" = they need to at least happen in the direction of the longer term trend. In this case, we can apply a long Moving Average to act as a filter - and consider breakouts to be "good" if they are in the same direction as the filter line
- With the above background in mind, we establish a price baseline (as you see on the top panel, this is based on the midline of a Donchian Channel - but we can use other slow moving averages in future versions)
- we will decide how far above/below that baseline is considered to be "chop zone" - we do this in terms of units of Average True Range (ATR) - using ATR here is valuable for so many reasons, most of all, how it adjusts to timeframe and volatility of underlying.
- The C&B Scout line simply calculates how far the price is above/below the baseline in terms of "ATR units". and shows how that value compares to our own definition of a "chop zone"
- so as long as the price is within the chop zone, the CBS line will be inside the shaded area - and when the price "breaks out" of the chop zone, the CBS line will also breakout (or down) from the chop zone.
- C&B Scout will give a visual clue to help take trades in the direction of the prevailing trend - the chop zone is green when the price is in "long mode", as in, the price is above the filter line - and will be red when we are in "short mode" - so the price is below the filter line. in green mode, we should only consider breakouts to the upside, and ignore breakouts to the downside (or breakdowns) - in red mode, we should only consider breakouts to the downside., and ignore the ones to the upside.
- i added some examples of "key actions" on the chart to help explain the approach here further.
Usage & settings Notes:
========================
- even though for many traders this will be a basic concept/setup, i still highly suggest you spend time getting used to how it works/reacts and adjusting the settings to suit your own trading style, timeframe, tolerance, what you trade....etc
- for example, if i am a conservative trader, i may consider any price movement within 1 x ATR above and below the baseline to be in "chop" (ATR Channel width = 2 x ATR) - and i want to only take trades when the price moves outside of that range *and* in the direction of the prevailing trend
- An aggressive trader may use a smaller ATR-based value, say 0.5 x ATR above/below the baseline, as their chop zone.
- A swing trader may use a shorter filter line and focus on the CBS line crossing the 0 line.
- .... and so on.
- Also note that the "tradeable" signal is when the CBS line "exits" the chop zone (upward on green background, or downward on red background) - however, an aggressive trader may take the crossing of the CBS line with the 0 line as the signal to open a trade.
- As usual please do not use this indicator "in isolation" and ensure you have other confirming signals from your setups before trading.
conclusion
===========
As i mentioned, this is really a simple concept - and i'm a big fan of those :) -- and there's so much that could be done to expand around it (add more visuals/colors, add alerts, add options for ATR calculation, Filter line calculations, baseline..etc) - but with this v1.0, i wanted to share this initially and see how much interest and how valuable fellow traders find it, before playing any further with it. so please be generous with your comments.

Dynamic Zone Range on OMA [Loxx]Dynamic Zone Range on OMA is an One More Moving Average oscillator with Dynamic Zones.
What is the One More Moving Average (OMA)?
The usual story goes something like this : which is the best moving average? Everyone that ever started to do any kind of technical analysis was pulled into this "game". Comparing, testing, looking for new ones, testing ...
The idea of this one is simple: it should not be itself, but it should be a kind of a chameleon - it should "imitate" as much other moving averages as it can. So the need for zillion different moving averages would diminish. And it should have some extra, of course:
The extras:
it has to be smooth
it has to be able to "change speed" without length change
it has to be able to adapt or not (since it has to "imitate" the non-adaptive as well as the adaptive ones)
The steps:
Smoothing - compared are the simple moving average (that is the basis and the first step of this indicator - a smoothed simple moving average with as little lag added as it is possible and as close to the original as it is possible) Speed 1 and non-adaptive are the reference for this basic setup.
Speed changing - same chart only added one more average with "speeds" 2 and 3 (for comparison purposes only here)
Finally - adapting : same chart with SMA compared to one more average with speed 1 but adaptive (so this parameters would make it a "smoothed adaptive simple average") Adapting part is a modified Kaufman adapting way and this part (the adapting part) may be a subject for changes in the future (it is giving satisfactory results, but if or when I find a better way, it will be implemented here)
Some comparisons for different speed settings (all the comparisons are without adaptive turned on, and are approximate. Approximation comes from a fact that it is impossible to get exactly the same values from only one way of calculation, and frankly, I even did not try to get those same values).
speed 0.5 - T3 (0.618 Tilson)
speed 2.5 - T3 (0.618 Fulks/Matulich)
speed 1 - SMA , harmonic mean
speed 2 - LWMA
speed 7 - very similar to Hull and TEMA
speed 8 - very similar to LSMA and Linear regression value
Parameters:
Length - length (period) for averaging
Source - price to use for averaging
Speed - desired speed (i limited to -1.5 on the lower side but it even does not need that limit - some interesting results with speeds that are less than 0 can be achieved)
Adaptive - does it adapt or not
Variety Moving Averages w/ Dynamic Zones contains 33 source types and 35+ moving averages with double dynamic zones levels.
What are Dynamic Zones?
As explained in "Stocks & Commodities V15:7 (306-310): Dynamic Zones by Leo Zamansky, Ph .D., and David Stendahl"
Most indicators use a fixed zone for buy and sell signals. Here’ s a concept based on zones that are responsive to past levels of the indicator.
One approach to active investing employs the use of oscillators to exploit tradable market trends. This investing style follows a very simple form of logic: Enter the market only when an oscillator has moved far above or below traditional trading lev- els. However, these oscillator- driven systems lack the ability to evolve with the market because they use fixed buy and sell zones. Traders typically use one set of buy and sell zones for a bull market and substantially different zones for a bear market. And therein lies the problem.
Once traders begin introducing their market opinions into trading equations, by changing the zones, they negate the system’s mechanical nature. The objective is to have a system automatically define its own buy and sell zones and thereby profitably trade in any market — bull or bear. Dynamic zones offer a solution to the problem of fixed buy and sell zones for any oscillator-driven system.
An indicator’s extreme levels can be quantified using statistical methods. These extreme levels are calculated for a certain period and serve as the buy and sell zones for a trading system. The repetition of this statistical process for every value of the indicator creates values that become the dynamic zones. The zones are calculated in such a way that the probability of the indicator value rising above, or falling below, the dynamic zones is equal to a given probability input set by the trader.
To better understand dynamic zones, let's first describe them mathematically and then explain their use. The dynamic zones definition:
Find V such that:
For dynamic zone buy: P{X <= V}=P1
For dynamic zone sell: P{X >= V}=P2
where P1 and P2 are the probabilities set by the trader, X is the value of the indicator for the selected period and V represents the value of the dynamic zone.
The probability input P1 and P2 can be adjusted by the trader to encompass as much or as little data as the trader would like. The smaller the probability, the fewer data values above and below the dynamic zones. This translates into a wider range between the buy and sell zones. If a 10% probability is used for P1 and P2, only those data values that make up the top 10% and bottom 10% for an indicator are used in the construction of the zones. Of the values, 80% will fall between the two extreme levels. Because dynamic zone levels are penetrated so infrequently, when this happens, traders know that the market has truly moved into overbought or oversold territory.
Calculating the Dynamic Zones
The algorithm for the dynamic zones is a series of steps. First, decide the value of the lookback period t. Next, decide the value of the probability Pbuy for buy zone and value of the probability Psell for the sell zone.
For i=1, to the last lookback period, build the distribution f(x) of the price during the lookback period i. Then find the value Vi1 such that the probability of the price less than or equal to Vi1 during the lookback period i is equal to Pbuy. Find the value Vi2 such that the probability of the price greater or equal to Vi2 during the lookback period i is equal to Psell. The sequence of Vi1 for all periods gives the buy zone. The sequence of Vi2 for all periods gives the sell zone.
In the algorithm description, we have: Build the distribution f(x) of the price during the lookback period i. The distribution here is empirical namely, how many times a given value of x appeared during the lookback period. The problem is to find such x that the probability of a price being greater or equal to x will be equal to a probability selected by the user. Probability is the area under the distribution curve. The task is to find such value of x that the area under the distribution curve to the right of x will be equal to the probability selected by the user. That x is the dynamic zone.
Included
4 signal types
Bar coloring
Alerts
Channels fill

Pips-Stepped, OMA-Filtered, Ocean NMA [Loxx]Pips-Stepped, OMA-Filtered, Ocean NMA is an Ocean Natural Moving Average Filter that is pre-filtered using One More Moving Average (OMA) and then post-filtered using stepping by pips. This indicator is quadruple adaptive depending on the settings used:
OMA adaptive
Hiekin-Ashi Better Source Input Adaptive (w/ AMA of Kaufman smoothing)
Ocean NMA adaptive
Pips adaptive
What is the One More Moving Average (OMA)?
The usual story goes something like this : which is the best moving average? Everyone that ever started to do any kind of technical analysis was pulled into this "game". Comparing, testing, looking for new ones, testing ...
The idea of this one is simple: it should not be itself, but it should be a kind of a chameleon - it should "imitate" as much other moving averages as it can. So the need for zillion different moving averages would diminish. And it should have some extra, of course:
The extras:
it has to be smooth
it has to be able to "change speed" without length change
it has to be able to adapt or not (since it has to "imitate" the non-adaptive as well as the adaptive ones)
The steps:
Smoothing - compared are the simple moving average (that is the basis and the first step of this indicator - a smoothed simple moving average with as little lag added as it is possible and as close to the original as it is possible) Speed 1 and non-adaptive are the reference for this basic setup.
Speed changing - same chart only added one more average with "speeds" 2 and 3 (for comparison purposes only here)
Finally - adapting : same chart with SMA compared to one more average with speed 1 but adaptive (so this parameters would make it a "smoothed adaptive simple average") Adapting part is a modified Kaufman adapting way and this part (the adapting part) may be a subject for changes in the future (it is giving satisfactory results, but if or when I find a better way, it will be implemented here)
Some comparisons for different speed settings (all the comparisons are without adaptive turned on, and are approximate. Approximation comes from a fact that it is impossible to get exactly the same values from only one way of calculation, and frankly, I even did not try to get those same values).
speed 0.5 - T3 (0.618 Tilson)
speed 2.5 - T3 (0.618 Fulks/Matulich)
speed 1 - SMA , harmonic mean
speed 2 - LWMA
speed 7 - very similar to Hull and TEMA
speed 8 - very similar to LSMA and Linear regression value
Parameters:
Length - length (period) for averaging
Source - price to use for averaging
Speed - desired speed (i limited to -1.5 on the lower side but it even does not need that limit - some interesting results with speeds that are less than 0 can be achieved)
Adaptive - does it adapt or not
What is the Ocean Natural Moving Average?
Created by Jim Sloman, the NMA is a moving average that automatically adjusts to volatility without being programed to do so. For more info, read his guide "Ocean Theory, an Introduction"
What's the difference between this indicator and Sloan's original NMA?
Sloman's original calculation uses the natural log of price as input into the NMA , here we use moving averages of price as the input for NMA . As such, this indicator applies a certain level of Ocean theory adaptivity to moving average filter used.
Included:
Bar coloring
Alerts
Expanded source types
Signals
Flat-level coloring for scalping

FunctionKellyCriterionLibrary "FunctionKellyCriterion"
Kelly criterion methods.
the kelly criterion helps with the decision of how much one should invest in
a asset as long as you know the odds and expected return of said asset.
simplified(win_p, rr)
simplified version of the kelly criterion formula.
Parameters:
win_p : float, probability of winning.
rr : float, reward to risk rate.
Returns: float, optimal fraction to risk.
usage:
simplified(0.55, 1.0)
partial(win_p, loss_p, win_rr, loss_rr)
general form of the kelly criterion formula.
Parameters:
win_p : float, probability of the investment returns a positive outcome.
loss_p : float, probability of the investment returns a negative outcome.
win_rr : float, reward on a positive outcome.
loss_rr : float, reward on a negative outcome.
Returns: float, optimal fraction to risk.
usage:
partial(0.6, 0.4, 0.6, 0.1)
from_returns(returns)
Calculate the fraction to invest from a array of returns.
Parameters:
returns : array trade/asset/strategy returns.
Returns: float, optimal fraction to risk.
usage:
from_returns(array.from(0.1,0.2,0.1,-0.1,-0.05,0.05))
final_f(fraction, max_expected_loss)
Final fraction, eg. if fraction is 0.2 and expected max loss is 10%
then you should size your position as 0.2/0.1=2 (leverage, 200% position size).
Parameters:
fraction : float, aproximate percent fraction invested.
max_expected_loss : float, maximum expected percent on a loss (ex 10% = 0.1).
Returns: float, final fraction to invest.
usage:
final_f(0.2, 0.5)
hpr(fraction, trade, biggest_loss)
Holding Period Return function
Parameters:
fraction : float, aproximate percent fraction invested.
trade : float, profit or loss in a trade.
biggest_loss : float, value of the biggest loss on record.
Returns: float, multiplier of effect on equity so that a win of 5% is 1.05 and loss of 5% is 0.95.
usage:
hpr(fraction=0.05, trade=0.1, biggest_loss=-0.2)
twr(returns, rr, eps)
Terminal Wealth Relative, returns a multiplier that can be applied
to the initial capital that leadds to the final balance.
Parameters:
returns : array, list of trade returns.
rr : float , reward to risk rate.
eps : float , minimum resolution to void zero division.
Returns: float, optimal fraction to invest.
usage:
twr(returns=array.from(0.1,-0.2,0.3), rr=0.6)
ghpr(returns, rr, eps)
Geometric mean Holding Period Return, represents the average multiple made on the stake.
Parameters:
returns : array, list of trade returns.
rr : float , reward to risk rate.
eps : float , minimum resolution to void zero division.
Returns: float, multiplier of effect on equity so that a win of 5% is 1.05 and loss of 5% is 0.95.
usage:
ghpr(returns=array.from(0.1,-0.2,0.3), rr=0.6)
run_coin_simulation(fraction, initial_capital, n_series, n_periods)
run multiple coin flipping (binary outcome) simulations.
Parameters:
fraction : float, fraction of capital to bet.
initial_capital : float, capital at the start of simulation.
n_series : int , number of simulation series.
n_periods : int , number of periods in each simulation series.
Returns: matrix(n_series, n_periods), matrix with simulation results per row.
usage:
run_coin_simulation(fraction=0.1)
run_asset_simulation(returns, fraction, initial_capital)
run a simulation over provided returns.
Parameters:
returns : array, trade, asset or strategy percent returns.
fraction : float , fraction of capital to bet.
initial_capital : float , capital at the start of simulation.
Returns: array, array with simulation results.
usage:
run_asset_simulation(returns=array.from(0.1,-0.2,0.-3,0.4), fraction=0.1)
strategy_win_probability()
calculate strategy() current probability of positive outcome in a trade.
strategy_avg_won()
calculate strategy() current average won on a trade with positive outcome.
strategy_avg_loss()
calculate strategy() current average lost on a trade with negative outcome.
