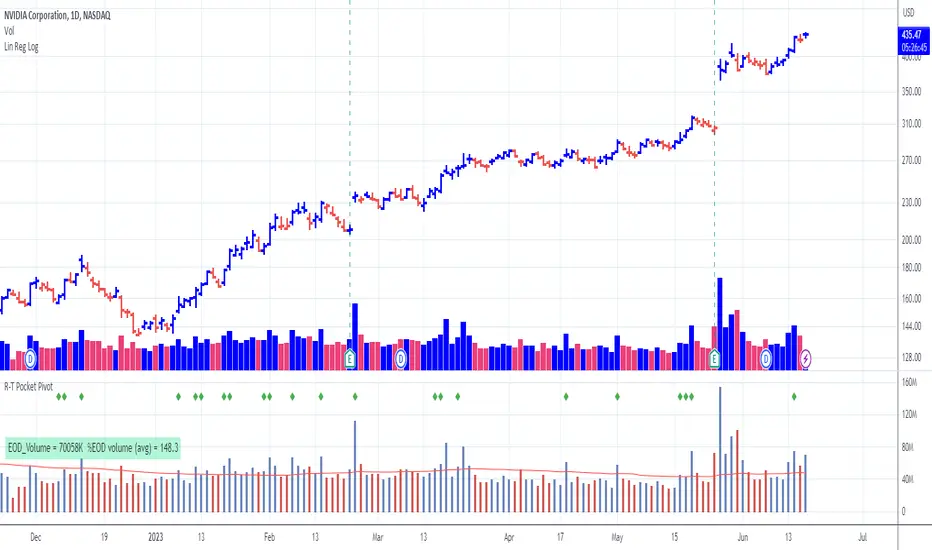
Pocket Pivot with extrapolated Volume and Moving AveragesThe script shows historical pocket pivots, much as other scripts with a green diamond shape on the volume pane.
When the market is open, the current bar, however, is extrapolated to the end of the day using a sixth-order polynomial.
Thus real-time pocket pivots are shown. To work properly, the user must input a time-zone offset parameter; the default is west coast USA.
Time-zone offset is -12 hours to +12 hours compared to the NYSE exchange time zone (USA west coast: -3.)
The volume extrapolation polynomial is based on a historical NASDAQ intraday volume model developed locally by a team.
Only ten-day lookback pocket pivots are computed as defined initially by Dr. Chris Kacher. (The default lookback can be changed by the user.)
Only pocket pivots are shown where the low of the daily bar is within user-defined proximity to the 50-day moving average or 10-day moving average (for continuation pocket pivots.)
חפש סקריפטים עבור "12月4号是什么星座"
Full Volatility Statistics and Forecast
This is a tool designed to translate the data from the expected volatility of different assets, such as for example VIX, which measures the volatility of SP500 index.
Once get the data from the volatility asset we want to measure(for this test I have used VIX), we are going to translate it the required timeframe expected move by dividing the initial value into :
252 = if we want to use the daily timeframe, since there are ~252 aproximative daily trading days
52 = if we want to use the weekly timeframe, since there 52 trading weeks in a year
12 = if we want to use the monthly timeframe, since there are 12 months in a year
For this example I have used 252 with the daily timeframe.
In this scenario, we can see that we had 5711 total cnadles which we analysed, and in this case, we had 942 crosses, where the daily movement ended up either above or below the channel made from the opening daily candle value + expected movement from the volatility, giving as a total of 16.5% of occurances that volatility was higher than expected, and in 83.5% of the times, we can see that the price stayed within our channel.
At the same time, we can see that we had 6 max losses in a row ( OUT) AND 95 max wins in a row (IN), and at the same time in those moments when the volatility crosses happen we had a 0.51% avg movements when the top crossed happened, and 0.67% avg movements when the bot happened.
Lastly on the second part of the panel, we had E which means the expected movement of today, for example it has 61.056$ , so lets say price opened on 4083, our top is 4083 + 61 and our bot is 4083 - 61 ( giving us the daily channel). At continuation we can see that overall the avg bull candle os 0.714% and avg bear candle was 0.805% .
I hope this tool will help you with your future analysis and trades !
If you have any questions please let me know !

lower_tf█ OVERVIEW
This library is a Pine programmer’s tool containing functions to help those who use the request.security_lower_tf() function. Its `ltf()` function helps translate user inputs into a lower timeframe string usable with request.security_lower_tf() . Another function, `ltfStats()`, accumulates statistics on processed chart bars and intrabars.
█ CONCEPTS
Chart bars
Chart bars , as referred to in our publications, are bars that occur at the current chart timeframe, as opposed to those that occur at a timeframe that is higher or lower than that of the chart view.
Intrabars
Intrabars are chart bars at a lower timeframe than the chart's. Each 1H chart bar of a 24x7 market will, for example, usually contain 60 intrabars at the LTF of 1min, provided there was market activity during each minute of the hour. Mining information from intrabars can be useful in that it offers traders visibility on the activity inside a chart bar.
Lower timeframes (LTFs)
A lower timeframe is a timeframe that is smaller than the chart's timeframe. This framework exemplifies how authors can determine which LTF to use by examining the chart's timeframe. The LTF determines how many intrabars are examined for each chart bar; the lower the timeframe, the more intrabars are analyzed.
Intrabar precision
The precision of calculations increases with the number of intrabars analyzed for each chart bar. As there is a 100K limit to the number of intrabars that can be analyzed by a script, a trade-off occurs between the number of intrabars analyzed per chart bar and the chart bars for which calculations are possible.
█ `ltf()`
This function returns a timeframe string usable with request.security_lower_tf() . It calculates the returned timeframe by taking into account a user selection between eight different calculation modes and the chart's timeframe. You send it the user's selection, along with the text corresponding to the eight choices from which the user has chosen, and the function returns a corresponding LTF string.
Because the function processes strings and doesn't require recalculation on each bar, using var to declare the variable to which its result is assigned will execute the function only once on bar zero and speed up your script:
var string ltfString = ltf(ltfModeInput, LTF1, LTF2, LTF3, LTF4, LTF5, LTF6, LTF7, LTF8)
The eight choices users can select from are of two types: the first four allow a selection from the desired amount of chart bars to be covered, the last four are choices of a fixed number of intrabars to be analyzed per chart bar. Our example code shows how to structure your input call and then make the call to `ltf()`. By changing the text associated with the `LTF1` to `LTF8` constants, you can tailor it to your preferences while preserving the functionality of `ltf()` because you will be sending those string constants as the function's arguments so it can determine the user's selection. The association between each `LTFx` constant and its calculation mode is fixed, so the order of the arguments is important when you call `ltf()`.
These are the first four modes and the `LTFx` constants corresponding to each:
Covering most chart bars (least precise) — LTF1
Covers all chart bars. This is accomplished by dividing the current timeframe in seconds by 4 and converting that number back to a string in timeframe.period format using secondsToTfString() . Due to the fact that, on premium subscriptions, the typical historical bar count is between 20-25k bars, dividing the timeframe by 4 ensures the highest level of intrabar precision possible while achieving complete coverage for the entire dataset with the maximum allowed 100K intrabars.
Covering some chart bars (less precise) — LTF2
Covering less chart bars (more precise) — LTF3
These levels offer a stepped LTF in relation to the chart timeframe with slightly more, or slightly less precision. The stepped lower timeframe tiers are calculated from the chart timeframe as follows:
Chart Timeframe Lower Timeframe
Less Precise More Precise
< 1hr 1min 1min
< 1D 15min 1min
< 1W 2hr 30min
> 1W 1D 60min
Covering the least chart bars (most precise) — LTF4
Analyzes the maximum quantity of intrabars possible by using the 1min LTF, which also allows the least amount of chart bars to be covered.
The last four modes allow the user to specify a fixed number of intrabars to analyze per chart bar. Users can choose from 12, 24, 50 or 100 intrabars, respectively corresponding to the `LTF5`, `LTF6`, `LTF7` and `LTF8` constants. The value is a target; the function will do its best to come up with a LTF producing the required number of intrabars. Because of considerations such as the length of a ticker's session, rounding of the LTF to the closest allowable timeframe, or the lowest allowable timeframe of 1min intrabars, it is often impossible for the function to find a LTF producing the exact number of intrabars. Requesting 100 intrabars on a 60min chart, for example, can only produce 60 1min intrabars. Higher chart timeframes, tickers with high liquidity or 24x7 markets will produce optimal results.
█ `ltfStats()`
`ltfStats()` returns statistics that will be useful to programmers using intrabar inspection. By analyzing the arrays returned by request.security_lower_tf() in can determine:
• intrabarsInChartBar : The number of intrabars analyzed for each chart bar.
• chartBarsCovered : The number of chart bars where intrabar information is available.
• avgIntrabars : The average number of intrabars analyzed per chart bar. Events like holidays, market activity, or reduced hours sessions can cause the number of intrabars to vary, bar to bar.
The function must be called on each bar to produce reliable results.
█ DEMONSTRATION CODE
Our example code shows how to provide users with an input from which they can select a LTF calculation mode. If you use this library's functions, feel free to reuse our input setup code, including the tooltip providing users with explanations on how it works for them.
We make a simple call to request.security_lower_tf() to fetch the close values of intrabars, but we do not use those values. We simply send the returned array to `ltfStats()` and then plot in the indicator's pane the number of intrabars examined on each bar and its average. We also display an information box showing the user's selection of the LTF calculation mode, the resulting LTF calculated by `ltf()` and some statistics.
█ NOTES
• As in several of our recent publications, this script uses secondsToTfString() to produce a timeframe string in timeframe.period format from a timeframe expressed in seconds.
• The script utilizes display.data_window and display.status_line to restrict the display of certain plots.
These new built-ins allow coders to fine-tune where a script’s plot values are displayed.
• We implement a new recommended best practice for tables which works faster and reduces memory consumption.
Using this new method, tables are declared only once with var , as usual. Then, on bar zero only, we use table.cell() calls to populate the table.
Finally, table.set_*() functions are used to update attributes of table cells on the last bar of the dataset.
This greatly reduces the resources required to render tables. We encourage all Pine Script™ programmers to do the same.
Look first. Then leap.
█ FUNCTIONS
The library contains the following functions:
ltf(userSelection, choice1, choice2, choice3, choice4, choice5, choice6, choice7, choice8)
Selects a LTF from the chart's TF, depending on the `userSelection` input string.
Parameters:
userSelection : (simple string) User-selected input string which must be one of the `choicex` arguments.
choice1 : (simple string) Input selection corresponding to "Least precise, covering most chart bars".
choice2 : (simple string) Input selection corresponding to "Less precise, covering some chart bars".
choice3 : (simple string) Input selection corresponding to "More precise, covering less chart bars".
choice4 : (simple string) Input selection corresponding to "Most precise, 1min intrabars".
choice5 : (simple string) Input selection corresponding to "~12 intrabars per chart bar".
choice6 : (simple string) Input selection corresponding to "~24 intrabars per chart bar".
choice7 : (simple string) Input selection corresponding to "~50 intrabars per chart bar".
choice8 : (simple string) Input selection corresponding to "~100 intrabars per chart bar".
Returns: (simple string) A timeframe string to be used with `request.security_lower_tf()`.
ltfStats()
Returns statistics about analyzed intrabars and chart bars covered by calls to `request.security_lower_tf()`.
Parameters:
intrabarValues : (float [ ]) The ID of a float array containing values fetched by a call to `request.security_lower_tf()`.
Returns: A 3-element tuple: [ (series int) intrabarsInChartBar, (series int) chartBarsCovered, (series float) avgIntrabars ].

TARVIS Labs - Bitcoin Macro Bottom/Top SignalsSCRIPT DESCRIPTION
This is a script specifically written to help provide indicators from a macro view. This script is best run on the 1 day interval on Bitstamp's $BTCUSD chart. It helps indicate when to accumulate bitcoin, and when its in a bull run when there are local tops, strong top warnings, and a signal to exit a bull run. This is described further below.
If you don't have interest in trading on the way to the top I suggest turning off the following indicators in the settings of the indicator:
- Opportunity To Buy Back In Indicator
- Local Top Near Bull Run Top Indicator
ACCUMULATION ZONE INDICATOR - LIGHT GREEN
Description
When we look at the history of Bitcoin every bottom has crossed below the 100 week EMA. Once it does its accompanied by hash ribbon cross with miner capitulation. After that is the prime time to accumulate as theres a clearer signal the bottom is in. Specifically, a signal to look for is the 14 day MACD/signal cross and the 14 day MACD continuing to stay above the signal until the price returns above the 100 week EMA. This is prime accumulation territory.
Strategy for Usage
A good strategy to use when accumulating the bottom is dollar-cost averaging over a 30 day period. The accumulation zone can last longer than 30 days but 30 days is a good range of time to DCA.
STRONG BUY IN ACCUMULATION ZONE INDICATOR - DARK GREEN
Description
We can add to the bottoming signal by looking for post-downtrend reversals inside the bottoming signal. We do this by using a 9/19 daily cross.
Strategy for Usage
These post-downtrend reversals can potentially provide better targeted days for accumulation than the broader bottoming signal and can be used to add more on that day than on an average day for the dollar cost average strategy. Say for example, use 1/3 of funds on these days rather than 1/30th.
OPPORTUNITY TO BUY BACK IN INDICATOR - BLUE
Description
When the 1d 18 EMA > 1d 63 EMA and the 12/52 1d crosses. These together provide good buy opportunities to buy bitcoin.
Strategy for Usage
If you happen to find yourself out of the market from your own TA or a trade, this signal can provide a buy opportunity to reenter the market if you're out of it.
BULL RUN LOCAL TOP INDICATOR - ORANGE
Description
We will similarly use the 100 week EMA to determine trend reversal into a bull run. When we see the 100 week EMA uptrending, we can begin to look for local tops using the 9/19 daily MACD/signal bearish cross along with the 12 EMA having a negative slope, which could be the beginning signal for a local top.
Strategy for Usage
This is a rather light indicator, but can be used in tandem with your own technical analysis to determine if you want to reenter after you exit from its signal.
LOCAL TOP NEAR BULL RUN TOP INDICATOR - RED
Description
When the 100 week EMA is in an uptrend we can look for significant loss of momentum in order to determine if a local top is in near a bull run top. Similar to the Bull Run Local Top Indicator, this strategy uses a MACD/signal cross but instead uses the 30/65 day EMAs.
Strategy for Usage
Ideally the right strategy to use here is to exit the market when this indicator starts. When the indicator ends if the "End of Bull Run Indicator" is not showing on the chart you can buy back into the market.
TOP IS LIKELY IN INDICATOR
Description
When the 100 week EMA is in a very strong uptrend and the 9/19 weekly MACD/signal bearish cross occurs, and the 63 EMA begins to downtrend.
Strategy for Usage
This signal typically accompanies the "Local Top Near Bull Run Top Indicator" therefore if you're following the strategy you would likely already be out of the market, but if you're not and this signal fires its a strong signal the top is in and we're likely going to start seeing a strong retrace. This is typically right before we see the "End of Bull Run Indicator". There is only one occurrence where it wasn't followed by a large drop & the "End of Bull Run Indicator" and that was in the 2017 bull run where there were many strong retracements post local top. The likelihood we see that again is low, but if it were to happen you can buy back into the market when the "Top is Likely In Indicator" and the "Local Top Near Bull Run Top Indicator" are not firing.
TOP IS LIKELY IN INDICATOR
Description
When the 100 week EMA is in a strong uptrend and the 9/19 weekly MACD/signal bearish cross occurs, and the 63 EMA begins to downtrend.
Strategy for Usage
This signal typically accompanies the "Local Top Near Bull Run Top Indicator" therefore if you're following the strategy you would likely already be out of the market, but if you're not and this signal fires its a strong signal the top is in and we're likely going to start seeing a strong retrace. This is typically right before we see the "End of Bull Run Indicator". There is only one occurrence where it wasn't followed by a large drop & the "End of Bull Run Indicator" and that was in the 2017 bull run where there were many strong retracements post local top. The likelihood we see that again is low, but if it were to happen you can buy back into the market when the "Top is Likely In Indicator" and the "Local Top Near Bull Run Top Indicator" are not firing.
END OF BULL RUN INDICATOR
Description
When the 100 week EMA is in an uptrend and the 1d 18 EMA crosses the 1d 63 EMA.
Strategy for Usage
When the 100 week EMA is a strong uptrend and the 18/63 cross occurs the top is very likely in. It has occurred in every bull run top leading to the bear market.

Dynamic Relative StrengthMainly this indicator is a Relative strength indicator which tells us about the strength of a scrip as compared to an index . That is it outperforming the index or underperforming . Outperformance signifies Strength and Under performance signifies Weakness .Inspired from Bharat trader's Relative Strength of a stock , but changing the period for all time frames is a hassle so i have set 10 period for Monthly and 52 period for Weekly. As for monthly we need around 10 months data or we can use 12 as 1 year has 12 months but 10 works best . used 52 period for Weekly time frame because there are 52 weeks in a year. These values are by default dynamically applied to the indicator when weekly or monthly timeframes are chosen . Daily Period can be chosen as per anyone's need . As can be seen in provided screenshot , that the stock has recently started gaining strength on weekly a compared to Small cap100 index . So we can conclude that it has more strength than the overall index it is representing so more chances of outperformance will be there.

The Investment ClockThe Investment Clock was most likely introduced to the general public in a research paper distributed by Merrill Lynch. It’s a simple yet useful framework for understanding the various stages of the US economic cycle and which asset classes perform best in each stage.
The Investment Clock splits the business cycle into four phases, where each phase is comprised of the orientation of growth and inflation relative to their sustainable levels:
Reflation phase (6:01 to 8:59): Growth is sluggish and inflation is low. This phase occurs during the heart of a bear market. The economy is plagued by excess capacity and falling demand. This keeps commodity prices low and pulls down inflation. The yield curve steepens as the central bank lowers short-term rates in an attempt to stimulate growth and inflation. Bonds are the best asset class in this phase.
Recovery phase (9:01 to 11:59): The central bank’s easing takes effect and begins driving growth to above the trend rate. Though growth picks up, inflation remains low because there’s still excess capacity. Rising growth and low inflation are the Goldilocks phase of every cycle. Stocks are the best asset class in this phase.
Overheat phase(12:01 to 2:59): Productivity growth slows and the GDP gap closes causing the economy to bump up against supply constraints. This causes inflation to rise. Rising inflation spurs the central banks to hike rates. As a result, the yield curve begins flattening. With high growth and high inflation, stocks still perform but not as well as in recovery. Volatility returns as bond yields rise and stocks compete with higher yields for capital flows. In this phase, commodities are the best asset class.
Stagflation phase (3:01 to 5:59): GDP growth slows but inflation remains high (sidenote: most bear markets are preceded by a 100%+ increase in the price of oil which drives inflation up and causes central banks to tighten). Productivity dives and a wage-price spiral develops as companies raise prices to protect compressing margins. This goes on until there’s a steep rise in unemployment which breaks the cycle. Central banks keep rates high until they reign in inflation. This causes the yield curve to invert. During this phase, cash is the best asset.
Additional notes from Merrill Lynch:
Cyclicality: When growth is accelerating (12 o'clock), Stocks and Commodities do well. Cyclical sectors like Tech or Steel outperform. When growth is slowing (6 o'clock), Bonds, Cash, and defensives outperform.
Duration: When inflation is falling (9 o'clock), discount rates drop and financial assets do well. Investors pay up for long duration Growth stocks. When inflation is rising (3 o'clock), real assets like Commodities and Cash do best. Pricing power is plentiful and short-duration Value stocks outperform.
Interest Rate-Sensitives: Banks and Consumer Discretionary stocks are interest-rate sensitive “early cycle” performers, doing best in Reflation and Recovery when central banks are easing and growth is starting to recover.
Asset Plays: Some sectors are linked to the performance of an underlying asset. Insurance stocks and Investment Banks are often bond or equity price sensitive, doing well in the Reflation or Recovery phases. Mining stocks are metal price-sensitive, doing well during an Overheat.
About the indicator:
This indicator suggests iShares ETFs for sector rotation analysis. There are likely other ETFs to consider which have lower fees and are outperforming their sector peers.
You may get errors if your chart is set to a different timeframe & ticker other than 1d for symbol/tickers GDPC1 or CPILFESL.
Investment Clock settings are based on a "sustainable level" of growth and inflation, which are each slightly subjective depending on the economist and probably have changed since the last time this indicator was updated. Hence, the sustainable levels are customizable in the settings. When I was formally educated I was trained to use average CPI of 3.1% for financial planning purposes, the default for the indicator is 2.5%, and the Medium article backtested and optimized a 2% sustainable inflation rate. Again, user-defined sustainable growth and rates are slightly subjective and will affect results.
I have not been trained or even had much experience with MetaTrader code, which is how this indicator was originally coded. See the original Medium article that inspired this indicator if you want to audit & compare code.
Hover over info panel for detailed information.
Features: Advanced info panel that performs Investment Clock analysis and offers additional hover info such as sector rotation suggestions. Customizable sustainable levels, growth input, and inflation input. Phase background coloring.
⚠ DISCLAIMER: Not financial advice. Not a trading system. DYOR. I am not affiliated with Medium, Macro Ops, iShares, or Merrill Lynch.
About the Author: I am a patent-holding inventor, a futures trader, a hobby PineScripter, and a former FINRA Registered Representative.

ka66: Auto-Guppy Multiple Moving Average (GMMA)This implements a Guppy Multiple Moving Average (GMMA) with the following twists, which may be a feature or a bug, depending on your perspective:
For both fast and slow group of MAs, only a starting MA (the fastest in that group) is specified.
For either group, a configurable factor is set, which will be used to calculate subsequent MAs.
Automatically selects colours as gradients within a configurable colour range, clearly differentiating between the short-term and long-term groups of averages.
Use Weighted Moving Average (WMAs) as the averaging mechanism. More on this later.
For example, if in the fast group, we start with MA 3, and a factor of 2, then the 6 MAs in the group will be: 3, 6, 12, 24, 48, 96.
The calculated lookbacks are displayed on a table on the top-right, in case further indicators need to be calculated based on these values.
Use of WMAs : This is an annoyance of the implementation: As I use arrays to store lookback calculations (12 of them, individual variables would be a pani to work with!), getting these back out of the array returns a series rather than a simple value. For some unfathomable reason, PineScript doesn't allow copying/conversion of these into a simple value. To add insult to the injury, a bunch of moving averaging functions (e.g.: ta.ema, ta.hma) only work with simple int lookback values. Go figure. SMAs and WMAs are the two that allow series lookback values, and WMAs are less laggy than SMAs but remain smooth, so WMAs it is!

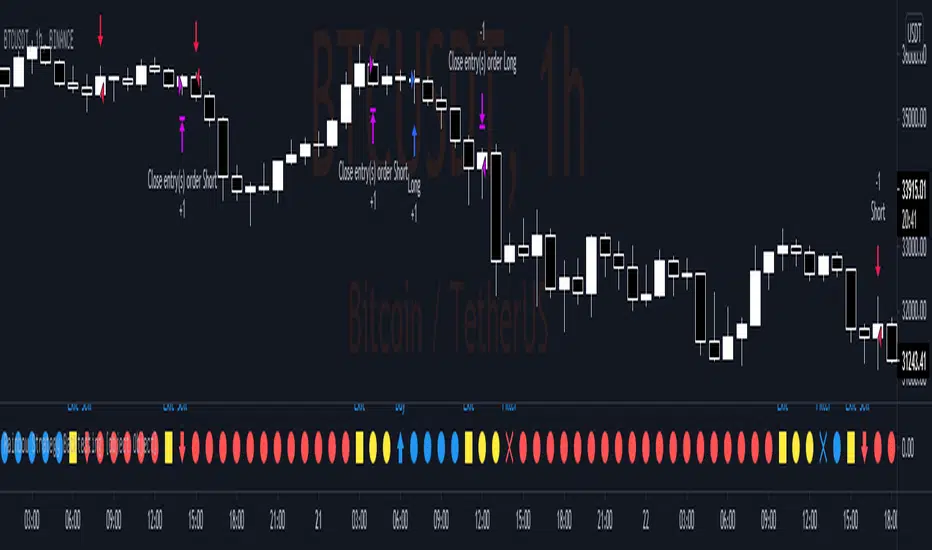
Buy/Sell on the levelsThis script is generally
My describe is:
There are a lot of levels we would like to buy some crypto.
When the price has crossed the level-line - we buy, but only if we have the permission in array(2)
When we have bought the crypto - we lose the permission for buy for now(till we will sell it on the next higher level)
When we sell some crypto(on the buying level + 1) we have the permission again.
There also are 2 protect indicators. We can buy if these indicators both green only(super trend and PIVOT )
Jun 12
Release Notes: Hello there,
Uncomment this section before use for real trade:
if array.get(price_to_sellBue, i) >= open and array.get(price_to_sellBue, i) <= close// and
//direction < 0 and permission_for_buy != 0
Here is my script.
In general - this is incredible simple script to use and understand.
First of all You can see this script working with only long orders, it means we going to get money if crypto grows only. Short orders we need to close the position on time.
In this script we buy crypto and sell with step 1% upper.
You can simply change the step by changing the price arrays.
Please note, if You want to see where the levels of this script is You Have to copy the next my indicator called LEVEL 1%
In general - if the price has across the price-level we buy some crypto and loose permission for buying for this level till we sell some crypto. There is ''count_of_orders" array field with value 2. When we bought some crypto the value turns to 0. 0 means not allowed to by on this level!!! The script buy if the bar is green only(last tick).
The script check every level(those we can see in "price_to_sellBue" array).
If the price across one of them - full script runs. After buying(if it possible) we check is there any crypto for sell on the level.
We check all levels below actual level( of actual level - ''i'' than we check all levels from 0 to i-1).
If there is any order that has value 0 in count of orders and index <= i-1 - we count it to var SELL amount and in the end of loop sell all of it.
Pay attention - it sells only if price across the level with red bar AND HAS ORDERS TO SELL WHICH WAS BOUGHT BELOW!!!
In Strategy tester it shows not-profitables orders sometimes, because if You have old Long position - it sells it first. First in - first out.
If the price goes down for a long time and You sell after 5 buys You sell the first of it with the highest value.
There is 2 protection from horrible buying in this strategy. The first one - Supertrend. If the supertrend is red - there is no permission for buy.
The second one - something between PIVOT and supertrend but with switcher.
If the price across last minimum - switcher is red - no permission for buy and the actual price becomes last minimum . The last maximum calculated for last 100 bars.
When the price across last maximum - switcher is green, we can buy. The last minimum calculation for last 100 bars, last maximum is actual price.
This two protections will save You from buying if price get crash down.
Enjoy my script.
Should You need the code or explanation, You have any ideas how to improve this crypt, contact me.
Vladyslav.
Jun 12
Release Notes: Here has been uncommented the protection for buy in case of price get down.
5 hours ago
Release Notes: Changed rages up to actual price to make it work

sm trend analyzer█ OVERVIEW
This script is intended to provide full time frame continuity information for almost all time frames (3, 5, 15, 30, 60, 4H, Day, Week, Month, Quarter, Year)
When added, the script provides a visual indicator/table to the bottom right of the screen to view the different performance at each time frame.
----------
Output
Time Frames: 3min, 5min, 15min, 30min, 60min, 4 Hour, Day, Week, Month Quarter, Year
Time Frame Labels: 3, 5, 15, 30, H, 4H, D, W, M, Q, Y
Colors: Will display the colors in RED if it's a down time frame (close/current < prior close) or a GREEN if it's a up time frame (close/current > prior close), the color will be more opaque/the opacity will increase the stronger it's levels are for the time frame.
Percentage: The percentages will also display, to give you a quick visual indicator or how strong a time frame is one way or the other.
Best Practices
----------
Had to decouple this from the other scripts because TV limits how much you can plot/show
May be a little slow at times, analyzing a lot of time periods/data be patient.
Used to indicate who is in control, buyers or sellers.
Jul 28, 2021
Release Notes: Fix study name, add some padding (high percentages are hard to get one the whole table)
Jul 28, 2021
Release Notes: Add more space... fix logic. It's open and close not close and prior close for FTC.
Jul 28, 2021
Release Notes: Set the width to ensure the whole percentage is shown. Also stack the cells (2 rows of 6) so it's more compressed and easier to read. Added in the 2H indicator as well.
Aug 2, 2021
Release Notes: Changes: added the ability to disable/hide each box and the ability to change the time frame of each box. The boxes are sequentially numbered, 1 - 12, left to right, top to bottom. So the first box, or 1, would be the top left, 2 would be the next box, all the way to 12 at the bottom right.

Ribbon Relative Strength IndexDescription
Ribbon RSI is the base on of the original RSI.
In RSI (dark color) and RSI-base MA (light color), we added short (12-day) and long (26-day) periods to show these crossovers, including crossovers between the RSI and the RSI-base MA, We've also added a trend period (50-day) RSI section that shows this section in the background.
And because Stochastic is a momentum indicator as well. It is therefore included as a guide to support RSI in another way.
How to Setting
— You can adjust the Short (12 days), Long (26 days) and Trend (50 days) periods from Settings: Input page in the RSI Setting section.
— You can adjust the RSI-base MA interval (9 days) on the Settings: Input page in the MA Setting section.
— You can display the lines of RSI, RSI-base MA at Setting: Style in RSI…
— You can display the Stochastic lines on the Settings: Style page in the Stochastic…

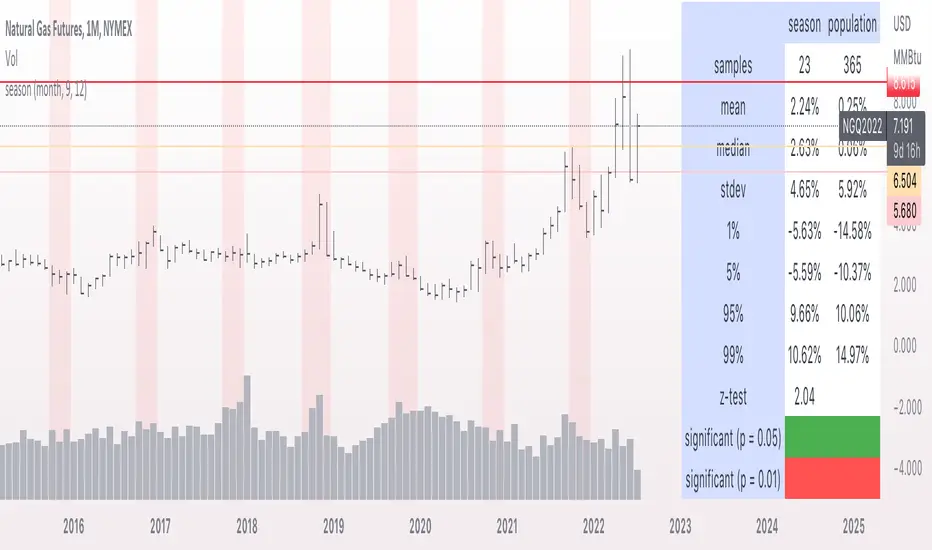
seasonThis script is meant to help verify the existence of a seasonal effect in asset returns, using a Z-test. There are three steps:
1. Think of a way to identify a season. The available methods are: by month, by week of the year, by day of the month, by day of the week, by hour of the day, and by minute of the hour.
2. Set the chart to the unit of your season. For example, if you want to check whether a crop commodity's harvest season has a seasonal implication, select "month". If you want to investigate the exchange's opening or close, select "hour".
3. Using the inputs, select the unit (e.g. "month", "dayofweek", "hour", etc.) and the range that identifies the season. The example natural gas chart has set "start" to 8 and "end" to 12 for September through December.
The test logic is as follows:
The "season" you select has a fixed length; for example, months eight through twelve has a length of four. This length is used to compute a sample mean, which is the mean return of all September-December periods in the chart. It is also used to calculate the mean/stdev of every other four-month period in the chart history. The latter is considered the "population." Using a Z-test, the script scores the difference between the sample returns and the population returns, and displays the results at two levels of significance (P = 0.05 and P = 0.01). The null hypothesis is "there is no difference between the seasonal periods and the population of ordinary periods". If the Z-score is sufficiently large or small, we can reject the null hypothesis and say that there is a seasonal effect at the given level of confidence. The output table will show green for a rejection of the null hypothesis (meaning there is a seasonal effect) or red of acceptance (there is no seasonal effect).
The seasonal periods that you have defined will be highlighted on the chart, so you can make sure they are correct. Additionally, the output table shows the mean, median, standard deviation, and top and bottom percentiles for both the seasonal and population samples.
Many news sites, twitter feeds, influences, etc. enjoy posting statistics about past returns, like "the stock market has gone up on this day 85 out of the past 100 years" and so on. Unfortunately, these posts don't tell you that many of these statistics are meaningless, as even totally random price fluctuations will cause many such interesting figures to occur. This script provides a limited means of testing some such seasonal effects so you can see if they are probably just random, or if they may have some meaning.
Note that Tradingview seems to use 1-based indexing for daily or higher timeframes, and 0-based indexing for intraday timeframes:
Months: 1-12
Weeks: 1-52
Days (of month): 1-31
Days (of week): 1-7
Hours (of day): 0-23
Minutes (of hour): 0-59
KINSKI Multi Trend OscillatorThe Multi Trend Oscillator is a tool that combines the ratings of several indicators to facilitate the search for profitable trades. I was inspired by the excellent indicator "Technical Ratings" from Team TradingView to create an alternative with a technically new approach. Therefore, it is not a modified copy of the original, but newly conceived and implemented.
The recommendations of the indicator are based on the calculated ratings from the different indicators included in it. The special thing here is that all settings for the individual indicators can be changed according to your own needs and displayed as a histogram and MA line. This provides an excellent visual control of your own settings. Alarms are also triggered.
Criteria for determining the rating
Relative Strength Index (RSI)
Buy - Crossover oversold level and indicator < oversold level and rising
Sell - Crossunder oversold level and indicator >= oversold level and falling
Neutral - neither Buy nor Sell
Relative Strength Index (RSI) Laguerre
Buy - Crossover Oversold Level and Indicator < Oversold Level and rising
Sell - Crossunder oversold level and indicator >= oversold level and falling
Neutral - neither Buy nor Sell
Noise free Relative Strength Index (RSX)
Buy - Crossover Oversold Level and Indicator < Oversold Level and rising
Sell - Crossunder oversold level and indicator >= oversold level and falling
Neutral - neither Buy nor Sell
Money Flow Index (MFI)
Buy - Crossover Oversold Level and Indicator < Oversold Level and rising
Sell - Crossunder oversold level and indicator >= oversold level and falling
Neutral - neither Buy nor Sell
Commodity Channel Index (CCI)
Buy - Crossover Oversold Level and Indicator < Oversold Level and rising
Sell - Crossunder oversold level and indicator >= oversold level and falling
Neutral - neither Buy nor Sell
Moving Average Convergence/Divergence (MACD)
Buy - values of the main line > values of the signal line and rising
Sell - values of the main line < values of the signal line and falling
Neutral - neither Buy nor Sell
Klinger
Buy - indicator >= 0 and rising
Sell - indicator < 0 and falling
Neutral - neither Buy nor Sell
Average Directional Index (ADX)
Buy - indicator > 20 and +DI line crosses over the -DI line and rising
Sell - indicator > 20 and +DI line crosses below the -DI line and falling
Neutral - neither Buy nor Sell
Awesome Oscillator
Buy - Crossover 0 and values are greater than 0, or exceed the zero line
Sell - Crossunder 0 and values are lower than 0, or fall below the zero line
Neutral - neither Buy nor Sell
Ultimate Oscillator
Buy - Crossover oversold level and indicator < oversold level and rising
Sell - Crossunder oversold level and indicator >= oversold level and falling
Neutral - neither Buy nor Sell
Williams Percent Range
Buy - Crossover Oversold Level and Indicator < Oversold Level and rising
Sell - Crossunder Oversold Level and Indicator >= Oversold Level and falling
Neutral - neither Buy nor Sell
Momentum
Buy - Crossover 0 and indicator levels rising
Sell - Crossunder 0 and indicator values falling
Neutral - neither Buy nor Sell
Total Ratings
The numerical value of the rating "Sell" is 0, "Neutral" is 0 and "Buy" is 1. The total rating is calculated as the average of the ratings of the individual indicators and are determined according to the following criteria:
MaxCount = 12 (depending on whether other oscillators are added).
CompareSellStrong = MaxCount * 0.3
CompareMid = MaxCount * 0.5
CompareBuyStrong = MaxCount * 0.7
value <= CompareSellStrong - Strong Sell
value < CompareMid and value > CompareSellStrong - Sell
value == 6 - Neutral
value > CompareMid and value < CompareBuyStrong - Buy
value >= CompareBuyStrong - Strong Buy
Understanding the results
The Multi Trend Oscillator is designed so that its values fluctuate between 0 and currently 12 (maximum number of integrated indicators). Its values are displayed as a histogram with green, red and gray bars. The bars are gray when the value of the indicator is at half of the number of indicators used, currently 12. Increasingly saturated green bars indicate increasing values above 6, and increasingly saturated red bars indicate increasingly decreasing values below 6.
The table at the end of the histogram shows details (can be activated in the settings) about the overall rating and the individual indicators. Its color is determined by the rating value: gray for neutral, green for buy or strong buy, red for sell or strong sell.
The following alarms are triggered:
Multi Trend Oscillator: Sell
Multi Trend Oscillator: Strong Sell
Multi Trend Oscillator: Buy
Multi Trend Oscillator: Strong Buy

SuperTrend OptimizerHello!
This indicator attempts to optimize Supertrend parameters. To achieve this, 102 parameter combinations are tested concurrently - the top three performers are listed in descending order.
Parameters,
Factor: Changes to this parameter shifts the tested factor range. For instance, increasing the factor measure from 3.00 to 3.01 (+0.01) will remove 3.00 from the tested range - this setting controls the lower threshold of the range. The upper threshold, in all instances, is the lower Factor threshold + 3.3 (i.e. 3.0(lower) - 6.3(upper), 4.0(lower) - 7.3(upper), 2.5(lower) - 5.8(upper))
ATR period: Changes to this parameter shifts the tested ATR period range. For instance, increasing the ATR measure from 10 to 11 (+1) will remove 10 from the tested range - this setting controls the lower threshold of the range. The upper threshold, in all instances, is the lower threshold + 2 (i.e. 10(lower) - 12(upper), 11(lower) - 13(upper), 9(lower), - 11(upper))
The Factor parameter is modifiable to any positive decimal number; the ATR parameter is modifiable to any positive integer. Changing either parameter shifts the tested parameter combination range. Both parameters can be changed in the settings, to which you control the lower threshold of the range. If, for instance, you were to change the Factor measurement from 3.0 to 4.1 (+1.1) the 4.0 Factor measurement, and all Factor measures less than 4.0, will be excluded from the performance test.
Consequently, a Supertrend test will be performed with a Factor of 4.1 and an ATR period of 10 (default). This test repeats at 0.1 Factor intervals and 1.0 ATR intervals.
Therefore, assume you modify the Factor lower threshold to 3.1 and the ATR lower threshold to 10. The indicator will test three Supertrend systems with a Factor of 3.1 and an ATR period of 10.. then 11.. 12, then three systems with a Factor of 3.2 and an ATR period of 10.. then 11.. 12... until (lower Factor threshold + 3.3) and (lower ATR threshold + 2) are tested... which in this example is... a Factor of 6.4 and an ATR period of 12.
The tested Factor range and ATR range are displayed in a bottom right table alongside the top performing parameter combinations.
Of course, you can change the the lower thresholds, which means you can test numerous Supertrend parameter combinations! However, no greater than 102 parameter combinations will be tested simultaneously; the best performing Supertrend parameters are plotted on the chart automatically.
I will be working on this indicator more tomorrow! Let me know if you have questions or anything you would like included!
(I of course added something fun in the script. Be sure to try it with bar replay!)

200DMA last DOM - ajhImplements and backtests a simple 200 day moving average trend following rules based on last day of month to limits trades to 12 per year.
From the book : 5 BEST Moving Average Strategies (That beat buy and hold) by Steve Burns and Holly Burns
Click on the cog to set the input date range eg; 2000-01-01 to 2016-12-31
The book back tested SP500 returns from 2000-2016 317% using this method vs 125% buy and hold only with less drawdown.
Simple 200 day moving average test and trading on last day of month.
(you may find it trades on next available day close to end of month as not all dates can be traded weekends etc..)
Rules are ;
1. if last day of month and stock over 200 day moving average, then go long 100%
2. if last day of month and stock under 200 day moving average, then close long 100% and goto cash.
Aims to miss market declines and keep you long for upside.
Note: Have found doesn't work well in choppy markets moving sideways like the FTSE100 for same period 2000-2016 and causes losses. Also for many stocks.

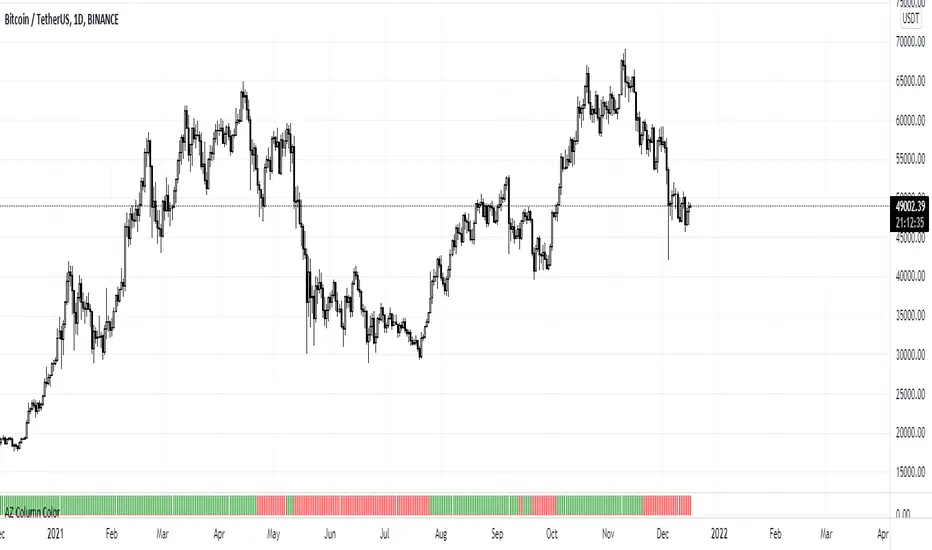
AZ Column ColorThis indicator is based on ema cross-over (12,26).
In Thailand, the ema 12,26 Cross over is well known as the CDC-ACTION ZONE indicator.
.
The definition of a bullish trend in this indicator is when the fast ema crosses up the slow ema .
The definition of a bearish trend is when the fast ema crosses down the slow ema .
.
When fast ema is over slow ema the column will show in a green column and when fast ema is below slow ema the column will show in a red column.
.
I have made this indicator for use with CDC-ACTION ZONE.
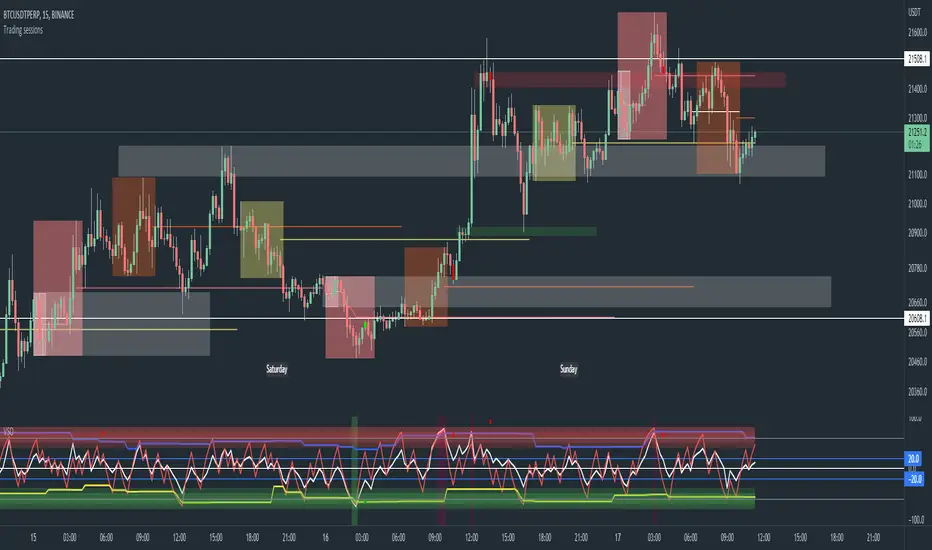
Trading sessions, Ichimoku and Classic Pivots█ OVERVIEW
This a self contained intraday trading style for crypto/forex made to be on and traded on 15-min.
This Script Creates a box around each major session to a trading range, include highlights for the first 12 15-min candles, classic Pivot points and ichimoku cloud.
█ CONCEPTS
1 — Session boxes and ranges are based of the times from Steve from Beat the market maker, and you have the option in setting to have an extension for the high/low until the start of the next box calculation.
2 — 12 candle window, this marks the first 3 hours after a open;
The first hour - stop hunt
The second hour - big moves
The third hour - tend continuation or reversal
3 — The Days of the weeks are labelled and coloured;
Weekends are in grey, ideally no trade days.
Monday, Tuesday, Thursday are green, to mark the week days
Wednesday is red to be mindful of mid week reversal
Friday is red to mark the end of week
4 — Ichimoku cloud, by default the only thing visible is the kumo cloud, but in setting you can turn the line back on. Ichimoku proves a great mark for areas to look for support and resistances.
5 — Lastly, you have classic pivots, by default they are extend to the right and on weekly, Each level act as support and resistance. Look for Bullish momentum at R3 for a larger moves to the upside.
Ichimoku and the pivot are here mainly for when you want to do higher time frame analysis.
█ OTHER SECTIONS
• HOW TO USE
Example of a trade
**Key thing to remember is London will set the high in a down trend and the low in an up trend
you can see the first hour look for stops and stopped at 50% of the range set coming into the session, the second hour a big move to the down side hitting 200% expansion then the third hour reversal stopping wick up then
back down from from London low. before continuing down.
• LIMITATIONS: I have not test this on Stock, as I have a different strategies for those market
• NOTES : I know a lot of people have moving averages on their chart, I have another separate one with all MA types, and it something that will not fit into one script, Other things you can add with this Bollinger bands, and
fib tool with 50%, 100%, 150% and 200%
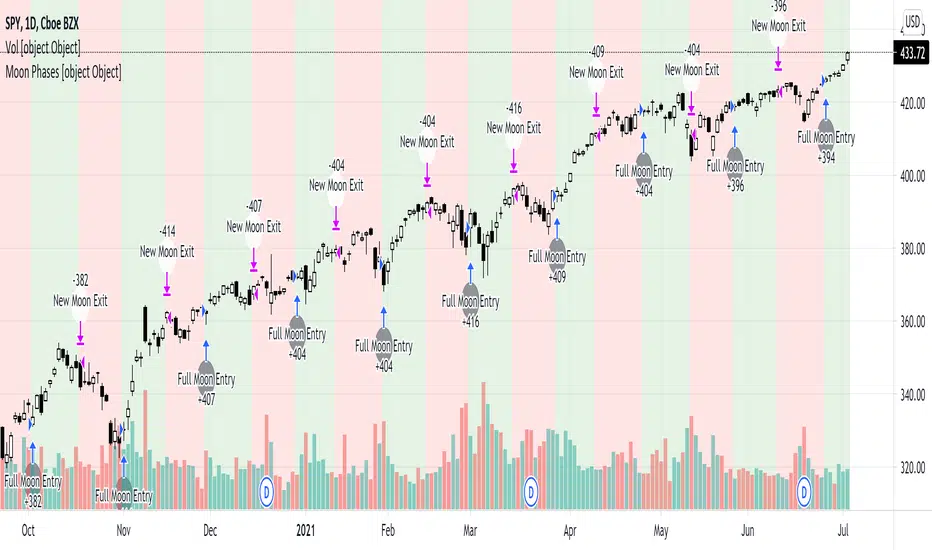
Moon Phases Strategy 2015 till 2021Moon Phases Strategy
Thank you to Author: Dustin Drummond for allowing me to use his Moon Phase strategy code and modify it. I wanted to test out the accuracy of the moon phase. And I could not have done it without his code
It was created to test the Moon Phase theory compared to just a buy and hold strategy.
It buys on full Moon and sells on the new moon. I also have added the ability to add stop loss and target profit if anyone wants to tinker with it. This strategy uses hard-coded dates from 1/1/2015 until 12/31/2021 only! Any dates outside of that range need to be added manually in the code or it will not work.
I may or may not update this so please don't be upset if it stops working after 12/31/2021.
Feel free to use any part of this code and please let me know if you can improve on this strategy.
Result:
50% accurate using data from 2015 till today.
I find a buy and hold strategy to have outperformed the moon phase.
It does have its value. It might be used as a confluence with other established indicators.

RSI Candle with Advanced RSI fomulaRSI Advanced
As the period value is longer than 14, the RSI value sticks to the value of 50 and becomes useless.
Also, when the period value is less than 14, it moves excessively, so it is difficult for us to see the movement of the RSI.
So, using the period value and the RSI value as variables, I tried to make it easier to identify the RSI value through a new function expression.
This is how RSI Advanced was developed.
Period values below 14 reduce the volatility of RSI, and period values greater than 14 allow wider fluctuations, allowing overbought and oversold zones to work properly and give you a better view of the trend.
I also changed the RSI by applying the appropriate function expression so that the RSI with a period value of 168 (=14*12) on a 5 minute timeframe has the same value as the RSI on a 60 minute timeframe with a period value of 14.
As another example, an RSI with a period value of 56 (=14*4) in a 15-minute time frame has the same value as an RSI with a period value of 14 in a 60-minute time frame.
Compare the difference in the RSI with a period value of 200 in the snapshot.
------------------------------------------------------------------------------------------
RSI Candlestick
RSI derives its value using only the closing price as a variable. I solved the RSI equation in reverse and tried to include the high and low prices of candlesticks in the equation.
As a result, 'if the high or low was the closing price, the value of RSI would be like this' was implemented. Just like when a candle comes down after setting a high price, an upper tail is formed when RSI Candle goes down after setting a high price!!
In divergence, we had to look only at the relationship between closing prices, but if we use RSI candles, we can find divergences in highs and highs, and lows and lows.
Then enjoy my RSI!
----------------------------------------------------------------------------------------
RSI Advanced
기간값이 14보다 길어질수록 RSI값은 50값에 달라붙게되어서 쓸모가 없어집니다.
또 기간값이 14보다 줄어들수록 과도하게 움직여서 우리는 RSI의 움직임을 보기가 힘듭니다.
그래서 기간 값과 RSI 값을 변수로 사용하여 새로운 함수 식을 통해 RSI 값을 식별하기 편하도록 해보았습니다.
이렇게 RSI Advanced가 개발되었습니다.
기간값이 14보다 낮으면 rsi의 변동폭이 줄어들고, 기간값이 14보다 크면 변동폭이 넓어져 과매수 및 과매도 영역이 제대로 작동하여 추세를 더 잘 볼 수 있습니다.
또한 저는 5분 타임프레임의 기간값이 168(=14*12)인 RSI가 주기 값이 14인 60분 타임프레임의 RSI와 동일한 값을 갖도록 적절한 함수 표현식을 적용하여 RSI를 변경했습니다.
다른 예로, 15분 시간 프레임에서 기간값이 56(=14*4)인 RSI는 60분 시간 프레임의 기간값이 14인 RSI와 동일한 값을 갖습니다.
기간값이 200인 RSI의 차이를 스냅샷에서 비교해보십시오.
-----------------------------
RSI Candlestick
RSI는 종가만을 변수로 사용하여 값을 도출해냅니다. 저는 RSI 식을 역으로 풀어내어서 캔들스틱의 고가와 저가를 식에 포함시켜보았습니다.
결과적으로, '만약 고가나 저가가 종가였다면 RSI의 값이 이럴것이다'를 구현해내었습니다. 캔들이 고가를 찍고 내려오면 윗꼬리가 생기듯 RSI Candle에서도 고가를 찍고 내려오면 윗꼬리가 생기는겁니다!!
다이버전스 또한 원래는 종가끼리의 관계만 봐야했지만 RSI 캔들을 이용한다면 고가와 고가, 저가와 저가에서도 다이버전스를 발견할 수 있습니다.
그럼 잘 사용해주십시오!!!

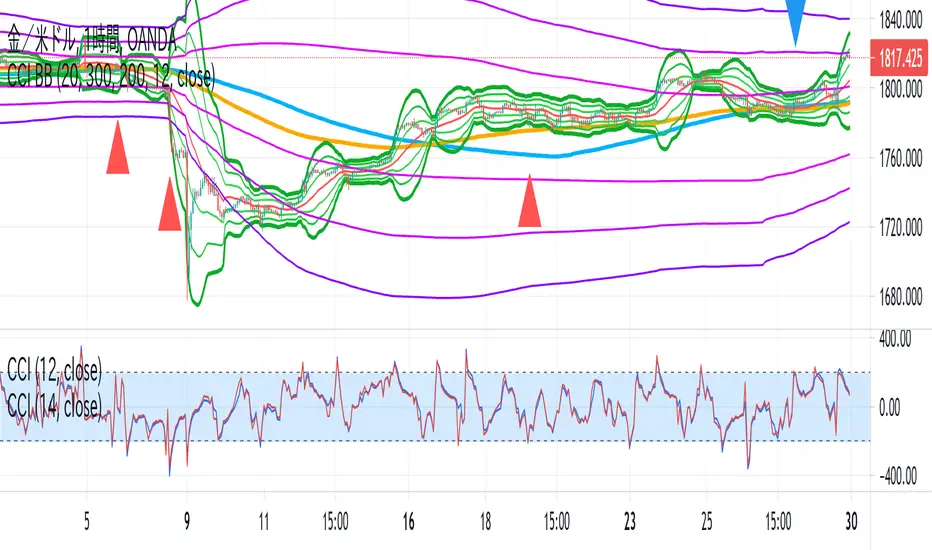
CCI BBThis indicator is the idea of giorno_4_16 .
It shows some indicator lines in your main chart as following:
SMA300, EMA200
BB 20 1,2,3sigma and middle
BB 300 1,2,3sigma and middle
You should put CCI (12, 14) into your separated chart to use the idea.
It shows arrows for registance trading when:
CCI(12) crossovers -200 or corssunders 200 in recent 6bars,
and the price crosses indicator line of SMA200, EMA200 and BB300 1,2,3sigma.
When CCI crossovers -200, you can condisider buying.
When CCI crossunders 200, you can condisider selling.
You should use this indicator in 1H or 4H.
When an arrow appears in 1H, change timeframe to 4H and check the slope of BB20.
If the slope is gentle, take-profit target is MA20 of 1H.
If the slope is steep(ex. CCI crossovers -200 and 4H BB20 go up steeply), take-profit target is BB20 2sigma of 1H.
Simple Moon Phases StrategySimple Moon Phases Strategy
This strategy is very basic and needs some filters to improve results. It was created to test the Moon Phase theory compared to just a buy and hold strategy and it did not beat the buy and hold. However, if you flip the entry and exit signals to the opposite signals it performs a lot worse, so there might be some validity to the Moon Phases having an effect on the markets. I might try to add some filters and increase hold times with trailing stops in a separate version.
WARNING: This strategy uses hard-coded dates from 1/1/2015 until 12/31/2021 only! Any dates outside of that range need to be added manually in the code or it will not work. I may or may not update this so please don't be upset if it stops working after 12/31/2021.
Feel free to use any part of this code and please let me know if you can improve on this strategy.
Rainbow Strategy BacktestingRainbow Strategy Backtesting base on "Rainbow Moving Average" Strategy as below:
1.Rainbow Moving Average setup
- Source: source of 1st MA
- Type: SMA/EMA
- Period: period of 1st MA
- Displacement: period of 2nd MA to 7th MA with source is previous MA
2.Trend Define
- Up Trend: Main MA moving at the top of Rainbow
- Down Trend: Main MA moving at the bottom of Rainbow
- Sideway: Main MA moving between the top and the bottom of Rainbow
3.Signal
- Buy Signal: When Rainbow change to Up Trend.
- Sell Signal: When Rainbow change to Down Trend.
- Exit: When Rainbow change to Sideway.
4.RSI Filter
- "Enable": Only signals have 1st RSI moving between Overbought and Oversold and 2nd RSI moving outside Middle Channel are accepted.
- The filter may help trader avoid bull trap, bear trap and choppy market.
5.Backtesting Infomation
- Ticker: BTCUSDT
- Timeframe: H1
- Rainbow parameter:
+ Source: hlc3
+ Type: SMA
+ Period: 12
+ Displacement: 3
- RSI Filter parameter:
+ Enable
+ 1st RSI filter: period 12, overbought 65, oversold 35
+ 2nd RSI filter: period 9, upper middle 56, lower middle 44
BAM's Weighted ROCTraders,
BAM's Weighted ROC is a Momentum indicator. ROC stands for 'Rate of Change' therefor this indicator plots the reading of a weighted average Rate of Change. In its current form it uses 4 periods en 4 weightings. The periods are set to 21/63/126/252 which corresponds to the number of trading days in each 1/3/6/12 months. The weightings are set to emphasize the more recent periods where the 1-month period counts for 40% of the signal, the 3-monthh period for 30%, the 6-month for 20% and the 12-month for 10%. These settings, both periods and weightings, are customizable. The current settings are meant to serve the widely used 1-day time interval chart setting. Feel free to alter the time frame and adjust the parameters accordingly; eg I like trading the weekly chart on a 10/20/30/40 period settings.
BAM's Weighted ROC can be used as a trendfilter for Trend Following trading systems or as an entry signal for Swing trading systems, or both. In the current setting the indicator is set to trend-following; it turns green when positive (above 0), indicating positive momentum. And red when negative (below 0), indicating negative momentum. In the most basic form one can trade a well diversified portfolio of assets using the indicator as guidance for entry and exit signals as it flows back and forth between positive and negative. Another use for the indicator lies in Swing Trading systems. In this approach the transfer from declining momentum into ascending momentum can be interpreted as a shift in momentum from negative to positive, and therefor constitute an entry opportunity. A combination of the 2 signals is of perfectly viable too, wait for positive momentum (reading above 0) in combination with a upward shift from one bar to the other. Use the reverse logic as an exit signal. In these examples the indicator is used in a stand-alone fashion. But off course it can also be used in conjunction with other indicators.
I personally use the two functions, trend-following en swingtrading, in tandem (combined)
for further reading into the rational behind Trend Following trading systems I recommend the following sources:
- Free Read: Google for 'Meb Faber, Global Asset Allocation' he gives out free copies on his website. Meb is a well known character in the Momentum-factor arena.
- Easy read: 'Following the trend' By Andreas Clenow. I don't think there is any Trend Following trader that doesn't know this chaps work.
- sophisticated Read: Trend Following with Managed Futures by A. Greyserman and K. Kaminski. This one is for those who seriously mean business!
Good luck out there, pls consider that the momentum factor holds an edge, at least based on historical performance, but this out-performance (most often) lies in the low single digits.
Pls be aware that use of this indicator is at your own risk. All info provided is solely presented for educational purposes.
Kind regards,
Bam

Overlay Indicators (EMAs, SMAs, Ichimoku & Bollinger Bands)This is a combination of popular overlay indicators that are used for dynamic support and resistance, trade targets and trend strength.
Included are:
-> 6 Exponential Moving Averages
-> 6 Simple Moving Averages
-> Ichimoku Cloud
-> Bollinger Bands
-> There is also a weekend background marker ideal for cryptocurrency trading
Using all these indicators in conjunction with each other provide great confluence and confidence in trades and price targets.
An explanation of each indicator is listed below.
What Is an Exponential Moving Average (EMA)?
"An exponential moving average (EMA) is a type of moving average (MA) that places a greater weight and significance on the most recent data points. The exponential moving average is also referred to as the exponentially weighted moving average. An exponentially weighted moving average reacts more significantly to recent price changes than a simple moving average (SMA), which applies an equal weight to all observations in the period.
What Does the Exponential Moving Average Tell You?
The 12- and 26-day exponential moving averages (EMAs) are often the most quoted and analyzed short-term averages. The 12- and 26-day are used to create indicators like the moving average convergence divergence (MACD) and the percentage price oscillator (PPO). In general, the 50- and 200-day EMAs are used as indicators for long-term trends. When a stock price crosses its 200-day moving average, it is a technical signal that a reversal has occurred.
Traders who employ technical analysis find moving averages very useful and insightful when applied correctly. However, they also realize that these signals can create havoc when used improperly or misinterpreted. All the moving averages commonly used in technical analysis are, by their very nature, lagging indicators."
Source: www.investopedia.com
Popular EMA lookback periods include fibonacci numbers and round numbers such as the 100 or 200. The default values of the EMAs in this indicator are the most widely used, specifically for cryptocurrency but they also work very well with traditional.
EMAs are normally used in conjunction with Simple Moving Averages.
" What Is Simple Moving Average (SMA)?
A simple moving average (SMA) calculates the average of a selected range of prices, usually closing prices, by the number of periods in that range.
Simple Moving Average vs. Exponential Moving Average
The major difference between an exponential moving average (EMA) and a simple moving average is the sensitivity each one shows to changes in the data used in its calculation. More specifically, the EMA gives a higher weighting to recent prices, while the SMA assigns an equal weighting to all values."
Source: www.investopedia.com
In this indicator, I've included 6 popular moving averages that are commonly used. Most traders will find specific settings for their own personal trading style.
Along with the EMA and SMA, another indicator that is good for finding confluence between these two is the Ichimoku Cloud.
" What is the Ichimoku Cloud?
The Ichimoku Cloud is a collection of technical indicators that show support and resistance levels, as well as momentum and trend direction. It does this by taking multiple averages and plotting them on the chart. It also uses these figures to compute a "cloud" which attempts to forecast where the price may find support or resistance in the future.
The Ichimoku cloud was developed by Goichi Hosoda, a Japanese journalist, and published in the late 1960s.1 It provides more data points than the standard candlestick chart. While it seems complicated at first glance, those familiar with how to read the charts often find it easy to understand with well-defined trading signals."
More info can be seen here: www.investopedia.com
I have changed the default settings on the Ichimoku to suit cryptocurrency trading (as cryptocurrency is usually fast and thus require slightly longer lookbacks) to 20 60 120 30.
Along with the Ichimoku, I like to use Bollinger Bands to not only find confluence for support and resistance but for price discovery targets and trend strength.
" What Is a Bollinger Band®?
A Bollinger Band® is a technical analysis tool defined by a set of trendlines plotted two standard deviations (positively and negatively) away from a simple moving average (SMA) of a security's price, but which can be adjusted to user preferences.
Bollinger Bands® were developed and copyrighted by famous technical trader John Bollinger, designed to discover opportunities that give investors a higher probability of properly identifying when an asset is oversold or overbought."
This article goes into great detail of the complexities of using the Bollinger band and how to use it.
=======
This indicator combines all these powerful indicators into one so that it is easier to input different settings, turn specific tools on or off and can be easily customised.
