Multi EMA with labels (Any timeframe)This script lets you add up to 8 EMAs (Exponential Moving Averages) that can be set to any timeframe and length. The difference between this and other EMA indicators is that it has a simple label attached to each EMA showing which timeframe it belongs to and what length it is, so you can get that information at a glance while trading without having to remember the specific settings for each EMA.
I was personally looking for something like this because I like clarity on my chart and these labels really help. The existing EMA indicators I found with labels don't support multiple timesframes or if they do, they don't include the timeframe itself in the label, so that's why I created this simple script and shared it in case somebody else is looking for the same. Enjoy.
חפש סקריפטים עבור "3 ema"

Bitcoin trend RVI and Emastrategy with two emas and rvi.
Only long positions when fast ema above slow ema when rvi gives entry.
Only short positions when slow ema above fast ema when rvi gives entry.

10 EMA StrategyThis indicator shows you:
- The first bullish candle to close below EMA 10
- The first bearish candle to close above EMA 10.
Optional:
You can enable the exit signals in the setting. This will show you:
- If you are long (bullish), it will signal when the first bullish candle closes below EMA 10
- If you are short (bearish), it will signal when the first bearish candle closes above EMA 10
You can also change the EMA 10, to another length, if you want to try something else.

EMA RSI ATR Hidden Div Strat - 1 MinHey there!
Hereby I present you the EMA RSI Lowest Low Hidden Divergence strategy, which I discovered on a youtube channel.
He has tested the strategy hundreds of times manually, herewith I try to automate the whole thing.
Since I use the strategy with a bot, it can only enter long positions for now. But in the future I will add the possibility to trade short positions.
The strategy was tested with BTC/ USDT in 1m chart (8 days). The values must be adjusted depending on the timeframe and coin.
-----------------------------------------------------------------------------------
How does the strategy work?
First of all, we need a bullish hidden divergence.
Once this is detected, the following parameters are checked:
The 50 EMA must cross the 250 EMA .
Then, the candle must close above the 50 EMA .
The K line of the RSI STOCH indicator need to crosses the D line.
If the next candle closes above the 50 EMA , a long position is opened.
The stop loss is determined with the "lowest low/highest high lookback".
The profit factor is multiplied by the value of the lowest low/highest high lookback.
The results of the strategy are without commissions and levers.
If you have any questions or feedback, please let me know in the comments.
In the future I will add other types of stop loss / take profits. (ATR; %; eg.)
I wish you good luck with the strategy!

Phicube EMASAR ( EMA Support and Resistance )Indicator based on the Concept created by Bo Williams. But unlike the original that uses MIMAs, EMAs are used here.
Exponential moving averages will be shown according to fractal alignment, in order to show the important support and resistance levels ( SAR ).
When the fractals are aligned to become support,
we will have the EMA in the graph with a bright color.
When the fractals are aligned to become resistance, we will have EMA in the graph with a matte color.
Available exponential moving averages: 17,34,72,144,305,610,1292 and 2584
____________________________________________________//_____________________________________________________________________
Indicador baseado no Conceito criado pelo Bo Williams. Mas diferente do original que utiliza MIMAs, aqui é utilizado EMAs.
As médias móveis exponenciais serão mostradas de acordo com o alinhamento dos fractais, com objetivo de mostrar os níveis importantes
de suporte e resistência( SAR ).
Quando estiver com os fractais alinhados virando suporte, teremos no gráfico a EMA com uma cor em tom brilhante.
Quando estiver com os fractais alinhados virando resistência, teremos no gráfico a EMA com uma cor em tom fosco.
Médias móveis exponenciais disponíveis: 17,34,72,144,305,610,1292 e 2584

EMA BounceThis indicator will:
signal a GREEN triangle if a candle opens below the EMA and closes above the EMA
signal a RED triangle if the candle opens above the EMA and closes below the EMA
Strategy:
First identify the trend (stick to one timeframe, I use 4h)
If in an UP trend, then go LONG on GREEN triangles, do not trade red triangles as that would be a counter-trend trade (I am placing buy stops at the HIGH of the signal candle)
If in a DOWN trend, then go SHORT on RED triangles, do not trade on green triangles as that would be a counter-trend trade (I am placing sell stops at the LOW of the signal candle)
Default EMA is set to 50, you can change to a higher number for less signals or a lower number for more signal
NOTE: You can set up alerts so that you don't have to watch charts and wait for the signals.
If you find this indicator useful, tips and donations are always appreciated. Venmo @rick-munoz :)

Qullamagi EMA Breakout Autotrade (Crypto Futures L+S)Title: Qullamagi EMA Breakout – Crypto Autotrade
Overview
A crypto-focused, Qullamagi-style EMA breakout strategy built for autotrading on futures and perpetual swaps.
It combines a 5-MA trend stack (EMA 10/20, SMA 50/100/200), volatility contraction boxes, volume spikes and an optional higher-timeframe 200-MA filter. The script supports both long and short trades, partial take profit, trailing MA exits and percent-of-equity position sizing for automated crypto futures trading.
Key Features (Crypto)
Qullamagi MA Breakout Engine – trades only when price is aligned with a strong EMA/SMA trend and breaks out of a tight consolidation range. Longs use: Close > EMA10 > EMA20 > SMA50 > SMA100 > SMA200. Shorts are the mirror condition with all MAs sloping in the trend direction.
Strict vs Loose Modes – Strict (Daily) is designed for cleaner swing trades on 1H–4H (full MA stack, box+ATR and volume filters, optional HTF filter). Loose (Intraday) focuses on 10/20/50 alignment with relaxed filters for more frequent 15m–30m signals.
Volatility & Volume Filters for Crypto – ATR-based box height limit to detect volatility contraction, wide-candle filter to avoid chasing exhausted breakouts, and a volume spike condition requiring current volume to exceed an SMA of volume.
Higher-Timeframe Trend Filter (Optional) – uses a 200-period SMA on a higher timeframe (default: 1D). Longs only when HTF close is above the HTF 200-SMA, shorts only when it is below, helping avoid trading against dominant crypto trends.
Autotrade-Oriented Trade Management – position size as % of equity, initial stop anchored to a chosen MA (EMA10 / EMA20 / SMA50) with optional buffer, partial take profit at a configurable R-multiple, trailing MA exit for the remainder, and an optional cooldown after a full exit.
Markets & Timeframes
Best suited for BTC, ETH and major altcoin futures/perpetuals (Binance, Bybit, OKX, etc.).
Strict preset: 1H–4H charts for classic Qullamagi-style trend structure and fewer fake breakouts.
Loose preset: 15m–30m charts for higher trade frequency and more active intraday trading.
Always retune ATR length, box length, volume multiplier and position size for each symbol and exchange.
Strategy Logic (Quick Summary)
Long (Strict): MA stack in bullish alignment with all MAs sloping up → tight volatility box (ATR-based) → volume spike above SMA(volume) × multiplier → breakout above box high (close or intrabar) → optional HTF close above 200-SMA.
Short: Mirror logic: bearish MA stack, tight box, volume spike and breakdown below box low with optional HTF downtrend.
Best Practices for Crypto
Backtest on each symbol and timeframe you plan to autotrade, including commissions and slippage.
Start on higher timeframes (1H/4H) to learn the behavior, then move to 15m–30m if you want more signals.
Use the higher-timeframe filter when markets are strongly trending to reduce counter-trend trades.
Keep position-size percentage conservative until you fully understand the drawdowns.
Forward-test / paper trade before connecting to live futures accounts.
Webhook / Autotrade Integration
Designed to work with TradingView webhooks and external crypto trading bots.
Alert messages include structured fields such as: EVENT=ENTRY / SCALE_OUT / EXIT, SIDE=LONG / SHORT, STRATEGY=Qullamagi_MA.
Map each EVENT + SIDE combination to your bot logic (open long/short, partial close, full close, etc.) on your preferred exchange.
Important Notes & Disclaimer
Crypto markets are highly volatile and can change regime quickly. Backtest and forward-test thoroughly before using real capital. Higher timeframes generally produce cleaner MA structures and fewer fake breakouts.
This strategy is for educational and informational purposes only and does not constitute financial advice. Trading leveraged crypto products involves substantial risk of loss. Always do your own research, manage risk carefully, and never trade with money you cannot afford to lose.

Disparity Index with 4 EMAsDisparity Index with 4 EMAs
(ema - close ) / ema * 100
or
(ema - close0 / close * 100

Price Extension from 8 EMAOverview
This indicator can be used to see how far away the price is from the 8 EMA. It compares this to the Average Daily Range % to see if the stock may be overextended. The "Extension Multiplier" represents how far the stock is extended away from the 8 EMA.
Core Concept
This indicator is best used for breakout trades that are trying to make sure they are not chasing the stock.
How to Use This Indicator
This tool is primarily intended for analyzing daily charts of individual stocks and is often used by breakout traders to evaluate potential entry areas.
If the stock is far away from the 8 EMA, it is likely not ready to break out. If it is close to the 8ema, it could be ready to move higher.
This indicator can also be used in the opposite way. For example, shorting or puts.
Understanding the colors
Green (Not Extended): Indicates the price is close to the 8 EMA. This often corresponds to periods of consolidation.
Yellow (Slightly Extended): The price is beginning to move away from the 8 EMA.
Orange (Extended): The price has moved a considerable distance from the 8 EMA.
Red (Very Extended): The price is at an extreme distance from the 8 EMA, historically increasing the likelihood of a pullback or consolidation.
Settings
Info Row Position: Adjusts the vertical position of the display table on the chart. Useful when using other indicators.
ADR Length: Sets the lookback period for calculating the Average Daily Range. Or the average range % for different timeframes.
Timeframe: Determines the timeframe for the EMA and ADR calculation (the default is Daily).

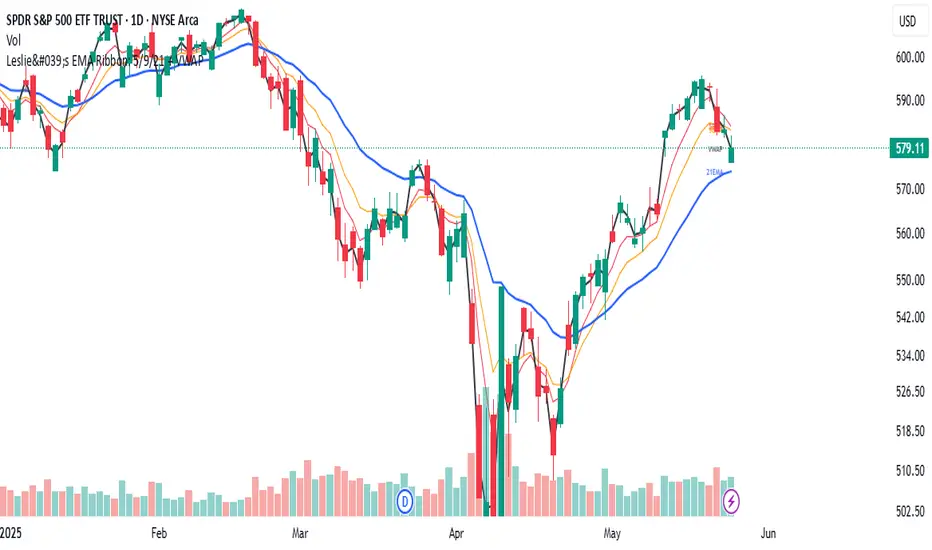
Leslie's EMA Ribbon: 5/9/21 + VWAPEMA + VWAP Crossover Indicator with Alerts
This script blends three Exponential Moving Averages (5, 9, 21) with VWAP to identify momentum shifts and volume-confirmed trend signals. It’s optimized for the Daily timeframe, but also adaptable to shorter-term trading.
🔍 Why this combination?
EMAs provide fast and reliable trend signals:
- 5/9 EMA crossover → short-term shifts (more frequent)
- 9/21 EMA crossover → swing confirmation (less noise)
- VWAP adds volume context used by institutions for fair value tracking.
- 9EMA crossing VWAP confirms price action supported by volume.
Together, these tools offer a multi-layered view of market momentum — combining speed, confirmation, and conviction.
⚙️ Features:
Clean plots with dynamic labels on latest bar
Adjustable line weights for clarity
Alerts included for all crossovers:
- 5EMA / 9EMA
- 9EMA / 21EMA
- 9EMA / VWAP
✅ How to Use:
- Best on the Daily timeframe
- Use 5/9 as early signals, 9/21 for trend filtering, and 9/VWAP for volume-backed setups
- Turn on alerts to stay informed of key shifts without staring at charts
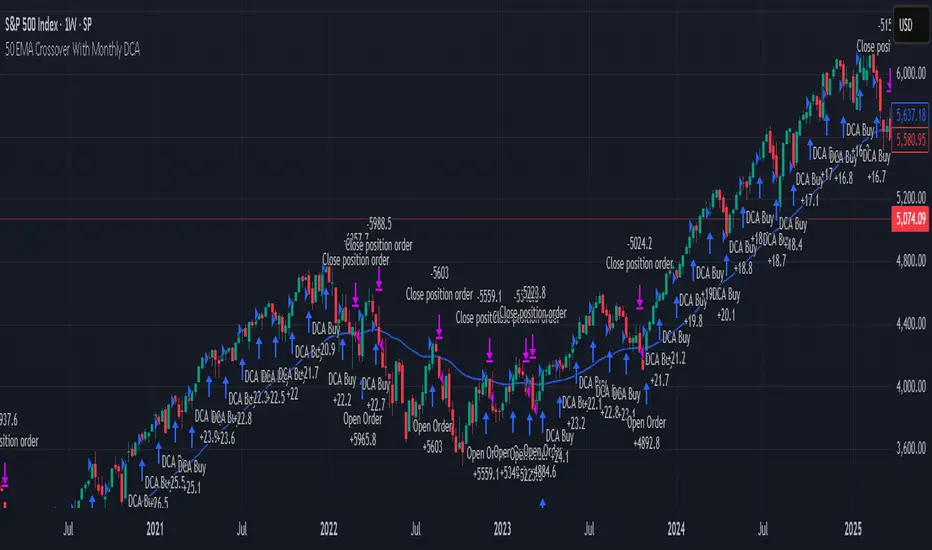
50 EMA Crossover With Monthly DCARecommended Chart Interval = 1W
Overview:
This strategy combines trend-following principles with dollar-cost averaging (DCA), aiming to efficiently deploy capital while minimizing market timing risk.
How It Works:
When the Long Condition is Not Met (i.e., Price < 50 EMA):
- If the price is below the 50 EMA, a fixed DCA amount is added to a cash reserve every month.
- This ensures that capital is consistently accumulated, even when the strategy isn't in a long position.
When the Long Condition is Met (i.e., Price > 50 EMA):
- A long position is opened when the price is above the 50 EMA.
- At this point, the entire capital, including the accumulated cash reserve, is deployed into the market.
- While the strategy is long, a DCA buy order is placed every month using the set DCA amount, continuously investing as the market conditions allow.
Exit Strategy:
If the price falls below the 50 EMA, the strategy closes all positions, and the cash reserve accumulation process begins again.
Key Benefits:
✔ Systematic Investing: Ensures consistent capital deployment while following trend signals.
✔ Cash Efficiency: Accumulates uninvested funds when conditions aren’t met and deploys them at optimal moments.
✔ Risk Management: Exits when the price trend weakens, protecting capital.
Conclusion:
This method allows for efficient capital growth by combining a trend-following approach with disciplined DCA, ensuring risk is managed while capital is deployed systematically at optimal points in the market. 🚀
BS | Buy&Sell Signals With EMAKey Features:
EMA Intersections: Generates clear buy and sell signals based on predefined EMA crossings.
5 EMA Lines: Visualize market trends with five distinct EMA lines plotted on the chart.
Support and Resistance Levels: Easily identify crucial support and resistance levels with our integrated marker.
Comprehensive Indicator Panel: At the bottom of the chart, track Stochastic, RSI, Supertrend, and SMA across multiple timeframes (1m, 5m, 15m, 1H, 4H, Daily, Weekly).
Fully Customizable: Almost every indicator within the tool is adjustable to suit your preferences and trading style.
Alarm Feature: Set up alarms to stay informed of important market movements.
Unlock the full potential of your trading strategy with BS | Buy&Sell Signals With EMA. Customize, analyze, and trade with confidence.
created by @bahadirsezer

Three Anchored Moving Averages (VWAP / SMA / EMA)
This indicator allows users to anchor three types of moving averages (Simple Moving Average (SMA), Exponential Moving Average (EMA), and Volume Weighted Average Price (VWAP)) to specific points in time (anchor points)
Key Features:
Select from three Moving Average Types:
Simple Moving Average (SMA): Averages the closing prices over a specified period.
Exponential Moving Average (EMA): Gives more weight to recent prices, making it more responsive to new information.
Volume Weighted Average Price (VWAP): Averages the price weighted by volume, useful for understanding the average price at which the asset has traded over a period.
Up to Three Anchor Points:
Users can set up to three different anchor points to calculate the moving averages from specific dates and times. This allows for analysis of price action starting from significant points or specific events. For example, you can anchor to the low and high of a move to identify key levels or to points where the price takes off from a previous anchored MA.
Customisable Sentiment Options:
Each anchor point can be associated with a sentiment input (Auto, Bull, Bear, None), which influences if the MAs are displayed as lines or zones/bands:
Auto: Automatically determines the sentiment based on whether anchor points are on pivot highs and lows. If anchored to a pivot high, the system will assume a bearish sentiment and display a red band or zone between the MA OHLC4 and High. Anchoring to a pivot low will display a green band (OHLC4 - Low).
Bull: Forces a bullish sentiment (Green Band - OHLC4 to Low)
Bear: Forces a bearish sentiment (Red Band - OHLC4 to High)
None: Ignores sentiment and displays a single line (OHLC4)
Chart Matching:
The indicator includes an option to display the moving averages only if the chart symbol matches a specified ticker. This feature ensures that the indicator is relevant to the specific asset being analysed.
How to Use the Indicator:
1. Set Anchor Points: When added to your chart, select three anchor points by point and click. If you only wish to anchor to a single point, click on that point three times and disable the other two in settings once the indicator is applied.
2. Select Moving Average Type: Choose between SMA, EMA, or VWAP using the dropdown menu. EMAs are the most responsive.
3. Enable/Disable Anchor Points: Use the checkboxes to enable or disable each anchor point.
4. Select Sentiment Type: Choose between Auto, Bull, Bear, or None.
5. Chart Matching: Optionally, specify a chart symbol to restrict the indicator's display to that particular asset.
6. Interpret the Plots: The indicator plots the high, mid, and low values of the selected moving average type from each anchor point. The fills between these plots help identify potential support and resistance zones. These should be used as points of interest for pullback reversals or potential continuation if the price breaks through.
Practical Applications:
Trend Analysis: Identify the overall trend direction from specific historical points.
Support and Resistance: Determine key dynamic support and resistance levels based on anchored moving averages.
Event-Based Analysis: Anchor the moving averages to significant events (e.g., earnings releases, economic data) to study their impact on price trends.
Multi Timeframe Analysis: Higher Timeframe Anchors can be used to identify longer term trend analysis. Switching to a lower timeframe for execution triggers at these points wont distort the MA levels as they are anchored to a specific point in time
Intraday or Swing Trading: trend analysis using anchor points can be used for any style of trading (Intraday / Swing / Invest). Use anchored levels as points of interest and wait for hints in price action to try and catch the next move.

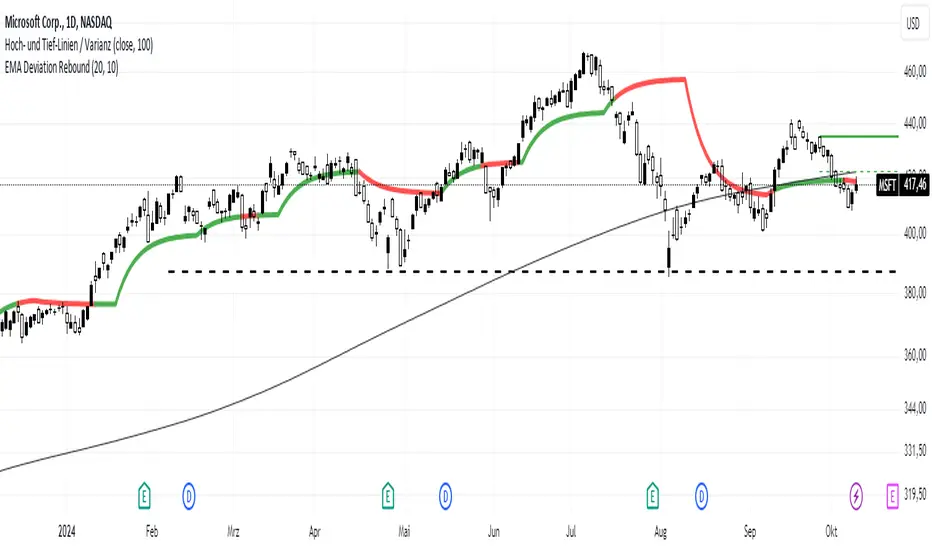
EMA Deviation ReboundThe " EMA Deviation Rebound " indicator I've created utilizes calculations involving the standard deviation of closing prices and exponential moving averages (EMA) to generate a line. The color of this line changes based on whether the EMA value is above or below the current closing price. This can be interpreted as an indicator for potential buy or sell signals:
Buy Signal: If the price crosses the indicator from bottom to top, this can be considered a buy signal. This could indicate that the price has overcome a resistance and a potential upward movement may be forthcoming.
Sell Signal: If the price crosses the indicator from top to bottom, this could serve as a sell signal. This might suggest that the price has broken a support downward and possibly indicates an impending downward movement.
The indicator is named "EMA Deviation Rebound" because I use it to identify potential resistance and support levels. When the price rebounds at the indicator, this could signify a price movement in the opposite direction.
It's important to use such indicators in conjunction with other analysis techniques and market information to make informed trading decisions.
Strategy Myth-Busting #10 - InsideBar+EMA - [MYN]This is part of a new series we are calling "Strategy Myth-Busting" where we take open public manual trading strategies and automate them. The goal is to not only validate the authenticity of the claims but to provide an automated version for traders who wish to trade autonomously.
Our 10th one we are automating is the " 75% Win Rate High Profit Inside Bar Trading Strategy - What If You ... " strategy from " Trade Pro " who claims to have backtested this manually and achieved 11,063% profit with a 75% winrate over 100 trades. I was unable to emulate these results consistently accommodating for slippage and commission but even so, the results look promising. I was only able to achieve this win-rate with some multiple take profit staggering. Even so the markdown is above where I would normally consider comfortable (>20%).
If you know of or have a strategy you want to see myth-busted or just have an idea for one, please feel free to message me.
This strategy uses a combination of 2 open-source public indicators:
Inside Bar Ind/Alert by CMA
EMA (built-in)
Trading Rules
4 hour candles
Stop Loss at EMA Line with TP Target 1.5x the risk
Long Entry when these conditions are true
inside bar and bullish
Bar close's above 50 ema
Price action rises above high of inside bar .
Short Entry when these conditions are true
inside bar and bearish
Bar close below 50 ema
Price action falls below low of inside bar

sohail Anjum EMA buy sellBased on Sohail anjum
Ema crossing teaching
Crossover alerts, only in trend 200 Ema (yellow line) make sure If the price is above the 200 EMA, you can prefer a long position and ignore short positions.
If the price is below the 200 EMA, you are allowed to open only short positions and avoid long positions.
Do not use this indicator alone, Use other recommended indicators by ShohailAnjum Rsi, Macd , chart pattren, etc
This indicator good win rate in 15m TF recommended 1H, 4H
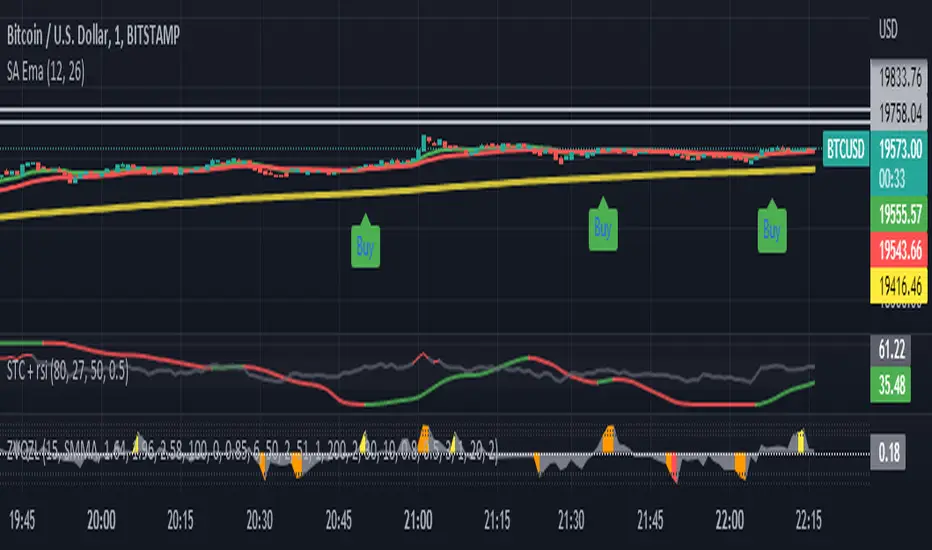
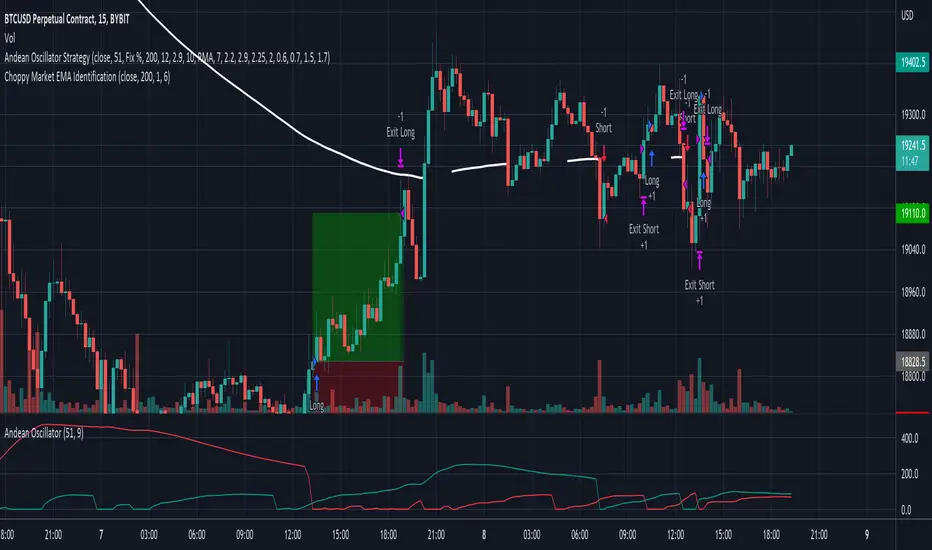
Choppy Market EMA IdentificationThis indicator could be used to identify choppy Market Conditions based on the EMA.
It is an EMA that could be configured to only show up, if the last 1..n candles are NOT crossing the EMA in any direction.
I figured out that lower timeframes ( < 30 min) often the price bounces around the 200 EMA and gives lot of false signals using different strategies.
So i decided to write a small indicator to avoid taking trades in those market conditions.
The Indicator could be configured for the length of the EMA and how many crosses must be happened in the defined numbers of candles.
EMA 21 + MacD + RSI + Alma
Setting
EMA 21 = Green
EMA 9 = yellow
MacD = 5 35 5
RSI = 10
Alma 20 0.8 8
RULES
Long:
1. EMA 9 below 21
2. RSI above 50 from Oversold
3. Macd Solid green
4. SL @ ALMA
5. Conditional buy limit order @ top wick
6. 1:3 RR
Short:
1. EMA 9 above 21
2. RSI below 50 from Overbought
3. Macd Solid red
4. SL @ ALMA
5. Conditional sell limit order @ bottom wick
6. 1:3 RR
VWAP + EMA Analysis [Joshlo]Overview and Use Case
VWAP Analysis gives the possibility to combine multiple time frames of VWAP along with a triplet of exponential moving averages. This can provide insight into potential scalp, swing and longer term trades, depending on your time frame. The use of this indicator with it's setup is based off the the Scalp Setup Alerts provided by Roensch Capital.
The primary use for this script is to help with intraday scalp set ups. Using the Daily VWAP, turned on by default, we can look for price to respect and bounce from one of the VWAP lines (support or resistance) back toward equilibrium, we can also look for price to bounce off of equilibrium and move back toward VWAP support or resistance.
The chart attached shows AMD bouncing off of the Daily time frame VWAP Resistance level multiple times (see yellow boxes), often with confirmation given by an increase in volume which is often far higher than the average volume. In many of these cases a short position could've been opened or put option could have been placed with a profitable outcome.
Every line projected onto the chart via this indicator has the potential to create support or resistance as well as causing 'hang ups', meaning price loses it's momentum, slows down and hangs out in the particular area. This is shown on the chart within the green box.
Chart walkthrough - See attached chart
After a rejection off of the Daily VWAP Resistance line (depicted by the white circle), price starts to move back toward Daily VWAP Equilibrium. In order to reach this line, price needs to move through the 20EMA (white) and 50EMA (purple), the Weekly VWAP Resistance (red circles) and the 200EMA (orange). All of these lines are a part of this single indicator.
The 20EMA seems to offer little resistance but follows the price on it's move, offering some resistance to a volatile move upward. Initially upon contact with the 50EMA, price hangs up and bounces above and below the line whilst finding support on the Weekly VWAP Resistance at the same time. This causes a 'hang up' or sideways movement for around 20 minutes of trading. A potential trade may have entered at the white circle with a VWAP Resistance rejection and exited upon contact with the 50EMA in anticipation of multiple EMAs and support / resistance lines converging which is known to cause price movement to slow.
Eventually with an increase in volume, price breaks below the 20EMA (white), 50EMA (purple) and the Weekly VWAP Resistance level (red circles). Price then finds support on the 200EMA (orange), although there was potential for the price to fall to the Daily VWAP Equilibrium (solid blue). As the Red VWAP lines tend to act more often as resistance as opposed to support (price is rarely above these lines for extended periods), the trade from earlier may have profited more by awaiting contact with the 200EMA before exiting, taking the assumption that the Weekly VWAP Resistance was more likely to act as resistance than support.
A period of consolidation in the green box, around the Weekly VWAP Resistance, 20EMA, 50EMA and with support from the 200EMA eventually resulted in another break out where the price came back up to the Daily VWAP Resistance. Prior to the end of this trading day, there were two more opportunities for scalp setups based off of the price showing consistent rejections off the Daily VWAP Resistance back down to the 50EMA.
In the final example, price breaks above the Daily VWAP Resistance but quickly rejects off of the Monthly VWAP Resistance. For examples where the VWAP Resistance or Support or broken, it can help to look at an indicator such as the RSI to look for bullish divergence or bearish divergence.
Just as this example shows bounces and rejection off of VWAP Resistance, the same applies around the Equilibrium and Support VWAP lines.
The perfect scenario would be to find a ticker where there has already been two or three bounces off of one of these levels, with the goal of taking the trade on the next bounce and either using a percentage price target or technical price target based off of the EMAs or VWAP lines. If there are EMAs close in the direction you want to take the trade, there is a higher chance of hang ups and reversals, so a clear run is the more desired trade set up.
You can also look for these indicator lines to stack up in order to form a stronger support and resistance. For example the 200EMA and Daily VWAP Equilibrium being close to each other may suggest it would take more of an effort to break both of these levels, but one by itself may break more easily.
Indicator Setup
In the settings for the indicator, almost everything you might want to change can be done from the Input tab.
The three options for VWAP (daily, weekly and monthly) allow for analysis on multiple time frames. Daily is turned on as standard.
Standard Deviation Multiplier is set to 2 as standard, this effects the distance of the VWAP support and resistance from the equilibrium line. This seems to be a level that works well with finding support and resistance lines, however if there is excessively high or low volume, occasionally the lines can be thrown off. You can adjust this level if required to find a 'sweet spot' where price likes to reject or find support.
The colors for all VWAPs can be adjusted via the Inputs tab, however if you'd like to change the type of line these are depicted as, this can be done from the Styles tab.
The 3 EMAs (20, 50 and 200) can be toggled on or off and also have their color changed. The style of the lines can be adjusted from with the Styles tab if required.

EMA SCALPEUR LONG V2THIS IS A TRY TO FIND THE BEST EMAS FOR SCALPING
YOU HAVE 4 EMAS, YOU CAN CHOOSE 2 FOR THE ENTER
This a try to find the best EMAs for scalping
you have 4 EMAs, 2 to find the best enter possible and 2 others to find the best way out possible
Three EMAs Trend-following Strategy (by Coinrule)Trend-following strategies are great because they give you the peace of mind that you're trading in line with the market.
However, by definition, you're always following. That means you're always a bit later than your want to be. The main challenges such strategies face are:
Confirming that there is a trend
Following the trend, hopefully, early enough to catch the majority of the move
Hopping off the trade when it seems to have run its course
This EMA Trend-following strategy attempts to address such challenges while allowing for a dynamic stop loss.
ENTRY
The trading system requires three crossovers on the same candle to confirm that a new trend is beginning:
Price crossing over EMA 7
Price crossing over EMA 14
Price crossing over EMA 21
The first benefit of using all three crossovers is to reduce false signals. The second benefit is that you know that a strong trend is likely to develop relatively soon, with the help of the fast setup of the three EMAs.
EXIT
The strategy comes with a fixed take profit and a volatility stop, which acts as a trailing stop to adapt to the trend's strength. That helps you get out of the way as soon as market conditions change. Depending on your long-term confidence in the asset, you can edit the fixed take profit to be more conservative or aggressive.
The position is closed when:
The price increases by 4%
The price crosses below the volatility stop.
The best time frame for this strategy based on our backtest is the 4-hr. Shorter timeframes can also work well, although they exhibit larger volatility in their returns. In general, this approach suits medium timeframes. A trading fee of 0.1% is taken into account. The fee is aligned to the base fee applied on Binance, which is the largest cryptocurrency exchange.

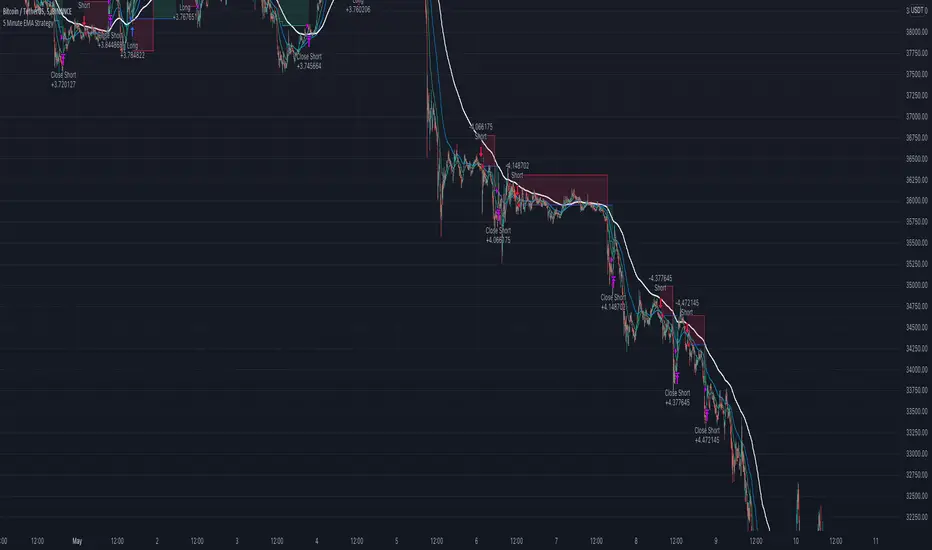
5 Minute EMA Cross StrategyThis simple Fast/Slow EMA cross strategy is designed to be used with Alertatron to place limit orders and use a trailing stop/take profit.
Features:
Indicators when the fast EMA crosses the slow EMA
Trailing Stop/Take Profit
Bar look back for placing limit order
Macro EMA filter to only trade with the macro trend