EMA Pullback Entry SignalsEMA Pullback Entry Signals is a tool designed to help traders identify trend continuation opportunities by detecting price pullbacks toward a slow EMA (Exponential Moving Average) during trending conditions.
This indicator combines moving average crossovers, price interaction with EMAs, and optional filtering to improve the timing and quality of trend entries.
Core Features:
Golden Cross / Death Cross Detection
Golden Cross: Fast EMA crossing above Slow EMA
Death Cross: Fast EMA crossing below Slow EMA
Optional X-shaped markers for crossover visualization
Pullback Signal on Slow EMA
Green triangle: Price crosses up through the slow EMA during a bullish trend
Red triangle: Price crosses down through the slow EMA during a bearish trend
Designed to capture continuation entries after a trend pullback
Optional Fast EMA Signals
Green arrow: Price crosses above fast EMA in a bull trend
Red arrow: Price crosses below fast EMA in a bear trend
Helps confirm minor retracements or short-term momentum shifts
Sideways Market Filter
Suppresses signals when the fast and slow EMAs are too close
Prevents entries during low-trend or choppy price action
Cooldown Timer
Enforces a minimum bar interval between signals to reduce overtrading
Helps avoid multiple entries from clustered signals
Custom Alerts
Alerts available for all signal types
Include ticker and timeframe in each alert message
Configurable Settings:
Fast and slow EMA lengths1
Toggle individual signal types (pullbacks, fast EMA crosses, crossovers)
Enable/disable cooldown logic and set bar duration
Sideways market detection sensitivity (EMA proximity threshold)
Primary Use Case
This script is most useful for trend-following traders seeking to enter pullbacks after a trend is established. When the price retraces to the slow EMA and then resumes in the trend direction, it can offer high-quality continuation setups. Works well across timeframes and markets.
חפש סקריפטים עבור "3 ema"

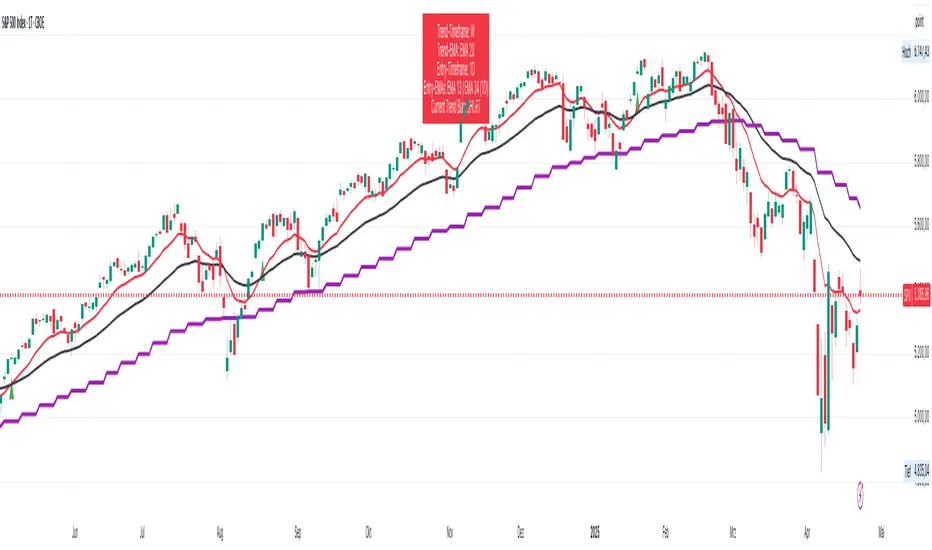
Ryna 3 EMA Multi-Timeframe Indicator**EMA Multi-Timeframe Strategy (Pine Script v6)**
This TradingView indicator is designed to assist traders using a **multi-timeframe trend-following strategy** based on Exponential Moving Averages (EMAs).
**Core Functionality**
- **Trend Identification:**
Uses a configurable **EMA (e.g., EMA 50)** on a **higher timeframe** (e.g., H1, D1, W1) to determine the market bias:
- If price is **above** the trend EMA → **Long bias**
- If price is **below** the trend EMA → **Short bias**
- **Entry Signals:**
Uses two EMAs (fast & slow, e.g., EMA 8 & EMA 21) on either:
- The **current chart timeframe**, or
- A **separately selected timeframe** (e.g., entry on M15, trend on H1)
→ Signals are generated based on **EMA crossovers**:
- **Bullish crossover** (fast crosses above slow) → Long signal
- **Bearish crossover** (fast crosses below slow) → Short signal
- Only when aligned with the higher-timeframe trend
- **Visual Output:**
- Optional display of entry EMAs when sourced from the trend timeframe
- Always displays the trend EMA
- Entry signals shown with triangle markers on the chart
- **Info Panel (Top Center):**
- Shows selected timeframes and EMA settings
- Indicates current trend bias (LONG / SHORT / NEUTRAL)
- Notes if entry EMAs are hidden due to settings
- **Alerts:**
- Optional alerts for long and short entry signals based on EMA crossovers
#### **User Inputs**
- **Trend Timeframe & EMA Length**
- **Entry Timeframe & EMA Fast/Slow Lengths**
- **Option to show/hide entry EMAs when using the trend timeframe**
- **Option to show/hide Infobox on Chart**
EMA GridThe EMA Grid indicator is a powerful tool that calculates the overall market sentiment by comparing the order of 20 different Exponential Moving Averages (EMAs) over various lengths. The indicator assigns a rating based on how well-ordered the EMAs are relative to each other, representing the strength and direction of the market trend. It also smooths out the macro movements using cumulative calculations and visually represents the market sentiment through color-coded bands.
EMA Calculation:
The indicator uses a series of EMAs with different lengths, starting from 5 and going up to 100. Each EMA is calculated either using the exponential moving averages.
The EMAs form the grid that the indicator uses to measure the order and distance between them.
Rating Calculation:
The indicator computes the relative distance between consecutive EMAs and sums these differences.
The cumulative sum is further smoothed using multiple EMAs with different lengths (from 3 to 21). This smooths out short-term fluctuations and helps identify broader trends.
Market Sentiment Rating:
The overall sentiment is calculated by comparing the values of these smoothing EMAs. If the shorter-term EMA is above the longer-term EMA, it contributes positively to the sentiment; otherwise, it contributes negatively.
The final rating is a normalized value based on the relationship between these EMAs, producing a sentiment score between 1 (bullish) and -1 (bearish).
Color Coding and Bands:
The indicator uses the sentiment rating to color the space between the 100 EMA and 200 EMA, representing the strength of the trend.
If the sentiment is bullish (rating > 0), the band is shaded green. If the sentiment is bearish (rating < 0), the band is shaded red.
The intensity of the color is based on the strength of the sentiment, with stronger trends resulting in more saturated colors.
Utility for Traders:
The EMA Grid is ideal for traders looking to gauge the broader market trend by analyzing the structure and alignment of multiple EMAs. The color-coded band between the 100 and 200 EMAs provides an at-a-glance view of market momentum, helping traders make informed decisions based on the trend's strength and direction.
This indicator can be used to identify bullish or bearish conditions and offers a smoothed perspective on market trends, reducing noise and highlighting significant trend shifts.

EMA bridge and dashboard with color coding.
Summary:
This is a custom moving average indicator script that calculates and plots different Exponential Moving Averages (EMAs) based on user-defined input values. The script also displays MACD and RSI, and provides a table that displays the current trend of the market in a color-coded format.
Explanation:
- The script starts by defining the name of the indicator and the different inputs that the user can customize.
- The inputs include bridge values for three different EMAs (high, close, and low), and four other EMAs (5, 50, 100, and 200).
- The script assigns values to these inputs using the `ta.ema()` function.
- Additionally, the script calculates EMAs for higher timeframes (3m, 5m, 15m, and 30m).
- The script then plots the EMAs on the chart using different colors and line widths.
- The script defines conditions for going long or short based on the crossover of two EMAs.
- It plots triangles above or below bars to indicate the crossover events.
- The script also calculates and displays the RSI and MACD of the asset.
- Finally, the script creates a table that displays the current trend of the market in a color-coded format. The table can be positioned on the top, middle, or bottom of the chart and on the left, center, or right side of the chart.
Parameters:
- i_ema_h: Bridge value for high EMA (default=34)
- i_ema_c: Bridge value for close EMA (default=34)
- i_ema_l: Bridge value for low EMA (default=34)
- i_ema_5: Value for 5-period EMA (default=5)
- i_ema_50: Value for 50-period EMA (default=50)
- i_ema_100: Value for 100-period EMA (default=100)
- i_ema_200: Value for 200-period EMA (default=200)
- i_f_ema: Value for fast EMA used in MACD calculation (default=9)
- i_s_ema: Value for slow EMA used in MACD calculation (default=21)
- fastInput: Value for fast length used in MACD calculation (default=7)
- slowInput: Value for slow length used in MACD calculation (default=14)
- tableYposInput: Vertical position of the table (options: top, middle, bottom; default=middle)
- tableXposInput: Horizontal position of the table (options: left, center, right; default=right)
- bullColorInput: Color of the table cell for a bullish trend (default=green)
- bearColorInput: Color of the table cell for a bearish trend (default=red)
- neutColorInput: Color of the table cell for a neutral trend (default=white)
- neutColorLabelInput: Color of the label for neutral trend in the table (default=fuchsia)
Usage:
To use this script, simply copy and paste it into the Pine Editor on TradingView. You can then customize the input values to your liking or leave them at their default values. Once you have added the script to your chart, you can view the EMAs, MACD, RSI, and trend table on the chart. The trend table provides a quick way to assess the current trend of the market at a glance.

EMA and Dow Theory Strategies🌐 Strategy Description
📘 Overview
This is a hybrid strategy that combines EMA crossovers, Dow Theory swing logic, and multi-timeframe trend overlays. It is suitable for intraday to short-term trading on any asset class: crypto, forex, stocks, and indices.
The strategy provides precise entry/exit signals, dynamic stop-loss and scale-out, and highly visual trade guidance.
🧠 Key Features
・Dual EMA crossover system (applied to both symbol and external index)
・Dow Theory-based swing high/low detection for trend confirmation
・Visual overlay of higher timeframe swing trend (htfTrend)
・RSI filter to avoid overbought/oversold entries
・Dynamic partial take-profit when trend weakens
・Custom stop-loss (%) control
・Visualized trade PnL labels directly on chart
・Alerts for entry, stop-loss, partial exit
・Gradient background zones for swing zones and trend visualization
・Auto-tracked metrics: APR, drawdown, win rate, equity curve
⚙️ Input Parameters
| Parameter | Description |
| ------------------------- | -------------------------------------------------------- |
| Fast EMA / Slow EMA | Periods for detecting local trend via EMAs |
| Index Fast EMA / Slow EMA | EMAs applied to external reference index |
| StopLoss | Maximum loss threshold in % |
| ScaleOut Threshold | Scale-out percentage when trend changes color |
| RSI Period / Levels | RSI period and overbought/oversold levels |
| Swing Detection Length | Number of bars used to detect swing highs/lows |
| Stats Display Options | Toggle PnL labels and position of statistics table |
🧭 About htfTrend (Higher Timeframe Trend)
The script includes a higher timeframe trend (htfTrend) calculated using Dow Theory (pivot highs/lows).
This trend is only used for visual guidance, not for actual entry conditions.
Why? Strictly filtering trades by higher timeframe often leads to missed opportunities and low frequency.
By keeping htfTrend visual-only, traders can still refer to macro structure but retain trade flexibility.
Use it as a contextual tool, not a constraint.
ストラテジー説明
📘 概要
本ストラテジーは、EMAクロスオーバー、ダウ理論によるスイング判定、**上位足トレンドの視覚表示(htfTrend)**を組み合わせた複合型の短期トレーディング戦略です。
仮想通貨・FX・株式・指数など幅広いアセットに対応し、デイトレード〜スキャルピング用途に適しています。
動的な利確/損切り、視覚的にわかりやすいエントリー/イグジット、統計表示を搭載しています。
🧠 主な機能
・対象銘柄+外部インデックスのEMAクロスによるトレンド判定
・ダウ理論に基づいたスイング高値・安値検出とトレンド判断
・上位足スイングトレンド(htfTrend)の視覚表示
・RSIフィルターによる過熱・売られすぎの回避
・トレンドの弱まりに応じた部分利確(スケールアウト)
・**損切り閾値(%)**をカスタマイズ可能
・チャート上に損益ラベル表示
・アラート完備(エントリー・決済・部分利確)
・トレンドゾーンを可視化する背景グラデーション
・勝率・ドローダウン・APR・資産増加率などの自動表示
| 設定項目名 | 説明内容 |
| --------------------- | -------------------------- |
| Fast EMA / Slow EMA | 銘柄に対して使用するEMAの期間設定 |
| Index Fast / Slow EMA | 外部インデックスのEMA設定 |
| 損切り(StopLoss) | 損切りラインのしきい値(%で指定) |
| 部分利確しきい値 | トレンド弱化時にスケールアウトする割合(%) |
| RSI期間・水準 | RSI計算期間と、過熱・売られすぎレベル設定 |
| スイング検出期間 | スイング高値・安値の検出に使用するバー数 |
| 統計表示の切り替え | 損益ラベルや統計テーブルの表示/非表示選択 |
🧭 上位足トレンド(htfTrend)について
本スクリプトには、上位足でのスイング高値・安値の更新に基づく**htfTrend(トレンド判定)が含まれています。
これは視覚的な参考情報であり、エントリーやイグジットには直接使用されていません。**
その理由は、上位足を厳密にロジックに組み込むと、トレード機会の損失が増えるためです。
このスクリプトでは、**判断の補助材料として「表示のみに留める」**設計を採用しています。
→ 裁量で「利確を早める」「逆張りを避ける」判断に活用可能です。

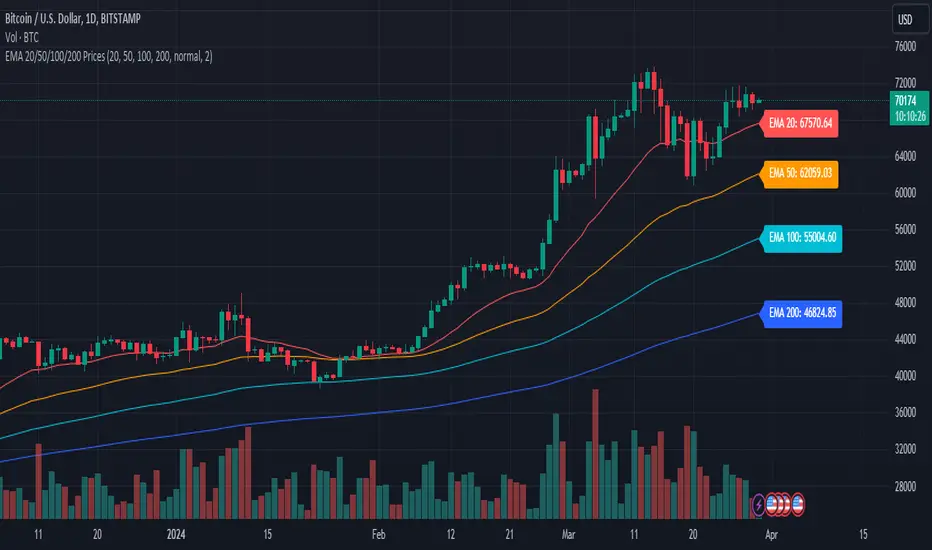
EMA 20/50/100/200 PricesDescription:
Introducing the EMA Indicator with Dynamic Labels, a unique addition to the TradingView Public Library. This innovative script enhances trend analysis and decision-making by overlaying four Exponential Moving Averages (EMAs) – 20, 50, 100, and 200 periods – on your chart, each with a distinct color for quick identification.
What sets this script apart?
Unlike standard EMA indicators, this script includes dynamic labels that display the current price level of each EMA at the latest price bar. This feature provides an instant snapshot of market sentiment, offering insights into potential dynamic support or resistance levels.
Key Features:
Customizable EMA Periods: Tailor the EMA periods according to your trading strategy, allowing for flexibility across different timeframes and assets.
Adaptive Label Sizes: A unique function adjusts label sizes based on user input, ensuring optimal readability across various display settings.
Color-Coded EMAs: Quickly differentiate between the EMAs with pre-defined colors, enhancing visual clarity and trend recognition.
How to Use:
Trend Analysis: Use the EMAs to identify the overall market trend. When shorter EMAs are above longer ones, it suggests a bullish trend, and vice versa.
Trade Entries and Exits: Look for crossovers of the EMAs as potential entry or exit signals. Dynamic labels will help you pinpoint the exact levels.
Customization: Adjust the EMA periods and label sizes under the indicator settings to match your trading style and preferences.
Underlying Concepts:
This script utilizes the classic EMA calculation but innovates by integrating dynamic, real-time labels and customizable periods. The choice of four different periods allows for a nuanced analysis of trend strength and direction, catering to both short-term traders and long-term investors.
Originality and Contribution:
The "Advanced EMA Indicator with Dynamic Labels" is original in its approach to providing real-time, actionable data through dynamic labels. It caters to the community's need for more interactive and informative indicators that go beyond basic trend analysis.
Conclusion:
Whether you're a novice trader seeking to understand market trends or an experienced investor looking for nuanced analysis tools, this script offers valuable insights and flexibility. It stands as a testament to the power of Pine Script in creating practical, user-centric trading tools.
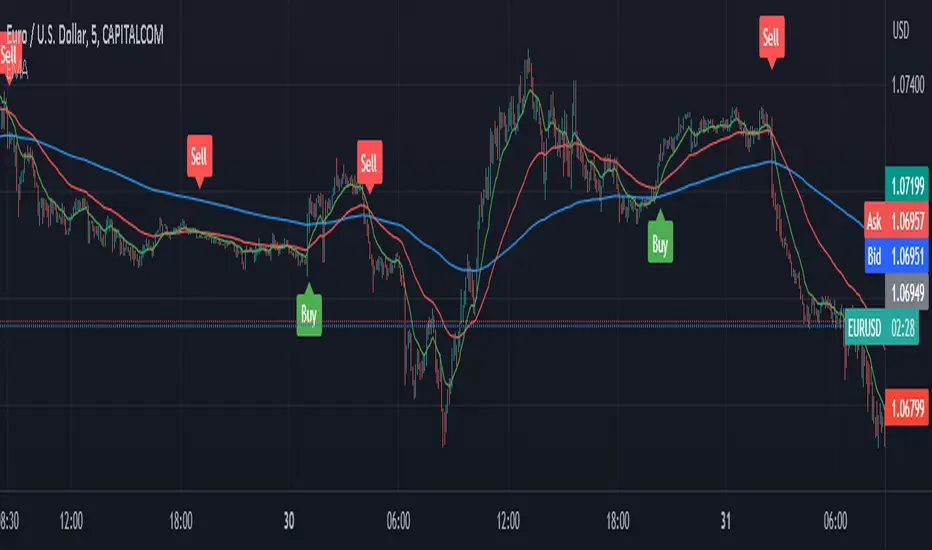
EMA with Buy/Sell Signals by lbkindCertainly! Here's a description of the code:
This Pine Script code is designed to plot Exponential Moving Averages (EMAs) on a chart and generate buy/sell signals based on specific conditions. The code includes a filter to reduce false signals by considering the trend of the EMA 200.
The key components of the code are as follows:
1. Input Variables: The code starts by defining input variables such as the periods for the EMAs (ema200Period, ema50Period, ema13Period), the Average True Range period (atrPeriod), and the chopiness threshold (chopinessThreshold).
2. Calculating EMAs: The EMAs (ema200, ema50, ema13) are calculated using the `ema()` function based on the closing price.
3. Average True Range (ATR): The ATR is calculated using the `atr()` function with the specified period (atrPeriod).
4. Normalized ATR: The normalized ATR is computed by dividing the ATR by the closing price and multiplying by 100. This allows for better comparison across different price levels.
5. EMA 200 Trend Direction: The code determines the trend direction of the EMA 200 by comparing the current value with the previous value. The variables `ema200TrendUp` and `ema200TrendDown` are assigned `true` or `false` values based on the trend direction.
6. Generate Buy/Sell Signals: The buySignal is generated when the following conditions are met:
- There is a crossover of the shorter EMAs (ema13, ema50).
- The EMA 200 is in an uptrend (`ema200TrendUp` is true).
- The current close is above the EMA 200.
- The normalized ATR is below the specified chopiness threshold.
The sellSignal is generated when the opposite conditions are met.
7. Plotting: The EMAs (ema200, ema50, ema13) are plotted on the chart using the `plot()` function. The buy and sell signals are plotted as labels using the `plotshape()` function. The buySignal is displayed below the candle (`location=location.belowbar`), and the sellSignal is displayed above the candle (`location=location.abovebar`).
By incorporating these features, the code provides a visual representation of the EMAs, along with buy and sell signals that consider the EMA 200 trend, crossover of shorter EMAs, and the normalized ATR condition. This helps in identifying potential entry and exit points in the market while attempting to reduce false signals.
EMA + RSI Autotrade Webhook - VarunOverview
The EMA + RSI Autotrade Webhook is a powerful trend-following indicator designed for automated crypto futures trading. This indicator combines the reliability of Exponential Moving Average (EMA) crossovers with RSI momentum filtering to generate high-probability buy and sell signals optimized for webhook integration with crypto exchanges like Delta Exchange, Binance Futures, and Bybit.Key Features
Simple & Effective: Uses proven EMA 9/21 crossover strategy
RSI Momentum Filter: Eliminates low-probability trades in ranging markets
Webhook Ready: Two clean alerts (LONG Entry, SHORT Entry) for seamless automation
Exchange Compatible: Works with Delta Exchange, 3Commas, Alertatron, and other webhook platforms
Zero Lag Signals: Real-time alerts on crossover confirmation
Visual Clarity: Clean chart markers for easy signal identification
How It Works
Entry Signals:
LONG Entry: Triggers when EMA 9 crosses above EMA 21 AND RSI is above 52 (bullish momentum confirmed)
SHORT Entry: Triggers when EMA 9 crosses under EMA 21 AND RSI is below 48 (bearish momentum confirmed)
Technical Components:
Fast EMA: 9-period (tracks short-term price action)
Slow EMA: 21-period (identifies primary trend)
RSI: 14-period (confirms momentum strength)
RSI Long Threshold: 52 (filters weak bullish signals)
RSI Short Threshold: 48 (filters weak bearish signals)
Best Use Cases
Crypto Futures Trading: Bitcoin, Ethereum, Altcoin perpetual contracts
Automated Trading Bots: Integration with Delta Exchange webhooks, TradingView alerts
Timeframes: Optimized for 15-minute charts (works on 5min-1H)
Markets: Trending crypto markets with clear directional moves
Risk Management: Best used with 1-2% stop loss per trade (managed externally)
Webhook Automation Setup
Add indicator to your TradingView chart
Create alerts for "LONG Entry" and "SHORT Entry"
Configure webhook URL from your exchange (Delta Exchange, Binance, etc.)
Use alert message: Entry LONG {{ticker}} @ {{close}} or Entry SHORT {{ticker}} @ {{close}}
Exchange automatically reverses positions on opposite signals
Advantages
✅ No manual trading required - fully automated
✅ Eliminates emotional trading decisions
✅ Catches trending moves early with EMA crossovers
✅ RSI filter reduces whipsaws in choppy markets
✅ Works 24/7 without monitoring
✅ Simple two-alert system (easy to manage)
✅ Compatible with multiple exchanges via webhooksStrategy Philosophy
This indicator follows a trend-following with momentum confirmation approach. By waiting for both EMA crossover AND RSI confirmation, it ensures you're entering trades with genuine momentum behind them, not just random price noise. The tight RSI thresholds (52/48) keep you aligned with the prevailing trend.Recommended Settings
Timeframe: 15-minute (primary), 5-minute (scalping), 1-hour (swing)
Markets: BTC/USDT, ETH/USDT, high-liquidity altcoin perpetuals
Position Sizing: 100% capital per signal (exchange manages reversals)
Stop Loss: 2% (managed via exchange or external bot)
Leverage: 1-2x for conservative approach, up to 5x for aggressive
Important Notes
⚠️ This indicator generates entry signals only - position reversals are handled automatically by your exchange
⚠️ Always backtest on historical data before live trading
⚠️ Use proper risk management and position sizing
⚠️ Best performance in trending markets; may generate false signals in tight ranges
⚠️ Requires TradingView Premium or higher for webhook functionalityTags
cryptocurrency futures automated-trading ema-crossover rsi webhook delta-exchange tradingview-alerts trend-following momentum bitcoin ethereum crypto-bot algo-trading 15-minute-strategy

EMA Envelope - Signal with Stoploss and Takeprofit LevelsDescription:
This Pine Script indicator implements the EMA Envelope strategy, which utilizes Exponential Moving Averages (EMA) to create an envelope around the price chart. The strategy generates buy and sell signals based on the crossing of the price above and below the upper and lower EMA envelopes, respectively. It also incorporates additional features such as stop-loss and take-profit levels for risk management.
Indicator Settings:
EMA Length: Specifies the period for the short-term Exponential Moving Average.
Long Term EMA Length: Defines the period for the long-term Exponential Moving Average used for signal filtering.
Take Profit Ratio: Determines the ratio for calculating the take-profit levels based on the stop-loss.
Filter Signal on Long Term EMA: Enables or disables the filtering of buy/sell signals using the long-term EMA.
Show only recent signal: When enabled, shows only the most recent buy/sell signals.
Buy and Sell Signals:
The indicator generates buy signals when the price crosses above the upper EMA envelope and the previous low was below the upper EMA envelope. Additionally, you can choose to filter buy signals based on whether the closing price is above the long-term EMA.
Conversely, sell signals are generated when the price crosses below the lower EMA envelope, and the previous high was above the lower EMA envelope. Similar to buy signals, sell signals can also be filtered using the long-term EMA.
Note: Signal works well on Higher Timeframes like Daily/8hrs/4hrs/1hr.
Stop-Loss and Take-Profit Levels:
For buy signals, the stop-loss is set at the lower EMA level, while the take-profit level is calculated by adding a specified ratio of the difference between the low and the stop-loss level to the low price.
For sell signals, the stop-loss is set at the upper EMA level, and the take-profit level is calculated by subtracting a specified ratio of the difference between the stop-loss level and the high price from the high price.
Disclaimer:
This indicator is provided for educational and informational purposes only. Trading involves significant risk, and past performance does not guarantee future results. Users are solely responsible for their trading decisions and should conduct their own research and risk management. The author shall not be held liable for any losses or damages arising from the use of this indicator.
Note: Always test the indicator thoroughly on historical data and consider paper trading before applying it to live trading environments.

EMAs Bullish/Bearish Confluence [Trend Bias]EMA Confluence Zones
This indicator is designed to simplify trend identification by visually highlighting "Confluence Zones" —areas where short-term, medium-term, and long-term momentum are fully aligned.
While traders can manually add three Moving Averages to a chart, identifying the exact moment all three align (the "Perfect Stack") can be visually difficult during live trading. This script automates that process, converting complex line crosses into simple background color zones and providing actionable alerts for the exact moment a trend alignment begins.
🛠 How It Works
The script utilizes three customizable Exponential Moving Averages (EMAs) to detect the market bias:
Short EMA: Represents immediate price action/momentum.
Medium EMA: Represents the intermediate trend.
Long EMA: Represents the major trend baseline.
Calculations & Logic
The indicator checks for a specific hierarchical alignment (Stacking) of these averages:
1. 🟢 Bullish Confluence (Buy Zone):** Returns true when `Short > Medium` AND `Medium >Long`. This confirms that momentum is rising across all three monitored timeframes.
2. 🔴 Bearish Confluence (Sell Zone):** Returns true when `Short < Medium` AND `Medium < Long`. This confirms that momentum is falling across all three monitored timeframes.
3. ⚪ Neutral (No Color): Any other state indicates a choppy or consolidating market where the EMAs are intertwined.
---
🚀 Key Features
*Visual Bias Confirmation: The background highlights Green (Bullish) or Red (Bearish) only when the "Perfect Stack" conditions are met.
Trend Start Alerts: Unlike standard EMA cross alerts, this script includes custom alert conditions that trigger only on the first bar where the confluence becomes valid. This prevents spam alerts during a prolonged trend.
Full Customization: Users can adjust the lengths of all three EMAs to fit specific strategies (e.g., Scalping vs. Swing Trading).
Clean Chart Mode: Includes options to hide the EMA lines entirely and rely solely on the background color for a minimalist "Naked Trading" setup.
🎯 How to Use
1. Trend Filter: Use the background color to determine your directional bias. If the background is Green, look only for Long setups on lower timeframes. If Red, look only for Short setups.
2. Breakout Confirmation: If price breaks a key level, wait for the background color to flip. This confirms that the Moving Averages have caught up to the move, validating the breakout strength.
3. Exit Signal: If you are in a trend trade and the background color disappears (turns transparent), it indicates the trend momentum is fading and the EMAs are beginning to cross/compress.
⚙️ Settings
EMA Lengths: Default is 20, 50, 100. These can be changed to common combinations like (9, 21, 55) or (50, 100, 200).
Visuals: Toggle lines or background colors on/off and adjust transparency to keep your chart readable.
---
Disclaimer: This script is for informational purposes only. Past performance of a trend following method does not guarantee future results. Always use proper risk management.

EMA 5/10/20/34/55/60/120/255Overview
- Plots eight Exponential Moving Averages on the price chart: EMA(5/10/20/34/55/60/120/255) .
- Designed for light (white) theme with high-contrast colors and uniform linewidth=1 .
- Written in Pine Script v6 ( overlay=true ), no alerts or extra visuals.
Why These Lengths
- 5, 10 : Short-term momentum and intraday rhythm.
- 20, 34 : Swing trend and pullback structure (34 is Fibonacci-based).
- 55, 60 : Deeper swing/weekly alignment commonly used by trend traders.
- 120, 255 : Mid/long-term trend filters (~half-year and ~annual trading days).
How To Read
- Trend filter: Price above EMA(120/255) favors bullish context; below favors bearish.
- Alignment: Strong bull trend when 5 > 10 > 20 > 34 > 55 > 60 > 120 > 255 and slopes up; inverse for bear trends.
- Pullbacks: Shallow pullbacks often respect 5/10 ; standard pullbacks 20/34 ; deeper tests 55/60 .
- Slope matters: Up/flat/down slopes of the longer EMAs ( 120/255 ) reflect trend strength more reliably than single crossovers.
Typical Use Cases
- Trend following: Trade in the direction of 120/255 and the stacked EMA order.
- Pullback entries: Look for stabilizing price action around 20/34 within a trend.
- Breakout confirmation: Sustain above/below a key EMA, then retest and hold.
- Risk management: Place stops beyond nearby EMAs, optionally buffered by ATR.
Tips
- Use the Data Window to identify each EMA line by its title ( EMA(5) , EMA(10) , etc.).
- Combine with volatility/strength filters (e.g., ATR, ADX) to reduce range-bound noise.
- Multi-timeframe consistency (e.g., higher TF EMA(255) aligned with current TF EMA(55/60) ) improves selectivity.
Limitations
- All moving averages are lagging by design; expect delayed signals.
- In consolidations, frequent crossovers can create whipsaws; apply filters or focus on slope and structure.
Disclaimer
- For educational purposes only. Not financial advice. Always validate on your instruments and timeframes and manage risk accordingly.

EMA Cross + RSI + ADX - Autotrade Strategy V2Overview
A versatile trend-following strategy combining EMA 9/21 crossovers with RSI momentum filtering and optional ADX trend strength confirmation. Designed for both cryptocurrency and traditional futures/options markets with built-in stop loss management and automated position reversals.
Key Features
Multi-Market Compatibility: Works on both crypto futures (Bitcoin, Ethereum) and traditional markets (NIFTY, Bank NIFTY, S&P 500 futures, equity options)
Triple Confirmation System: EMA crossover + RSI filter + ADX strength (optional)
Automated Risk Management: 2% stop loss with wick-touch detection
Position Auto-Reversal: Opposite signals automatically close and reverse positions
Webhook Ready: Six distinct alert messages for automation (Entry Buy/Sell, Close Long/Short, SL Hit Long/Short)
Performance Metrics
NIFTY Futures (15min): 50%+ win rate with ADX filter OFF
Crypto Markets: Requires extensive backtesting before live deployment
Optimal Timeframes: 15-minute to 1-hour charts (patience required for higher timeframes)
Strategy Logic
Entry Signals:
LONG: EMA 9 crosses above EMA 21 + RSI > 55 + ADX > 20 (if enabled)
SHORT: EMA 9 crosses below EMA 21 + RSI < 45 + ADX > 20 (if enabled)
Exit Signals:
Opposite EMA crossover (auto-closes current position)
Stop loss hit at 2% from entry price (tracks candle wicks)
Technical Indicators:
Fast EMA: 9-period (short-term trend)
Slow EMA: 21-period (primary trend)
RSI: 14-period with 55/45 thresholds (momentum confirmation)
ADX: 14-period with 20 threshold (trend strength filter - optional)
Market-Specific Settings
Traditional Markets (NIFTY, Bank NIFTY, S&P Futures, Options)
Recommended Settings:
ADX Filter: Turn OFF (less choppy, cleaner trends)
Timeframe: 15-minute chart
Win Rate: 50%+ on NIFTY Futures
Why No ADX: Traditional markets have more institutional participation and smoother price action, making ADX unnecessary
Cryptocurrency Markets (BTC, ETH, Altcoins)
Recommended Settings:
ADX Filter: Turn ON (ADX > 20)
Timeframe: 15-minute to 1-hour
Extensive backtesting required before live trading
Why ADX: Crypto markets are highly volatile and prone to false breakouts; ADX filters low-quality chop
Best Practices
✅ Backtest thoroughly on your specific instrument and timeframe
✅ Use larger timeframes (1H, 4H) for higher quality signals and better risk/reward
✅ Adjust RSI thresholds based on market volatility (try 52/48 for more signals, 60/40 for fewer but stronger)
✅ Monitor ADX effectiveness - disable for traditional markets, enable for crypto
✅ Proper position sizing - adjust default_qty_value based on your capital and instrument price
✅ Paper trade first - test for 2-4 weeks before risking real capital
Risk Management
Fixed 2% stop loss per trade (adjustable)
Stop loss tracks candle wicks for accurate execution
Positions auto-reverse on opposite signals (no manual intervention needed)
0.075% commission built into backtest (adjust for your broker)
Customization Options
All parameters are adjustable via inputs:
EMA periods (default: 9/21)
RSI length and thresholds (default: 14-period, 55/45 levels)
ADX length and threshold (default: 14-period, 20 threshold)
Stop loss percentage (default: 2%)
Webhook Automation
This strategy includes six distinct alert messages for automated trading:
"Entry Buy" - Long position opened
"Entry Sell" - Short position opened
"Close Long" - Long position closed on opposite crossover
"Close Short" - Short position closed on opposite crossover
"SL Hit Long" - Long stop loss triggered
"SL Hit Short" - Short stop loss triggered
Compatible with Delta Exchange, Binance Futures, 3Commas, Alertatron, and other webhook platforms.
Important Notes
⚠️ Crypto markets require extensive backtesting - volatility patterns differ significantly from traditional markets
⚠️ Higher timeframes = better results - 15min works but 1H/4H provide cleaner signals
⚠️ ADX toggle is critical - OFF for traditional markets, ON for crypto
⚠️ Not financial advice - always conduct your own research and use proper risk management
⚠️ Past performance ≠ future results - backtest results may not reflect live trading conditions
Disclaimer
This strategy is for educational and informational purposes only. Trading futures and options involves substantial risk of loss. Always backtest thoroughly, start with paper trading, and never risk more than you can afford to lose. The author assumes no responsibility for any trading losses incurred using this strategy.

EMA 9, 21 & 50 Indicator with Floating Labels🟢 EMA 9, 21 & 50 Indicator with Floating Labels
📘 Overview
This indicator plots three exponential moving averages (EMAs) to visualize short-, medium-, and longer-term trend structure on any timeframe:
EMA 9 – Bright Green (short-term momentum)
EMA 21 – Bright Yellow (medium-term trend)
EMA 50 – Red (broader trend confirmation)
Each EMA has a floating label on the right edge of the chart, so line identities remain visible as new candles form.
🪶 Features
Clear, fixed colors for easy recognition (Green 9 / Yellow 21 / Red 50)
Floating labels that stay visible off the right edge
Clean overlay compatible with any chart style
Lightweight and fast to render
📈 How to Use
Trend Filter:
Price above 21 & 50 → bullish bias; look for long setups or pullbacks toward the 9/21.
Price below 21 & 50 → bearish bias; look for short setups or rallies into 9/21.
Momentum vs. Structure:
9 EMA = momentum guide for quick swings.
21 EMA = primary trend line for swing entries/exits.
50 EMA = confirmation of broader direction.
🔧 Tips
Analyze trend on Daily or 4H; fine-tune entries on 1H/15m near the 9 or 21 EMA.
Pair with volume or RSI/MACD for extra confirmation at EMA touches/crosses.

EMA inFusion Pro - Multiple SourcesEMA Fusion Pro: Dynamic Trend & Momentum Strategy with Three Exit Modes
EMA Fusion Pro is a highly customizable, multi-exit trend-following strategy designed for traders who value both precision and flexibility. By leveraging exponential moving averages (EMA), average directional index (ADX), and volume analysis, this strategy aims to capture trending market moves while offering three distinct exit modes for optimal risk management across varying market conditions.
Strategy Overview
This strategy systematically identifies potential entry points using a moving average crossover with highly configurable data sources (including price, volume, rate of change, or their Heikin Ashi versions) and filters signal quality with ADX trend strength and volume spikes. Each trade is managed with one of three advanced exit methodologies—reverse signal, ATR-based stop/take profit, or fixed percentage—giving you the control to adapt your risk profile to different market regimes.
Key Features
Customizable EMA Source: Calculate the core trend-filtering EMA from price (default), volume, rate of change, or their Heikin Ashi counterparts for unique market perspectives.
Trend Filter with ADX: Confirm entries only when the trend is strong, as measured by the user-adjustable ADX threshold.
Volume Spike Confirmation: Optional filter to only take trades with above-average volume activity, reducing false signals.
Three Exit Modes:
Reverse Signal: Exit trades when a new, opposite entry signal occurs.
ATR-Based Stop/Take Profit: Dynamic risk management using multiples of the average true range (ATR) for both take profit and stop loss.
Percent-Based Stop/Take Profit: Fixed-percentage risk management with user-defined thresholds.
Visual Annotations: Signal markers, EMA line color-coded by source, trend background coloring, and optional ATR/percent-based TP/SL levels.
Info Panel: Real-time display of all core indicators, current trading mode, exit parameters, and position status for quick oversight.
How It Works
Entry Logic: A crossover signal (above/below the EMA) triggers a new entry, but only if both ADX trend strength and (optionally) volume spike conditions are met.
Exit Logic: Three selectable modes allow you to exit trades on reverse signals, at a dynamic ATR-based profit or loss, or at a fixed percentage gain/loss.
Flexible Data Analysis: The EMA source can be chosen from six options—standard price, volume, rate of change, or their Heikin Ashi variants—allowing experimentation with different market dimensions.
Risk Management: All exits are precisely controlled, either by the next opposing signal, by volatility-adjusted levels, or by fixed risk/reward ratios.
Backtest & Optimization: The strategy is fully backtestable within TradingView’s Strategy Tester, with adjustable parameters for optimization.
Customization & Usage
Indicator Source: Select your preferred data type for EMA calculation, opening the door to creative strategy variations (e.g., volume momentum, pure price trend, rate of change divergence).
Filter Toggles: Enable/disable ADX and volume filters as desired—useful for different market environments.
Exit Mode Selection: Switch between reverse, ATR, or percent-based exits with a single parameter—ideal for adapting to ranging vs. trending markets.
Visual Clarity: The EMA line color reflects its underlying source, and the info panel summarizes all critical values for easy monitoring.
Who Should Use This Strategy?
Trend Followers seeking to ride strong moves with multiple exit options.
Experienced Traders who want to experiment with different data types (volume, momentum, Heikin Ashi) for trend analysis.
Algorithmic Traders looking for a robust, flexible base to build upon with their own ideas.
Getting Started
Apply the script to your chart and review default settings.
Customize parameters—EMA length, ADX threshold, volume settings, exit type—as desired.
Backtest on multiple instruments and timeframes to evaluate performance.
Optimize filters, exit rules, and risk parameters for your preferred trading style.
Monitor with the real-time info panel and trade alerts.
Disclaimer
This script is for educational and entertainment purposes only. It is not financial advice. Past performance is not indicative of future results. Always conduct thorough testing and consider your risk tolerance before trading real capital.
— Happy Trading —
Feel free to adapt, share, and contribute to this open-source strategy!

EMA Sniper – Precision Trading with EMA 21/50Title: EMA Sniper – Precision Trading with EMA 21/50
Description:
🚀 EMA Sniper is a powerful trading tool designed to identify trend shifts with precision using the EMA 21/50 crossover, while also displaying Stop Loss (SL) and Take Profit (TP) levels directly on the chart.
🔹 Features:
✅ EMA 21/50 Crossover Signals – Buy signals appear when EMA 21 crosses above EMA 50, and sell signals appear when EMA 21 crosses below EMA 50.
✅ Smart Stop Loss & Take Profit – SL is dynamically placed below/above EMA 50 for optimized risk management, while TP follows a 2:1 risk/reward ratio.
✅ Clear Visual Alerts – The indicator plots SL and TP levels as lines on the chart, along with buy and sell markers for quick decision-making.
✅ Multi-Market & Multi-Timeframe – Works across forex, crypto, stocks, and indices on any timeframe.
🚀 Perfect for traders looking for a structured approach to trend-based trading!
Let me know if you’d like any modifications! 🔥

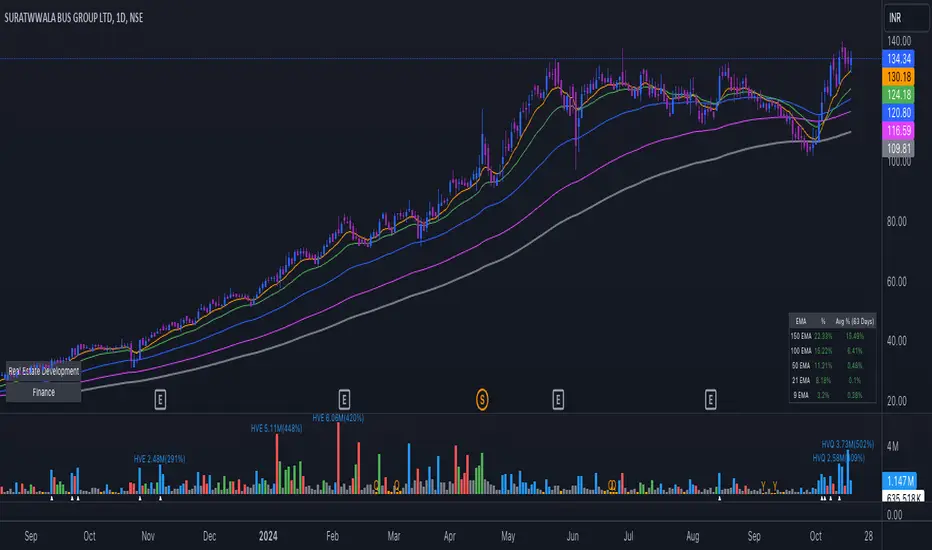
EMA Distance & Sector InfoThis indicator provides insights into price trends relative to Exponential Moving Averages (EMAs) and displays sector/industry information about the asset. Below is a detailed explanation of its purpose and what it is designed to achieve:
Purpose of the Code
The indicator offers two key functionalities:
1. Analyzing Price Distance from Multiple EMAs:
• Helps traders understand how far the current price is from key EMAs, expressed as a percentage.
• Calculates average percentage distances over a specified period (default: 63 days) to spot consistent trends or mean reversion opportunities.
• Useful for trend-following strategies, allowing the trader to see when the price is above or below important EMAs (e.g., 9, 21, 50, 100, and 150-period EMAs).
2. Displaying Asset Sector and Industry Information:
• Displays the sector and industry of the asset being analyzed (e.g., Technology, Consumer Goods).
• Provides additional context when evaluating performance across a specific sector or comparing an asset to its peers.
Who Would Use This Indicator?
This indicator is particularly helpful for:
1. Swing Traders and Positional Traders:
• They can use it to track whether the price is trading significantly above or below critical EMAs, which often signals overbought/oversold conditions or trend strength.
• The average percentage distances help to identify momentum shifts or pullback opportunities.
2. Sector/Industry-Focused Investors:
• Understanding an asset’s sector and industry helps investors gauge how the asset fits into the broader market context.
• This is valuable for sector rotation strategies, where investors shift funds between sectors based on performance trends.
How It Helps in Trading Decisions
1. Entry and Exit Points:
• If the price is far above an EMA (e.g., 21 EMA), it might indicate an overbought condition or a strong trend, while a negative percentage could signal a pullback or reversal opportunity.
• The average percentage distances smooth the fluctuations and reveal longer-term trends.
2. Contextual Information:
• Knowing the sector and industry is useful when analyzing trends. For example, if Technology stocks are doing well, and this asset belongs to that sector, it could indicate sector-wide momentum.
Summary of the Indicator’s Purpose
This code provides:
• EMA trend monitoring: Visualizes the price position relative to multiple EMAs and averages those distances for smoother insights.
• Sector and industry information: Adds valuable context for asset performance analysis.
• Decision-making support: Helps traders identify overbought/oversold levels and assess the asset within the broader market landscape.
In essence, this indicator is a multi-purpose tool that combines technical analysis (through EMA distances) with fundamental context (via sector/industry info), making it valuable for traders and investors aiming to time entries/exits or understand market behavior better.
EMA/SMA Support/Resistance Levels////////////////////////////////////////////////////////////
// saxonlucius 07/08/2019
// EMA/SMA Major Support/Resistance levels
////////////////////////////////////////////////////////////
The script contains major support/resistance EMA's and SMA's.
This includes:
EMA
EMA 21
EMA 34
EMA 50
EMA 89
EMA 100
EMA 200
EMA 377
SMA
SMA 10
SMA 100
SMA 200
SMA 900
The EMA 34 and SMA 900 are not as relevant as the others.

EMA RSI CrossThe EMA RSI Cross (ERC) indicator combines exponential moving average (EMA) crossovers with relative strength index (RSI) momentum signals to highlight potential bullish and bearish trading opportunities.
It works in two layers:
EMA Cross Layer: Tracks short‑term vs. mid‑term trend shifts using EMA(5) crossing above/below EMA(20), while also displaying EMA(50) and EMA(200) for longer‑term structure.
RSI Confirmation Layer: Confirms momentum by requiring RSI(14) to cross its moving average (SMA 14) within a recent lookback window.
Only when both conditions align, and the price confirms the setup in relation to EMA20, a signal is generated:
Bullish Signal (green triangle): EMA5 crosses above EMA20 + RSI crosses up + close above EMA20
Bearish Signal (red triangle): EMA5 crosses below EMA20 + RSI crosses down + close below EMA20
Features
Customizable timeframe input for multi‑timeframe analysis
Adjustable lookback period for RSI confirmation
Clear charting with EMA overlays and arrow signals when confirmed setups occur
RSI panel with dynamic background and overbought/oversold visualization
How to Use
Add the script to your chart, select your preferred signal timeframe.
Look for green arrows as bullish entry confirmation and red arrows for bearish setups.
Use additional filters (trend direction, support/resistance, volume) to refine trades.
Avoid relying on signals in sideways/choppy markets where EMA and RSI may give false triggers.

EMA/SMA Ribbon Pro (AUTO HTF + Labels)This indicator is a multi-timeframe (MTF) moving average ribbon that dynamically adjusts to the next highest timeframe. It provides a visual representation of market trends by stacking multiple EMAs and SMAs with customizable color fills and labels.
Features
✅ Multi-Timeframe (MTF) Support: Automatically detects the next highest time frame or allows for manual selection
✅ Customizable Moving Averages: Supports EMA and SMA with different lengths for flexible configuration
✅ Ribbon Visualization: Smooth color transitions between different moving averages for better trend identification
✅ Crossover Labels: Detects bullish and bearish EMA/SMA crossovers and marks them on the chart
✅ Price Labels & Timeframe Display: Displays moving average values to the right of the price axis with customizable label padding and colors
How It Works
Select the HTF mode: Manual or automatic
Choose EMA/SMA lengths to create different ribbons
Enable/disable price labels for each moving average
Customize colors and transparency for ribbons and labels
Crossover labels appear when faster moving averages cross slower ones and vice versa
Use Cases
📌 Trend Identification: Identify bullish and bearish trends using multiple EMAs and SMAs
📌 Support & Resistance Zones: MAs can act as dynamic support and resistance levels
📌 Reversal & Confirmation Signals: Watch for MTF crossovers to confirm trend changes
Customization
🔹 Standard EMA Lengths: 6, 8, 13, 21, 34, 48, 100, 200, 300, 400
🔹 SMA Lengths: 48, 100, 200
🔹 Color Adjustments: Set custom colors for bullish/bearish ribbons
🔹 Crossovers: Enable/disable custom crossover pairs (e.g., 100/200 EMA, 200 EMA/SMA).
This indicator is perfect for traders who rely on multi-timeframe confluence while seeking to enhance their market analysis and decision-making process.
As always, by combining EMA/SMA Ribbon with other tools, traders ensure that they are not relying on a single indicator. This layered approach can reduce the likelihood of false signals and improve overall trading accuracy.
As always, be sure to use any indicator with price action and volume indicators for better trade confirmation!

EMA orderly stacked or notThis script plots a green circle on top of the chart when the EMAs are stacked positively, a red circle if they are stacked negatively and gray if neither positively nor negatively stacked.
The EMAs used are:
8 EMA
21 EMA
34 EMA
55 EMA
89 EMA
Useful when you look for a quick and easy way to see if these EMAs are stacked positively or negatively as a confirmation to the Squeeze Pro indicator if going long or short (Squeeze Pro is developed by John Carter at SimplerTrading.com and can be purchased there).
Default 100 bars back, but that can be adjusted.
Remember to do your own research.
Feel free to adjust the script to your liking.
The script is not meant to be, and do not constitute, financial, investment, trading, or other types of advice or recommendations supplied or endorsed by me.
Have fun!

EMA HeatmapEMA Heatmap — Indicator Description
The EMA Order Heatmap is a visual trend-structure tool designed to show whether the market is currently trending bullish, trending bearish, or moving through a neutral consolidation phase. It evaluates the alignment of multiple exponential moving averages (EMAs) at three different structural layers: short-term daily, medium-term daily, and weekly macro trend. This creates a quick and intuitive picture of how well price movement is organized across timeframes.
Each layer of the heatmap is scored from bearish to bullish based on how the EMAs are stacked relative to each other. When EMAs are in a fully bullish configuration, the row displays a bright green or lime color. Fully bearish alignment is shown in red. Yellow tones appear when the EMAs are mixed or compressing, indicating uncertainty, trend exhaustion, or a change in market character. The three rows combined offer a concise view of whether strength or weakness is isolated to one timeframe or broad across the market.
This indicator is best used as a trend filter before making trading decisions. Traders may find more consistent setups when the majority of the heatmap supports the direction of their trade. Green-dominant conditions suggest a trending bullish environment where long trades can be favored. Red-dominant conditions indicate bearish momentum and stronger potential for short opportunities. When yellow becomes more prominent, the market may be transitioning, ranging, or gearing up for a breakout, making timing more challenging and risk higher.
• Helps quickly identify directional bias
• Highlights when trends strengthen, weaken, or turn
• Provides insight into whether momentum is supported by higher timeframes
• Encourages traders to avoid fighting market structure
It is important to recognize the limitations. EMAs are lagging indicators, so the heatmap may confirm a trend after the initial move is underway, especially during fast reversals. In sideways or low-volume environments, the structure can shift frequently, reducing clarity. This tool does not generate entry or exit signals on its own and should be paired with price action, momentum studies, or support and resistance analysis for precise trade execution.
The EMA Order Heatmap offers a clean and reliable way to stay aligned with the broader market environment and avoid lower-quality trades in indecisive conditions. It supports more disciplined decision-making by helping traders focus on setups that match the prevailing structural trend.

EMA Trend Buy sell strategyThis strategy is built to help investors get into a trend safely and smartly — without rushing and without getting in and out too often.
When to Buy:
First Signal – Small Step In (50% Buy)
When the short-term trend (EMA 18) turns positive and goes above the medium trend (EMA 33),
👉 we buy half of our planned position.
This is an early warning that a new upward trend might be starting.
Second Signal – Full Confidence (Buy other 50%)
If the medium-term trend (EMA 33) also crosses above the long-term (EMA 50),
👉 we buy the other half of the position.
Now we’re more confident that the trend is real.
When to Sell:
First Warning – Reduce Position (Sell 50%)
If EMA 33 falls below EMA 50,
👉 we sell half of the position to reduce risk.
Trend Reversal – Exit Completely (Sell the rest)
If EMA 18 also falls below EMA 33,
👉 we sell the remaining half and leave the trade fully.
Why This Strategy?
📉 We don’t jump in all at once.
→ We wait for confirmation before going full in.
⏳ We stay in the trade as long as the trend is healthy.
→ No overtrading or reacting to small moves.
📊 We get out slowly, not suddenly.
→ This helps protect profits and avoid emotional decisions.

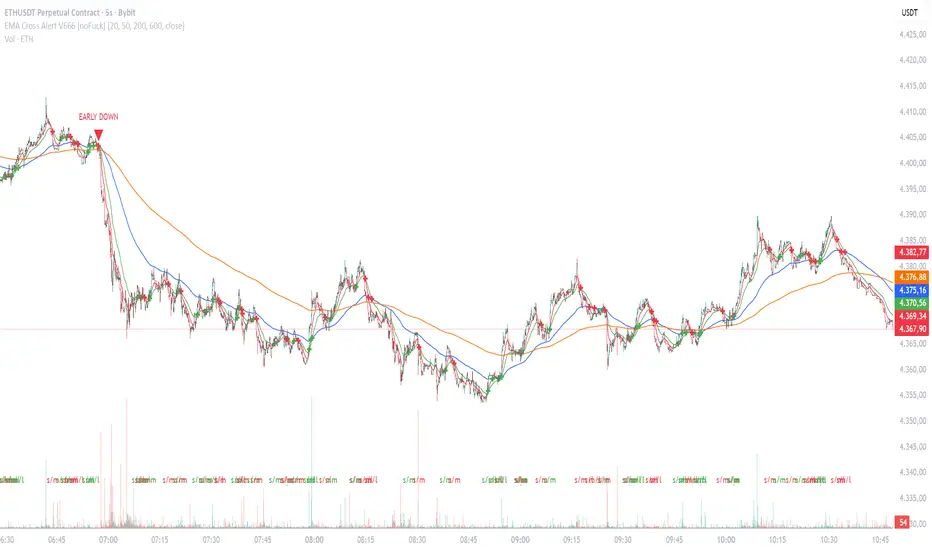
EMA Cross Alert V666 [noFuck]EMA Cross Alert — What it does
EMA Cross Alert watches three EMAs (Short, Mid, Long), detects their crossovers, and reports exactly one signal per bar by priority: EARLY > Short/Mid > Mid/Long > Short/Long. Optional EARLY mode pings when Short crosses Long while Mid is still between them—your polite early heads-up.
Why you might like it
Three crossover types: s/m, m/l, s/l
EARLY detection: earlier hints, not hype
One signal per bar: less noise, more focus
Clear visuals: tags, big cross at signal price, EARLY triangles
Alert-ready: dynamic alert text on bar close + static alertconditions for UI
Inputs (plain English)
Short/Mid/Long EMA length — how fast each EMA reacts
Extra EMA length (visual only) — context EMA; does not affect signals
Price source — e.g., Close
Show cross tags / EARLY triangles / large cross — visual toggles
Enable EARLY signals (Short/Long before Mid) — turn early pings on/off
Count Mid EMA as "between" even when equal (inclusive) — ON: Mid counts even if exactly equal to Short or Long; OFF (default): Mid must be strictly between them
Enable dynamic alerts (one per bar close) — master alert switch
Alert on Short/Mid, Mid/Long, Short/Long, EARLY — per-signal alert toggles
Quick tips
Start with defaults; if you want more EARLY on smooth/low-TF markets, turn “inclusive” ON
Bigger lengths = calmer trend-following; smaller = faster but choppier
Combine with volume/structure/risk rules—the indicator is the drummer, not the whole band
Disclaimer
Alerts, labels, and triangles are not trade ideas or financial advice. They are informational signals only. You are responsible for entries, exits, risk, and position sizing. Past performance is yesterday; the future is fashionably late.
Credits
Built with the enthusiastic help of Code Copilot (AI)—massively involved, shamelessly proud, and surprisingly good at breakfasting on exponential moving averages.