PIP HUNTERSCR STOCH RSI SIGNALScript made in combination of Stoch and RSI, made by and for PIPHUNTERS on 03/10/2019
Stoch default values 10-3-3 higher band level 90, lower band level 10
RSI default value 14 color:blue
חפש סקריפטים עבור "A股+股票筛选器+10元以下"

Simplified SizingEnsure you Uncheck #1 , #2, #3 in the STYLE tab or it draws the lines you only need the numbers for.
The first number is the deviation from the EMA , anything below 1.75 == 1. (less than 0.75 % deviation)
NOTE: The fill area turns yellow @ 1.50 and red above 2.75
There are steps built in to slightly lower share size when specific levels of divergence register:
From 1.75 to 10 , 1 == 1.10 (10% reduction)
From 10 and up, 1 == 1.20 (20% reduction)
The second number is the Average True Range , calculated by the input length (RMA smoothed) and a multiplier (in decimal form).
NOTE: From 930-936 this value is multiplied by 1.5
The third number is the max share size.
The 4th number is the lot price if you take a position at the max size.
INPUTS:
ATR Length
EMA Length for divergence calculation
ATR Multiplier (0.1 - 10)
Equity in account
Max loss per trade.
Good Luck!
Ultimate Moving Average Package (17 MA's)Included is the:
VWAP
Current time frame 10 EMA
Current time frame 20 EMA
Current time frame 50 EMA
Current time frame 10 SMA
Current time frame 20 SMA
Current time frame 50 SMA
Daily 10 EMA
Daily 20 EMA
Daily 50 EMA
Daily 50 SMA
Daily 100 SMA
Daily 200 SMA
Weekly 100 SMA
Weekly 200 SMA
Monthly 100 SMA
Monthly 200 SMA
All Daily/Weekly/Monthly MA's can be seen on intraday charts. Current time frame MA's change depending on your time frame. Obviously you dont need all 17 on your chart but you can pick the ones you like and disable the rest.

A.I.Driven Aggressive Intraday Models For 20190610(New to TradingView and trying to learn how best to share our daily Model Trades with the awesome community here. Still learning the tools here and may not be using the best approaches to publish ideas/charts/scirpts - please help us learn by suggesting best practices)
>>>>> Model Trades Published pre-market this morning at tradersai blogspot <<<<<
***** Medium-Frequency Models*****: For today, Monday 06/10, our medium-frequency models indicate going long on a break above 2903 with a 10-point trailing stop, and going short on a break below 2845 with an 8-point trailing stop.
---Note: For the trades to trigger, the breaks should occur during the regular session hours starting at 9:30am ET. By design, these models do NOT open any new positions after 3:45pm. Only one open position at any given time.---
***** Aggressive Intraday Models *****: For today, Monday 06/10, our aggressive intraday models indicate going long on a break above 2895 or 2886 or 2874 with an 8-point trailing stop, and going short on a break below 2890 or 2882 or 2870 with a 6-point trailing stop.
---- Note: For the trades to trigger, the breaks should occur during regular session hours starting at 9:30am ET. Due to the intraday nature of these aggressive models, they indicate closing any open trades at 3:55pm and remaining flat into the session close. No opening of new positions after 3:45pm. Only one open position at any given time.----

Moving Gain Loss PercentTracks the percentage gain/loss in three ranges:
single candle (can be turned on or off)
custom range of candles
custom range of candles
For example, with a range of 3 candles, and the serie:
1 - close 10
2 - close 5
3 - close 20
The moving gain would be:
1 - close 10 - gain 10, infinite%
2 - close 5 - gain 5, infinite%
3 - close 18 - gain 8, 80%
Or, for example if the range is 12 candles on a monthly chart, then the result is the Year-To-Date gain/loss plotted as a percentage.

Sexy RSI for sexy tradersHello fellow sexy traders.
I was tired of constantly having to add my own horizontals/MAs to the default RSI so I decided to make this modification.
The default settings include channels from 40-80 (green horizontals) for a bullish range, and 20-60 (red horizontals) for the bearish range.
Also includes white line at 50 level, and blue horizontals at extremes (90 and 10).
If RSI stays in one of the red or green range that can signify the trend direction, as directed by Andrew Cardwell (inventor of the RSI).
If you wish for other levels to be included, just let me know! Comment on here or dm me on twitter @boss_charts and I can add the settings for you, so all you have to do is click a button and it will set it to your desired config. I want this to be a tool that is useful for heavy traders to save them time.
Additionally, in order to tell the level of the RSI and how overextended it might be, I added the setting for the RSI to change color depending on its level. Current settings are as follows:
Normal RSI (30-70) = PURPLE
Conventional Overbought/Oversold (30-20 + 70-80) = RED
1st extended (20-15 + 80-85) = PINK
2nd extended (15-10 + 85-90) = ORANGE
VERY EXTENDED (<10 + >90) = YELLOW
That way you can get an idea of how drastic a move is by the color alone. According to Dr. Cardwell, a drastic move to over/under extended can be a sign of strength.
Finally, there are the default MAs added that Mr. Cardwell defines as useful for defining the trend. These being the 9 MA and 45 EMA/WMA.
The strategy with these is to have the MAs on both price and RSI. If the 9MA is above the 45 MA on both price and RSI, then this is bullish and you can look for longs.
Conversely, if the 9 is below the 45 on both RSI and price that is bearish, and you can look for shorts.
I added the background color change for the points where the MAs cross each other, so you do not have to have the MAs fogging up your charts to know where they are relative to one another. This is similar to my MA cross indicator which contains the same functionality.
Never financial advice. Backtest it for yourself and find MA configurations that work for you.
Enjoy! Feel free to send feedback/requests whenever.

Multi SMA EMA WMA HMA BB (5x8 MAs Bollinger Bands) MAX MTF - RRBMulti SMA EMA WMA HMA 4x7 Moving Averages with Bollinger Bands MAX MTF by RagingRocketBull 2019
Version 1.0
All available MAX MTF versions are listed below (They are very similar and I don't want to publish them as separate indicators):
ver 1.0: 4x7 = 28 MTF MAs + 28 Levels + 3 BB = 59 < 64
ver 2.0: 5x6 = 30 MTF MAs + 30 Levels + 3 BB = 63 < 64
ver 3.0: 3x10 = 30 MTF MAs + 30 Levels + 3 BB = 63 < 64
ver 4.0: 5(4+1)x8 = 8 CurTF MAs + 32 MTF MAs + 20 Levels + 3 BB = 63 < 64
ver 5.0: 6(5+1)x6 = 6 CurTF MAs + 30 MTF MAs + 24 Levels + 3 BB = 63 < 64
ver 6.0: 4(3+1)x10 = 10 CurTF MAs + 30 MTF MAs + 20 Levels + 3 BB = 63 < 64
Fib numbers: 8, 13, 21, 34, 55, 89, 144, 233, 377
This indicator shows multiple MAs of any type SMA EMA WMA HMA etc with BB and MTF support, can show MAs as dynamically moving levels.
There are 4 MA groups + 1 BB group, a total of 4 TFs * 7 MAs = 28 MAs. You can assign any type/timeframe combo to a group, for example:
- EMAs 9,12,26,50,100,200,400 x H1, H4, D1, W1 (4 TFs x 7 MAs x 1 type)
- EMAs 8,13,21,30,34,50,55,89,100,144,200,233,377,400 x M15, H1 (2 TFs x 14 MAs x 1 type)
- D1 EMAs and SMAs 8,13,21,30,34,50,55,89,100,144,200,233,377,400 (1 TF x 14 MAs x 2 types)
- H1 WMAs 13,21,34,55,89,144,233; H4 HMAs 9,12,26,50,100,200,400; D1 EMAs 12,26,89,144,169,233,377; W1 SMAs 9,12,26,50,100,200,400 (4 TFs x 7 MAs x 4 types)
- +1 extra MA type/timeframe for BB
There are several versions: Simple, MTF, Pro MTF, Advanced MTF, MAX MTF and Ultimate MTF. This is the MAX MTF version. The Differences are listed below. All versions have BB
- Simple: you have 2 groups of MAs that can be assigned any type (5+5)
- MTF: +2 custom Timeframes for each group (2x5 MTF) +1 TF for BB, TF XY smoothing
- Pro MTF: 4 custom Timeframes for each group (4x3 MTF), 1 TF for BB, MA levels and show max bars back options
- Advanced MTF: +4 extra MAs/group (4x7 MTF), custom Ticker/Symbols, Timeframe <>= filter, Remove Duplicates Option
- MAX MTF: +2 subtypes/group, packed to the limit with max possible MAs/TFs: 4x7, 5x6, 3x10, 4(3+1)x10, 5(4+1)x8, 6(5+1)x6
- Ultimate MTF: +individual settings for each MA, custom Ticker/Symbols
MAX MTF version tests the limits of Pinescript trying to squeeze as many MAs/TFs as possible into a single indicator.
It's basically a maxed out Advanced version with subtypes allowing for mixed types within a group (i.e. both emas and smas in a single group/TF)
Pinescript has the following limits:
- max 40 security calls (6 calls are reserved for dupe checks and smoothing, 2 are used for BB, so only 32 calls are available)
- max 64 plot outputs (BB uses 3 outputs, so only 61 plot outputs are available)
- max 50000 (50kb) size of the compiled code
Based on those limits, you can only have the following MAs/TFs combos in a single script:
1. 4x7, 5x6, 3x10 - total number of MTF MAs must always be <= 32, and you can still have BB and Num Levels = total MAs, without any compromises
2. 5(4+1)x8, 6(5+1)x6, 4(3+1)x10 - you can use the Current Symbol/Timeframe as an extra (+1) fixed TF with the same number of MTF MAs
- you don't need to call security to display MAs on the Current Symbol/Timeframe, so the total number of MTF MAs remains the same and is still <= 32
- to fit that many MAs into the max 64 plot outputs limit you need to reduce the number of levels (not every MA Group will have corresponding levels)
Features:
- 4x7 = 28 MAs of any type
- 4x MTF groups with XY step line smoothing
- +1 extra TF/type for BB MAs
- 2 MA subtypes within each group/TF
- 4x7 = 28 MA levels with adjustable group offsets, indents and shift
- supports any existing type of MA: SMA, EMA, WMA, Hull Moving Average (HMA)
- custom tickers/symbols for each group
- show max bars back option
- show/hide both groups of MAs/levels/BB and individual MAs
- timeframe filter: show only MAs/Levels with TFs <>= Current TF
- hide MAs/Levels with duplicate TFs
- support for custom TFs that are not available in free accounts: 2D, 3D etc
- support for timeframes in H: H, 2H, 4H etc
Notes:
- Uses timeframe textbox instead of input resolution dropdown to allow for 240 120 and other custom TFs
- Uses symbol textbox instead of input symbol to avoid establishing multiple dummy security connections to the current ticker - otherwise empty symbols will prevent script from running
- Possible reasons for missing MAs on a chart:
- there may not be enough bars in history to start plotting it. For example, W1 EMA200 needs at least 200 bars on a weekly chart.
- for charts with low/fractional prices i.e. 0.00002 << 0.001 (default Y smoothing step) decrease Y smoothing as needed (set Y = 0.0000001) or disable it completely (set X,Y to 0,0)
- for charts with high price values i.e. 20000 >> 0.001 increase Y smoothing as needed (set Y = 10-20). Higher values exceeding MAs point density will cause it to disappear as there will be no points to plot. Different TFs may require diff adjustments
- TradingView Replay Mode UI and Pinescript security calls are limited to TFs >= D (D,2D,W,MN...) for free accounts
- attempting to plot any TF < D1 in Replay Mode will only result in straight lines, but all TFs will work properly in history and real-time modes. This is not a bug.
- Max Bars Back (num_bars) is limited to 5000 for free accounts (10000 for paid), will show error when exceeded. To plot on all available history set to 0 (default)
- Slow load/redraw times. This indicator becomes slower, its UI less responsive when:
- Pinescript Node.js graphics library is too slow and inefficient at plotting bars/objects in a browser window. Code optimization doesn't help much - the graphics engine is the main reason for general slowness.
- the chart has a long history (10000+ bars) in a browser's cache (you have scrolled back a couple of screens in a max zoom mode).
- Reload the page/Load a fresh chart and then apply the indicator or
- Switch to another Timeframe (old TF history will still remain in cache and that TF will be slow)
- in max possible zoom mode around 4500 bars can fit on 1 screen - this also slows down responsiveness. Reset Zoom level
- initial load and redraw times after a param change in UI also depend on TF. For example: D1/W1 - 2 sec, H1/H4 - 5-6 sec, M30 - 10 sec, M15/M5 - 4 sec, M1 - 5 sec. M30 usually has the longest history (up to 16000 bars) and W1 - the shortest (1000 bars).
- when indicator uses more MAs (plots) and timeframes it will redraw slower. Seems that up to 5 Timeframes is acceptable, but 6+ Timeframes can become very slow.
- show_last=last_bars plot limit doesn't affect load/redraw times, so it was removed from MA plot
- Max Bars Back (num_bars) default/custom set UI value doesn't seem to affect load/redraw times
- In max zoom mode all dynamic levels disappear (they behave like text)
- Dupe check includes symbol: symbol, tf, both subtypes - all must match for a duplicate group
- For the dupe check to work correctly a custom symbol must always include an exchange prefix. BB is not checked for dupes
Good Luck! Feel free to learn from/reuse the code to build your own indicators.

APEX - WaveTrend [v1]WaveTrend is a smoothed oscillator which enables it to detect true reversals in an extremely accurate manner. The beauty of this indicator is that does not generate signals during choppy sideways markets.
The basic settings are 10 / 3 / 4 these are very aggressive settings, that will generate a lot of signals in all even not so volatile markets. If you need high-quality signals you settings close to 10 / 3 /21. The strongest buy/sell signals are given when the cross occurs above or below the threshold. In the 10 / 3 / 4 you threshold for buy should be around -90 values. If you use the very smoothed variant the threshold will be around -45 to -50 values.
This indicator will be first available in APEX v1 currently being beta tested.

Schaff Trend Cycle 1.1 with signal codingThis is an edit of Lazy Bear's Schaff Trend Cycle original description here. I've added in the syntax so that you can generate an alert when it crosses the threshold in either direction. Just tick the box to show threshold crosses.
More background on the indicator is here.
www.investopedia.com
Other common settings are fast 23 slow 53 or 10/30, 3/10. I have also set it to 9/20 for test purposes. They have different pluses and minuses on different timeframes.
Double EMA & ALMA StrategyThe ALMA (50 period) acts as the main trend filter, meaning that long positions are taken above the ALMA and short positions are taken below the ALMA. For instance, the 5 and 10 period exponential moving averages are added on the chart to give early signals to the trend.
Therefore, when the 5/10 EMA triggers a bullish crossover, long signals are taken when price is above the ALMA, likewise, when the 5/10 EMA triggers a bearish crossover, short signals are taken when price is below the ALMA.
Find out optimal values by trying. May not produce accurate results in horizontal markets. Thank you.

Inverted Yield Curve with VIX Fear IndexUS 2 year and US 10 year comparison, inverted yield curve with VIX. I use this on a weekly chart with 2 moving averages, the 40 week (ma200 daily) and the 520 week (10 year median).
The bottom histogram is the VIX and the plot is the yield curve. When the VIX is above a certain level (you can set it in settings) and the ýield curve is close to or at inversion the background goes red.
The last seven recessions were preceded by an inverted yield curve. Here I combined the two main fear indexes, the VIX and the run for safe US treasuries (Inverted Yield Curve).
This is preset to the 2 year and 10 year US bond, weekly, and the normal VIX ticker but you can set it to whatever you like.
Published with source code for anyone to modify. Please comment below if you do so! This is the second in a series of indicators I intend to publish as a package of economic recoverty/recession symptom indicators.
Follow me for updates, next one up is commodities with dr Copper and oil!

Advanced Larry Williams 9.2- By EduHit rate greater than Setup 9.1
However, the stop of this setup becomes more expensive in certain situations.
PURCHASE SIGN
1 - Paper comes in a bullish trend in the operational term to be operated.
2 - Exponential moving average of 9 upward periods.
3 - Wait for a candle to make the largest closing (candle reference).
4 - If the next candle CLOSES below the minimum of the candle reference the setup is armed.
5 - Mark the candle maxim that closed below the reference. It's the trigger!
6 - If the next candle exceeds this maximum by 1 cent the trade is triggered. Put the stop loss at the low of the candle that closed below (0.01 to 0.10 below)
7 - If the next candle does not fire, let's lower the trigger to the lower maximums, SINCE the mm9exp does not turn down.
8 - It exceeded the maximum we will have the entrance.
9 - Original stop-loss in the minimum of the candle we set the maximum activated.
SIGN OF SALE
1 - Paper comes in a downtrend in the operating period to be operated.
2 - Exponential moving average of 9 periods descending.
3 - Wait for a candle that makes the lowest closing (candle reference).
4 - If the next candle CLOSE above the maximum of the reference candle the setup is armed.
5 - Bookmark the candle that closed above the reference. It's the trigger!
6 - If the next candle breaks this minimum, the trade is triggered.
7 - Place the stop-loss at the maximum of the candle that closed up.
8 - If the next candle does not trigger, we will raise the trigger to the highest minimums SINCE the exponential moving average of 9 periods does not turn upwards.
9 - It broke the minimum we will have the entrance.
10 - Stop-loss original in the maximum of the candle that we set the minimum activated.
*********************************************************************************************************************************************************
Índice de acerto Superior ao Setup 9.1
Porém o stop deste setup acaba se tornando mais caro em determinadas situações.
SINAL DE COMPRA
1 - Papel vem em tendência de alta no prazo operacional a ser operado.
2 - Média móvel exponencial de 9 períodos ascendente.
3 - Aguardar um candle que faça o maior fechamento (candle referência).
4 - Se o próximo candle FECHAR abaixo da mínima do candle referência o setup está armado.
5 - Marcar a máxima do candle que fechou abaixo do referência. É o gatilho!
6 - Se o próximo candle superar essa máxima em 1 centavo o trade é acionado. Colocar o stop-loss na mínima do candle que fechou abaixo (0,01 a 0,10 abaixo)
7 - Se o próximo candle não acionar, vamos abaixando o gatilho para as máximas menores DESDE QUE a mm9exp não vire para baixo.
8 - Superou a máxima teremos a entrada.
9 - Stop-loss original na mínima do candle que marcamos a máxima ativada.
SINAL DE VENDA
1 - Papel vem em tendência de baixa no prazo operacional a ser operado.
2 - Média móvel exponencial de 9 períodos descendente.
3 - Aguardar um candle que faça o menor fechamento (candle referência).
4 - Se o próximo candle FECHAR acima da máxima do candle referência o setup está armado.
5 - Marcar a mínima do candle que fechou acima do referência. É o gatilho!
6 - Se o próximo candle romper essa mínima o trade é acionado.
7 - Colocar o stop-loss na máxima do candle que fechou acima.
8 - Se o próximo candle não acionar, vamos levantando o gatilho para as mínimas maiores DESDE QUE a média móvel exponencial de 9 períodos não vire para cima.
9 - Rompeu a mínima teremos a entrada.
10 - Stop-loss original na máxima do candle que marcamos a mínima ativada.

Reset Every (Price)Someone requested a high/low price indicator that would reset the "remembered" prices daily. I started out doing just that, and then decided to make it much more configurable.
Choose the units (minutes, hours, days, weeks, months) and the number of those units, and this will reset the highest/lowest value remembered to the current values on your chosen time interval.
This should work with any time interval you desire, within reason...asking for resets every 4000 hours on a monthly chart will probably not work.
GE, monthly, every 7 months:
Ford, weekly, every 18 months:
Dow Jones Industrial Average, weekly, every 90 days:
LTCBTC, daily, every 10 days:
ETHUSD, 30 minutes, every 10 days:
BTCUSD, 1 minute, every 10 hours:
EURUSD, 1 minute, every 50 minutes:
Also, I am about to publish another version of this with just one source input that can be applied to any indicator...stay tuned!

XPloRR MA-Trailing-Stop StrategyXPloRR MA-Trailing-Stop Strategy
Long term MA-Trailing-Stop strategy with Adjustable Signal Strength to beat Buy&Hold strategy
None of the strategies that I tested can beat the long term Buy&Hold strategy. That's the reason why I wrote this strategy.
Purpose: beat Buy&Hold strategy with around 10 trades. 100% capitalize sold trade into new trade.
My buy strategy is triggered by the fast buy EMA (blue) crossing over the slow buy SMA curve (orange) and the fast buy EMA has a certain up strength.
My sell strategy is triggered by either one of these conditions:
the EMA(6) of the close value is crossing under the trailing stop value (green) or
the fast sell EMA (navy) is crossing under the slow sell SMA curve (red) and the fast sell EMA has a certain down strength.
The trailing stop value (green) is set to a multiple of the ATR(15) value.
ATR(15) is the SMA(15) value of the difference between the high and low values.
The scripts shows a lot of graphical information:
The close value is shown in light-green. When the close value is lower then the buy value, the close value is shown in light-red. This way it is possible to evaluate the virtual losses during the trade.
the trailing stop value is shown in dark-green. When the sell value is lower then the buy value, the last color of the trade will be red (best viewed when zoomed)(in the example, there are 2 trades that end in gain and 2 in loss (red line at end))
the EMA and SMA values for both buy and sell signals are shown as a line
the buy and sell(close) signals are labeled in blue
How to use this strategy?
Every stock has it's own "DNA", so first thing to do is tune the right parameters to get the best strategy values voor EMA , SMA, Strength for both buy and sell and the Trailing Stop (#ATR).
Look in the strategy tester overview to optimize the values Percent Profitable and Net Profit (using the strategy settings icon, you can increase/decrease the parameters)
Then keep using these parameters for future buy/sell signals only for that particular stock.
Do the same for other stocks.
Important : optimizing these parameters is no guarantee for future winning trades!
Here are the parameters:
Fast EMA Buy: buy trigger when Fast EMA Buy crosses over the Slow SMA Buy value (use values between 10-20)
Slow SMA Buy: buy trigger when Fast EMA Buy crosses over the Slow SMA Buy value (use values between 30-100)
Minimum Buy Strength: minimum upward trend value of the Fast SMA Buy value (directional coefficient)(use values between 0-120)
Fast EMA Sell: sell trigger when Fast EMA Sell crosses under the Slow SMA Sell value (use values between 10-20)
Slow SMA Sell: sell trigger when Fast EMA Sell crosses under the Slow SMA Sell value (use values between 30-100)
Minimum Sell Strength: minimum downward trend value of the Fast SMA Sell value (directional coefficient)(use values between 0-120)
Trailing Stop (#ATR): the trailing stop value as a multiple of the ATR(15) value (use values between 2-20)
Example parameters for different stocks (Start capital: 1000, Order=100% of equity, Period 1/1/2005 to now) compared to the Buy&Hold Strategy(=do nothing):
BEKB(Bekaert): EMA-Buy=12, SMA-Buy=44, Strength-Buy=65, EMA-Sell=12, SMA-Sell=55, Strength-Sell=120, Stop#ATR=20
NetProfit: 996%, #Trades: 6, %Profitable: 83%, Buy&HoldProfit: 78%
BAR(Barco): EMA-Buy=16, SMA-Buy=80, Strength-Buy=44, EMA-Sell=12, SMA-Sell=45, Strength-Sell=82, Stop#ATR=9
NetProfit: 385%, #Trades: 7, %Profitable: 71%, Buy&HoldProfit: 55%
AAPL(Apple): EMA-Buy=12, SMA-Buy=45, Strength-Buy=40, EMA-Sell=19, SMA-Sell=45, Strength-Sell=106, Stop#ATR=8
NetProfit: 6900%, #Trades: 7, %Profitable: 71%, Buy&HoldProfit: 2938%
TNET(Telenet): EMA-Buy=12, SMA-Buy=45, Strength-Buy=27, EMA-Sell=19, SMA-Sell=45, Strength-Sell=70, Stop#ATR=14
NetProfit: 129%, #Trade

Renko Price Bars Overlay// Shows the price renko bars (or range bars) instead of the PERIOD renko
// bars that are integrated into Trading View. The normal renko bars that
// Trading View offers only consider the drawing of a new brick when the
// price closes above or below the required brick size. This can produce
// misleading charts since depending on the time interval of a chart, new
// bricks may or may not be drawn. True price renko bars will draw a new
// brick immediately upon the price exceeding the next target brick size.
// When running this script in "Traditional" mode, the painting of the
// brick overlay band is INDEPENDENT of the chart interval. If price
// exceeds the required target price for the next brick, the band is
// updated immediately, instead of waiting for the price bar on the chart
// interval to close first. The brick starting anchor point will attempt
// to be a "nice number" at a round interval for the chart ticker. For
// example, if viewing EURUSD with the box size equal to 50 ticks/pips,
// the open and close prices will take the form of 1.2100, 1.2150, 1.2200,
// 1.2250, and so on. This is the same behavior as the normal traditional
// Renko bars in Trading View and other major trading platforms such as
// Meta Trader.
// Use the tick size in traditional mode to specify the block size, in
// ticks. This may give interesting results in FOREX pairs... as the tick
// size in Trading View may be 0.00001 instead of the normal pip size of
// 0.0001, so a 10 pip block size may be '100', and not the expected '10'.
// FOREX futures should work in the manner expected, a 10 pip block size
// will indeed equal 0.0010.
// The "ATR" mode functions differently than the Trading View built in
// version. The block size is updated each time the range is exceeded.
// In Trading View, when using the ATR mode, the ATR is the last ATR
// value calculated on the ENTIRE data interval, and is applied to all
// past data. You can see this when you press the '+' sign of the ticker
// in the top left of the chart window and you will see the brick size
// as a constant, the brick size is not a function of the ever changing
// ATR value of the price action. The block size of this script is not
// updated for each price candle (i.e. each 1HR on a 1HR chart), instead
// it is updated only when the price thresholds are exceeded requiring a
// the band to be updated. At that point the current ATR is considered
// and the brick size is updated.
// Options exist to show the current high and low of the brick, and to
// show the required levels that the price must exceed to draw a new
// brick and update the band.
Please leave comments if you notice any bugs or would like any new features added. I don't find much use for plotting the H/L of the current renko candle, but I have seen some request it in the past.
Cheers.

EMA Indicators with BUY sell SignalCombine 3 EMA indicators into 1. Buy and Sell signal is based on
- Buy signal based on 20 Days Highest High resistance
- Sell signal based on 10 Days Lowest Low support
Input :-
1 - Short EMA (20), Mid EMA (50) and Long EMA (200)
2 - Resistance (20) = 20 Days Highest High line
3 - Support (10) = 10 Days Lowest Low line

Volume Range EventsChanges in the feelings (positive, negative, neutral) in the market concerning the valuation of an instrument are often preceded with sudden outbursts of buying and selling frenzies. The aim of this indicator is to report such outbursts. We can see them as expansions of volume, sometimes 10 times more than usual. and as extensions of the trading range, also sometimes 10 times more than usual (e.g. usual range is 10 cent suddenly a whole dollar.) The changes are calculated in such a way that these fit between plus and minus 100 percent, the bars are scaled in some sort of logarithmic way. The Emoline is the same as the one in the True Balance of Power indicator, which I already published
ONLY RISES ARE EVENTS
Sometimes analysts are tempted to give meaning to low volume or small ranges. These simply mean that the market has little interest in trading this instrument. I believe that in such cases the trader needs to wait for expansion and extension events to happen, then he can make a better guess of where the market is heading. As events often mark the beginning or ending of a trend, this indicator provides an early and clear signal, because it doesn’t bother us about non-events.
WHAT IS USUAL?
If the algorithm would use an average as a normal to scale volume or range events, then previous peaks will act as spoilers by making the average so high that a following peak is scaled too small. I developed a function, usual() , that kicks out all extremes of a ‘population of values’ and which returns the average of the non-extreme values. It can be called with any serial. This function is called by both algorithms that report volume and range peaks, which guarantees that the results are really comparable. As this function has a fixed look back of 8 periods, we might state that ‘usual’ is a short lived relative value. I think this doesn’t matter for the practical use of the indicator.
COLORING AND INTERPRETATION
I follow the categories in the ‘Better Volume Indicator’, published by LeazyBear, these are:
1. Climactic Volumes, event >40 % (this means peak is 1.5 X usual)
LIME: Climax Buying Volume, direction up, range event also > 30 %
RED: Climax Selling Volume, direction down, range event also > 30 %
AQUA: Climax Churning Volume, both directions, range event < 30%
2. Smaller Volumes, event <40 %
GREEN: Supportive Volume, both directions, if combined with range event
BLUE: Churning Volume, both directions, if not combined with range event (Professional Trading)
3. Just Range Events
BLACK histogram bars (Amateurish Trading)

Forex Master v4.0 (EUR/USD Mean-Reversion Algorithm)DESCRIPTION
Forex Master v4.0 is a mean-reversion algorithm currently optimized for trading the EUR/USD pair on the 5M chart interval. All indicator inputs use the period's closing price and all trades are executed at the open of the period following the period where the trade signal was generated.
There are 3 main components that make up Forex Master v4.0:
I. Trend Filter
The algorithm uses a version of the ADX indicator as a trend filter to trade only in certain time periods where price is more likely to be range-bound (i.e., mean-reverting). This indicator is composed of a Fast ADX and a Slow ADX, both using the same look-back period of 50. However, the Fast ADX is smoothed with a 6-period EMA and the Slow ADX is smoothed with a 12-period EMA. When the Fast ADX is above the Slow ADX, the algorithm does not trade because this indicates that price is likelier to trend, which is bad for a mean-reversion system. Conversely, when the Fast ADX is below the Slow ADX, price is likelier to be ranging so this is the only time when the algorithm is allowed to trade.
II. Bollinger Bands
When allowed to trade by the Trend Filter, the algorithm uses the Bollinger Bands indicator to enter long and short positions. The Bolliger Bands indicator has a look-back period of 20 and a standard deviation of 1.5 for both upper and lower bands. When price crosses over the lower band, a Long Signal is generated and a long position is entered. When price crosses under the upper band, a Short Signal is generated and a short position is entered.
III. Money Management
Rule 1 - Each trade will use a limit order for a fixed quantity of 50,000 contracts (0.50 lot). The only exception is Rule
Rule 2 - Order pyramiding is enabled and up to 10 consecutive orders of the same signal can be executed (for example: 14 consecutive Long Signals are generated over 8 hours and the algorithm sends in 10 different buy orders at various prices for a total of 350,000 contracts).
Rule 3 - Every order will include a bracket with both TP and SL set at 50 pips (note: the algorithm only closes the current open position and does not enter the opposite trade once a TP or SL has been hit).
Rule 4 - When a new opposite trade signal is generated, the algorithm sends in a larger order to close the current open position as well as open a new one (for example: 14 consecutive Long Signals are generated over 8 hours and the algorithm sends in 10 different buy orders at various prices for a total of 350,000 contracts. A Short Signal is generated shortly after the 14th Long Signal. The algorithm then sends in a sell order for 400,000 contracts to close the 350,000 contracts long position and open a new short position of 50,000 contracts).

My5min1. Follow the instructions for entry and exit exactly as above. Don’t second guess, or assume/presume anything.
2. Avoid entering the trade when the price is temporarily above /below 10 day MA, but the price candle hasn’t fully formed yet. Enter the trade only after the price candle closes above/below the 10 day MA.
3. Exit the trade immediately when the price candle closes above/below 10 day MA in the direction opposite to the trade. Don’t remain in the trade wishing it to turn in your favor.
4. Never ever trade in the opposite direction of the market. i.e. don’t buy when the price is below 200 day MA and sell when the price is above 200 day MA.
5. Take profits when limit is reached. Don’t be greedy and keep on increasing the target. Remember- A bird in hand is worth two in the bush.

MACD, backtest 2015+ only, cut in half and doubledThis is only a slight modification to the existing "MACD Strategy" strategy plugin!
found the default MACD strategy to be lacking, although impressive for its simplicity. I added "year>2014" to the IF buy/sell conditions so it will only backtest from 2015 and beyond ** .
I also had a problem with the standard MACD trading late, per se. To that end I modified the inputs for fast/slow/signal to double. Example: my defaults are 10, 21, 10 so I put 20, 42, 20 in. This has the effect of making a 30min interval the same as 1 hour at 10,21,10. So if you want to backtest at 4hr, you would set your time interval to 2hr on the main chart. This is a handy way to make shorter time periods more useful even regardless of strategy/testing, since you can view 15min with alot less noise but a better response.
Used on BTCCNY OKcoin, with the chart set at 45 min (so really 90min in the strategy) this gave me a percent profitable of 42% and a profit factor of 1.998 on 189 trades.
Personally, I like to set the length/signals to 30,63,30. Meaning you need to triple the time, it allows for much better use of shorter time periods and the backtests are remarkably profitable. (i.e. 15min chart view = 45min on script, 30min= 1.5hr on script)
** If you want more specific time periods you need to try plugging in different bar values: replace "year" with "n" and "2014" with "5500". The bars are based on unix time I believe so you will need to play around with the number for n, with n being the numbers of bars.

Test此指標為測試階段
最近手法改變,高點出現率後移,
此指標為爆量後跌破12ema才放空,
由於操盤手還是可以騙線,故時間設定為10:00之後成功率比較大
This indicator is in the testing phase.
Recently, the method has changed, and the occurrence rate of high points has shifted later.
This indicator only calls for shorting after a surge in volume followed by a drop below the 12-day moving average (EMA).
Because traders can still create false signals, setting the time after 10:00 AM increases the success rate.
Liquidity Sweep Guardian-NQ versionThis indicator is only optimized for CME future NQ or MNQ. If you want to use for other product, adjust your own setting.
The indicator is used as a visual aid for warning trader do not fade trend before PDL or PDH liquidity sweep. The box wrapper around PDH and PDL is a warning box. Liquidity can be super thin when price is approaching the box, so do not fade the trend (counter trend trading when you are near the box before PDH or PDL sweep.
There is no universal strategy if you should go long or short when PDL or PDH is reached, but this indicator is designed for trader to avoid get caught when fading a trend that is going to sweep PDL or PDH.
example here
Here is the Full guide:
# Liquidity Sweep Guardian
## Overview
A visual warning system that helps traders avoid premature counter-trend entries near key liquidity levels (Previous Day High/Low). The indicator displays danger zones centered on PDH/PDL and tracks when these levels have been swept and reclaimed.
**This is a WARNING system, not a trade signal generator.**
---
## The Problem It Solves
One of the most common trading mistakes:
> Price is falling toward PDL. You see a bullish candle 40 points above PDL and think "maybe it reverses here." You enter long. Price then accelerates DOWN, sweeps PDL, and your stop gets hit. The reversal you wanted happens AFTER the sweep—without you.
This indicator prevents that mistake by:
1. Showing you when you're in the "danger zone" near a key level
2. Warning you NOT to fade until the level has been swept
3. Unlocking fade consideration only AFTER sweep + reclaim
---
## How It Works
### Danger Zone (Red Box)
- Centered on PDH and PDL
- Default: ±75 points (150 point total zone)
- When price is in this zone and the level hasn't been swept → **avoid counter-trend trades**
### Critical Zone (Inner Red Box)
- Tighter zone around the level
- Default: ±25 points
- Highest risk area for premature entries
### Sweep Detection
When price penetrates beyond the level:
- **SWEEP** (10-25 pts): Normal liquidity grab, watch for reclaim
- **EXTENDED** (25-50 pts): Deeper than typical, use caution
- **CONTINUATION** (50+ pts): Likely trend continuation, not a sweep
### Unlock Condition
**"🔓 LONG UNLOCKED"** or **"🔓 SHORT UNLOCKED"** appears when:
1. The level has been swept (price went beyond it)
2. Price has reclaimed back through the level
3. Sweep depth was NOT in continuation territory (50+ pts)
**UNLOCKED means you MAY now consider a fade setup. It is NOT an entry signal.**
---
## Visual Elements
| Element | Description |
|---------|-------------|
| **Red Box** | Danger zone - avoid fading until swept |
| **Inner Red Box** | Critical zone - highest trap risk |
| **Green Box** | Zone is unlocked - sweep complete |
| **"SWEEP" Label** | Level has been penetrated |
| **"🔓 UNLOCKED" Label** | Sweep complete + reclaim - may consider fade |
| **"⚠️ CONTINUATION?" Label** | Deep penetration (50+ pts) - likely not a reversal |
---
## Settings
### Danger Zone Settings
- **Danger Zone Size**: Distance above AND below level (default: 75 pts)
- **Critical Zone Size**: Inner high-risk zone (default: 25 pts)
### Sweep Classification
- **Real Sweep Min/Max**: Point range for normal sweep (default: 10-25 pts)
- **Fake Sweep / Continuation**: Depth that suggests continuation (default: 50 pts)
- **Max Bars for Reclaim**: How quickly price should reclaim (default: 5 bars)
---
## How to Use
### ❌ DON'T
- Enter long when price is in PDL danger zone and PDL hasn't been swept
- Enter short when price is in PDH danger zone and PDH hasn't been swept
- Fade immediately when you see the "SWEEP" label
- Treat "UNLOCKED" as a buy/sell signal
### ✅ DO
- Wait for the SWEEP label before considering a fade
- Wait for the UNLOCKED label before looking for entry setups
- Use your own entry criteria AFTER unlock (consolidation, reclaim, patterns, etc.)
- Respect deep penetrations (50+ pts) as potential continuation, not reversal
---
## The Core Concept
**Price often accelerates INTO liquidity sweeps.**
That bullish candle you see 40 points above PDL? It's often the last gasp before the sweep, not the reversal. Smart money needs to:
1. Sweep the lows (trigger stops)
2. Grab liquidity
3. THEN reverse
By waiting for the sweep + reclaim, you align with this flow instead of getting trapped.
---
## Alerts
- **Entering Danger Zone**: Price entering PDH/PDL zone
- **Swept**: Level has been penetrated
- **Unlocked**: Sweep complete + reclaim
- **Deep Continuation**: 50+ point penetration warning
---
## Best Practices
1. **Patience over prediction**: Don't anticipate the sweep—wait for it
2. **Unlock ≠ Entry**: Unlocked means you can START looking for setups
3. **Respect continuation**: 50+ point penetration often means trend continues
4. **Use with your system**: This is a filter/warning, not a strategy
---
## Notes
- Designed for NQ/ES futures but works on any instrument
- Adjust point values for different instruments (e.g., ES uses smaller values)
- Session resets at 6PM ET (CME futures session)
- Works on any timeframe
---
## Summary
> **Don't fade until swept. Don't enter until unlocked. Unlocked ≠ Entry signal.**
The indicator's job is to keep you OUT of bad trades, not get you INTO trades. Your job is to find quality entries AFTER the indicator gives you permission to look.
---
*"The reversal you want comes AFTER the sweep. Every time. And when it doesn't? It wasn't a reversal—it was continuation. Either way, waiting was the right choice."*

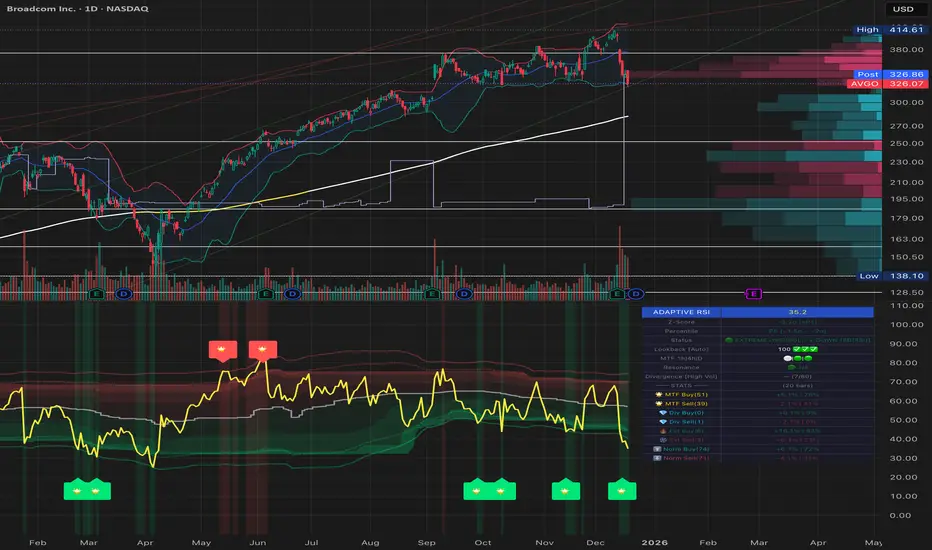
Adaptive RSI Pro# Adaptive RSI Pro / 自适应RSI专业版
[! (img.shields.io)](www.tradingview.com)
[! (img.shields.io)](www.tradingview.com)
[! (img.shields.io)](opensource.org)
Dynamic overbought/oversold thresholds + Multi-Timeframe analysis + Divergence detection + Signal statistics.
根据每个标的实际历史分布动态计算超买/超卖阈值,结合多时间框架分析、背离检测和信号统计。
**Pine Script v6** | **Last Update: 2025-12-17** | **v6.2**
---
## Emoji Legend / 信号图例
### Chart Signals / 图表信号
#### Buy Signals / 买入信号 (底部显示)
| Emoji | Signal Name | Condition | Priority | Action |
|-------|-------------|-----------|----------|--------|
| 🌟 | MTF + Extreme | 3+ timeframes oversold + Z<−2σ | ★★★★★ | **STRONG BUY** 强力买入 |
| 💎 | Divergence + Extreme | Bullish divergence in Z<−2σ zone | ★★★★☆ | **BUY** 买入 |
| 🔥 | Extreme Oversold | Z-Score crosses below −2σ (≈P2) | ★★★☆☆ | **BUY** 买入 |
| ⬆️ | Normal Oversold | Z-Score crosses below −1.5σ (≈P7) | ★★☆☆☆ | Consider buy 考虑买入 (默认隐藏) |
| ↗️ | Bullish Divergence | Price↓ RSI↑ (not in extreme zone) | ★☆☆☆☆ | Watch 观察 (潜在底部) |
#### Sell Signals / 卖出信号 (顶部显示)
| Emoji | Signal Name | Condition | Priority | Action |
|-------|-------------|-----------|----------|--------|
| 🌟 | MTF + Extreme | 3+ timeframes overbought + Z>+2σ | ★★★★★ | **STRONG SELL** 强力卖出 |
| 💎 | Divergence + Extreme | Bearish divergence in Z>+2σ zone | ★★★★☆ | **SELL** 卖出 |
| ❄️ | Extreme Overbought | Z-Score crosses above +2σ (≈P98) | ★★★☆☆ | **SELL** 卖出 |
| ⬇️ | Normal Overbought | Z-Score crosses above +1.5σ (≈P93) | ★★☆☆☆ | Consider sell 考虑卖出 (默认隐藏) |
| ↘️ | Bearish Divergence | Price↑ RSI↓ (not in extreme zone) | ★☆☆☆☆ | Watch 观察 (潜在顶部) |
> **Priority System / 优先级系统**: Only the highest priority signal is shown to prevent overlapping.
> 只显示最高优先级信号,避免叠加。
---
### Dashboard Status / 仪表盘状态
| Emoji | Status | Meaning |
|-------|--------|---------|
| 🟢 | EXTREME OVERSOLD | Z-Score < −2σ (≈P2.3), strong buy zone / 极端超卖区,强买区 |
| 🟡 | OVERSOLD | Z-Score < −1.5σ (≈P6.7), oversold / 超卖 |
| ⚪ | NEUTRAL | −1.5σ ≤ Z-Score ≤ +1.5σ, no signal / 中性,无信号 |
| 🟠 | OVERBOUGHT | Z-Score > +1.5σ (≈P93.3), overbought / 超买 |
| 🔴 | EXTREME OVERBOUGHT | Z-Score > +2σ (≈P97.7), strong sell zone / 极端超买区,强卖区 |
### MTF Status / 多周期状态
| Emoji | Meaning |
|-------|---------|
| 🟢 | Timeframe oversold / 该周期超卖 |
| 🔴 | Timeframe overbought / 该周期超买 |
| ⚪ | Timeframe neutral / 该周期中性 |
### Divergence Status / 背离状态
| Emoji | Meaning |
|-------|---------|
| 🟢 BULL DIV | Bullish divergence detected / 检测到看涨背离 |
| 🔴 BEAR DIV | Bearish divergence detected / 检测到看跌背离 |
| — | No divergence / 无背离 |
---
### Alert Emojis / 警报图标
| Emoji | Alert Type | Description |
|-------|------------|-------------|
| 🎯 | Smart Alert | V6 Unified Alert System / V6统一警报系统 |
---
## Overview / 概述
Traditional RSI uses fixed 30/70 thresholds, but different assets have different volatility characteristics.
传统RSI使用固定的30/70阈值,但不同标的有不同的波动特性。
**Solution**: Calculate thresholds using historical percentiles (P5-P95) + advanced features.
**解决方案**:使用历史百分位(P5-P95)计算阈值 + 高级功能。
---
## Features / 功能特性
### 🎯 Adaptive Thresholds / 自适应阈值
- **Z-Score Based Signals**: Uses statistical Z-Score (±2σ for extreme, ±1.5σ for normal) for consistent cross-asset performance
使用统计Z-Score(极端±2σ,普通±1.5σ)实现跨资产一致性
- **Percentile Lines**: Display P5/P10/P25/P50/P75/P90/P95 for visual reference
百分位线(P5-P95)作为视觉参考
- **Dual Display Modes**: Show Z-Score lines, Percentile lines, or both
双重显示模式:可选择显示Z值线、百分位线或两者
### 🔬 Auto-Adaptive Lookback / 自动自适应回看期
- **Statistical Formula**: Uses `n = (Z × σ / E)²` for optimal sample size calculation
统计公式:使用样本量公式自动计算最优回看期
- **Dual Volatility System**: Combines short-term (4× RSI length) and long-term volatility (configurable: 6M/1Y/2Y)
双重波动率系统:结合短期和长期波动率动态调整
- **Precision Control**: Choose High/Normal/Low precision (adjusts acceptable error margin)
精度控制:高/普通/低精度可选(调整统计误差容忍度)
- **Health Indicators**: Real-time validation of sample coverage, distribution spread, and statistical validity
健康度指标:实时验证样本覆盖率、分布宽度和统计有效性
### 📈 Auto-Adaptive Trend Filter / 自动自适应趋势过滤
- **Auto Mode**: Automatically selects optimal filter based on RSI volatility percentiles
自动模式:根据RSI波动率百分位自动选择最优过滤器
- **5 Filter Modes**: Fixed 50, Adaptive P50, SMA(RSI), BB(RSI), or Auto
5种过滤模式:固定50、自适应P50、RSI均线、布林带或自动
- **Smart Selection**: Low volatility → Fixed 50, Medium → Adaptive P50, High → BB(RSI)
智能选择:低波动→固定50,中波动→自适应P50,高波动→布林带
### 🌍 Multi-Timeframe RSI / 多时间框架RSI
- **3 Configurable Timeframes**: View RSI status across multiple timeframes (default: 1h/4h/D)
3个可配置时间框架:跨周期查看RSI状态(默认:1小时/4小时/日线)
- **Auto-Skip Duplicates**: Automatically detects and skips timeframes matching current chart
自动跳过重复:自动检测并跳过与当前图表相同的时间框架
- **Resonance Detection**: Triggers when 3+ valid timeframes agree (oversold/overbought)
共振检测:当3个以上有效时间框架一致时触发强信号
>
> **MTF Signal Confirmation Timing / 信号确认时机**
>
> - Current timeframe signals update in real-time, confirmed on bar close
> - Higher timeframe signals (e.g., Daily on 1H chart) only update after that timeframe's bar closes
> - **Best Practice**: Wait for current timeframe bar close before acting on MTF resonance signals
>
> - 当前图表周期的信号:实时更新,K线收盘确认
> - 高周期信号(如日线):仅在该周期K线收盘后更新
> - **最佳实践**:MTF共振信号建议在当前周期K线收盘后再做交易决策
### 💎 Auto-Adaptive Divergence Detection / 自动自适应背离检测
- **Auto Mode**: Automatically selects parameters based on asset volatility (using ATR)
自动模式:基于资产波动率(ATR)自动选择参数
- **4 Preset Modes**: Low Vol (3/40), Normal (5/60), High Vol (7/80), Crypto (10/120)
4种预设模式:低波动/普通/高波动/加密货币,分别对应不同的回看/范围参数
- **Extreme Zone Detection**: Distinguishes divergence in extreme zones (💎) vs normal zones (↗️↘️)
极端区域检测:区分极端区域背离(💎)和普通背离(↗️↘️)
- **Bullish/Bearish Divergence**: Price lower low + RSI higher low / Price higher high + RSI lower high
看涨/看跌背离:价格新低+RSI未新低 / 价格新高+RSI未新高
### 📊 Layered Signal Statistics / 分层信号统计
- **4-Tier Classification**: MTF Resonance (🌟) > Divergence+Extreme (💎) > Extreme Only (🔥❄️) > Normal (⬆️⬇️)
四层分级:多周期共振 > 背离+极端 > 仅极端 > 普通信号
- **Independent Tracking**: Each signal tier has separate count, average return, and win rate
独立跟踪:每层信号独立统计次数、平均收益、胜率
- **Signal Cooldown**: Optional cooldown period (default 5 bars) to prevent duplicate counting
信号冷却:可选冷却期(默认5根K线)防止重复计数
- **Real Forward Testing**: Calculates actual returns N bars after signal (configurable 5-100 bars)
真实前瞻测试:计算信号后N根K线的实际收益(可配置5-100)
---
## Z-Score 与 百分位:双重视角 / Dual Perspective
This indicator displays **both Z-Score and Percentile** to provide complementary views of the same RSI distribution.
本指标**同时显示Z-Score和百分位**,为同一RSI分布提供互补视角。
### Why Both? / 为什么同时显示?
**Fundamental Connection / 本质关联**:
两者都是描述RSI在历史分布中位置的统计方法。
Both are statistical methods describing RSI's position in historical distribution.
- **Z-Score(标准分数)**: `(RSI - 均值) / 标准差` - 基于正态分布假设
Based on normal distribution assumption.
- **百分位(Percentile)**: RSI在历史数据中的排名位置 - 不假设分布类型
RSI's ranking position in historical data - no distribution assumption.
**Complementary Advantages / 互补优势**:
| Dimension 维度 | Z-Score | Percentile 百分位 |
|------|---------|------------|
| **Cross-asset Consistency / 跨资产一致性** | ✅ Excellent 优秀 - BTC和SPY都用±2σ | ⚠️ Varies by volatility 因波动率不同而异 |
| **Statistical Rigor / 统计学严谨性** | ✅ Confidence intervals 置信区间、假设检验 | ⚠️ Non-parametric 非参数统计 |
| **Intuitive / 直观易懂** | ⚠️ Stats knowledge needed 需要统计学知识 | ✅ "Below 95% of history" "低于95%历史值" |
| **Use Case / 适用场景** | 📊 Quant backtesting 量化回测、信号触发 | 📈 Visualization 可视化、用户理解 |
### Conversion Reference / 转换对照表
**Quick Reference / 快速对照**(Assuming normal distribution / 假设正态分布):
| Z-Score | Percentile 百分位 | Meaning 含义 | Signal 信号类型 |
|---------|--------|---------------|----------|
| **±2.5σ** | **P0.6 / P99.4** | Extreme anomaly (outside 99% CI) / 极端异常(99%置信区间外) | Rare opportunity 罕见机会 |
| **±2.0σ** | **P2.3 / P97.7** | Extreme OB/OS (outside 95% CI) / 极端超买/超卖(95%置信区间外) | 🔥❄️ Extreme 极端信号 |
| ±1.5σ | P6.7 / P93.3 | Notable deviation / 显著偏离 | ⬆️⬇️ Normal 普通信号(默认) |
| ±1.0σ | P15.9 / P84.1 | Mildly strong/weak / 轻度偏强/偏弱 | — |
| 0σ | P50 | Median / 中位数 | — |
### Dashboard Dual Display / 仪表盘双重显示
**新版Dashboard已实现自动转换**:
```
┌─────────────────────────────────┐
│ ADAPTIVE RSI PRO 28.5 │
├─────────────────────────────────┤
│ Z-Score −2.15σ (≈P2) │ ← Z值 + 近似百分位
│ Percentile P5 (−1.5σ ~ −2σ) │ ← 百分位 + 对应Z值范围
│ Status 🟢 EXTREME OVERSOLD │
└─────────────────────────────────┘
```
**理解方式**:
- **从Z值看**:−2.15σ 表示超过95%置信区间,统计异常 → 对应约P2
- **从百分位看**:P5 表示低于95%历史值,极端超卖 → 对应约−1.5σ到−2σ之间
### Threshold Line Modes / 阈值线模式
**Unified Mode (Recommended) / Unified模式(推荐)** - Balances rigor and intuitiveness / 兼顾严谨性和直观性:
- Draws: Z-Score threshold lines (±2σ, ±1.5σ) / 绘制:Z-Score阈值线(±2σ、±1.5σ)
- Labels: Corresponding percentiles (≈P98, ≈P93, ≈P7, ≈P2) / 标注:对应百分位(≈P98、≈P93、≈P7、≈P2)
- Advantage: Instantly understand statistical meaning and historical position / 优势:一眼看懂统计意义和历史位置
**Other Modes / 其他模式**:
- `Z-Score`: Statistical threshold lines only / 仅显示统计学阈值线
- `Percentile`: Percentile lines only / 仅显示百分位线
- `Both`: Display both types (denser) / 同时显示两类线(较密集)
### Practical Examples / 实际应用示例
**Scenario 1: Identifying Extreme Opportunities / 场景1:识别极端机会**
```
Current RSI / 当前RSI: 25.3
Dashboard shows / Dashboard显示:
Z-Score: −2.35σ (≈P1)
Percentile: P5 (< −2σ)
Status: 🟢 EXTREME OVERSOLD
Interpretation / 解读:
• Statistical perspective / 统计学视角: Beyond 99% confidence interval (|Z| > 2.3) / 超过99%置信区间,极端异常
• Intuitive perspective / 直观视角: Lower than 99% of historical values / 低于99%的历史值都低,罕见超卖
• Conclusion / 结论: Strong buy signal 🔥 / 强力买入信号 🔥
```
**Scenario 2: Normal Signal Judgment / 场景2:普通信号判断**
```
Current RSI / 当前RSI: 63.8
Dashboard shows / Dashboard显示:
Z-Score: +1.52σ (≈P94)
Percentile: P90 (+1.5σ ~ +2σ)
Status: 🟠 OVERBOUGHT
Interpretation / 解读:
• Statistical perspective / 统计学视角: ~1.5 std dev, notably high but not extreme / 约1.5倍标准差,显著偏高但未极端
• Intuitive perspective / 直观视角: Higher than 90% of historical values / 高于90%的历史值,轻度超买
• Conclusion / 结论: Consider reducing position, not forced sell ⬇️ / 考虑减仓,非强制卖出 ⬇️
```
### Dashboard Display Logic / Dashboard显示逻辑
**Z-Score Row Display / Z-Score行显示**:
- Always shows current Z-value (2 decimal places) / 始终显示当前Z值(精确到2位小数)
- Auto-calculates approximate percentile: `≈P ` / 自动计算对应的近似百分位:`≈P `
- Uses Error Function for precise conversion / 使用误差函数(Error Function)精确转换
**Percentile Row Display / Percentile行显示**:
- Shows RSI's percentile range (P5, P10, P25, etc.) / 显示RSI所处的百分位区间(P5, P10, P25等)
- Labels corresponding Z-value range (e.g., `−1.5σ ~ −2σ`) / 标注对应的Z值范围(如:`−1.5σ ~ −2σ`)
- Helps understand what "P10" means statistically / 帮助理解"P10"的统计意义
**Color Association / 颜色关联**:
- Both rows use same status color (green/yellow/white/orange/red) / 两行使用相同的状态颜色(绿/黄/白/橙/红)
- Visually reinforces "same indicator, different expressions" / 视觉上强化"同一指标的不同表达"概念
---
### Dashboard Setups / 仪表盘配置
#### Full Mode (PC/Tablet)
Shows detailed stats, MTF status, and divergence info.
显示详细统计、MTF状态和背离信息。
#### Mobile Mode (Phone) / 手机模式
Simplified 3-row layout optimized for small screens.
极简3行布局,专为手机屏幕优化。
- Row 1: RSI Value / 第1行:RSI数值
- Row 2: Signal Status (Emoji) / 第2行:信号状态 (Emoji)
- Row 3: Trend/Filter Status / 第3行:趋势/过滤状态
### 📈 Dashboard Example / 面板示例
```
┌─────────────────────────────────┐
│ ADAPTIVE RSI PRO 35.2 │
├─────────────────────────────────┤
│ Status 🟢 EXTREME OVERSOLD │
│ Percentile P10 ↓ DOWN │
│ Lookback 456 ✅✅✅ │
├─────────────────────────────────├ (Full Mode Only)
│ ── MTF ── │
│ 1h | 4h | D 🟢 | ⚪ | 🟢 │
│ Resonance 🟢 3/4 OVERSOLD │
├─────────────────────────────────┤
│ Divergence 🟢 BULL (5/60) │
├─────────────────────────────────┤
│ ── STATS ── (20 bars) │
│ 🌟 MTF Buy(12) +4.2% | 83% │
│ 🌟 MTF Sell(8) +3.8% | 75% │
│ 💎 Div Buy(15) +3.5% | 80% │
│ 💎 Div Sell(11) +2.9% | 73% │
│ 🔥 Ext Buy(45) +2.1% | 67% │
│ ❄️ Ext Sell(38) +1.8% | 63% │
└─────────────────────────────────┘
```
**Health Indicators / 健康度指标**:
- ✅✅✅ = All healthy (所有健康): Sample coverage ≥ 80%, Distribution spread ≥ 15, Statistical validity ≥ 90%
- ⚠️ present = Warning (警告): One or more health checks failed, consider using Custom mode with larger lookback
---
## Chart Lines Guide / 图表线条指南
! (images/annotated_rsi_indicator.png)
### 📊 主要线条 / Main Lines
| 线条 | 颜色/样式 | 含义 | 作用 |
|------|----------|------|------|
| **RSI主线** | 黄色粗线 | 当前RSI值 | 实时跟踪相对强弱指标 |
| **P50 自适应中位数** | 白色阶梯线 | 动态中线 | 根据历史数据自动调整的中位数,比固定50更准确 |
### 🔴 超买阈值线 / Overbought Thresholds (上方红色)
| 线条 | Z-Score | 百分位 | 样式 | 信号 |
|------|---------|--------|------|------|
| **极端超买线** | +2σ | ≈P98 | 实线 | 触发 ❄️ 极端超买信号(强卖出) |
| **普通超买线** | +1.5σ | ≈P93 | 圆点虚线 | 触发 ⬇️ 普通超买信号(考虑卖出) |
### 🟢 超卖阈值线 / Oversold Thresholds (下方绿色)
| 线条 | Z-Score | 百分位 | 样式 | 信号 |
|------|---------|--------|------|------|
| **极端超卖线** | -2σ | ≈P2 | 实线 | 触发 🔥 极端超卖信号(强买入) |
| **普通超卖线** | -1.5σ | ≈P7 | 圆点虚线 | 触发 ⬆️ 普通超卖信号(考虑买入) |
### ⚪ 固定参考线 / Fixed Reference Lines
| 线条 | 位置 | 样式 | 作用 |
|------|------|------|------|
| **0线** | 底部 | 灰色点线 | RSI下边界 |
| **50线** | 中间 | 灰色点线 | 传统固定中线参考 |
| **100线** | 顶部 | 灰色点线 | RSI上边界 |
### 🎨 渐变填充区域 / Gradient Fill Zones
- **红色渐变**(上方):超买区域,颜色越深表示越极端
- P95-P90(深红)> P90-P75(中红)> P75-P50(浅红)
- **绿色渐变**(下方):超卖区域,颜色越深表示越极端
- P10-P5(深绿)> P25-P10(中绿)> P50-P25(浅绿)
### 💡 关键要点 / Key Points
**线条样式区分 / Line Style Distinction:**
- **实线** = 极端信号(±2σ),优先级高,统计上95%置信区间外
- **圆点虚线** = 普通信号(±1.5σ),优先级较低,显著偏离但未极端
**动态 vs 固定 / Dynamic vs Fixed:**
- **彩色线**(红/绿)= 根据历史波动动态调整,适应不同资产特性
- **灰色虚线** = 固定不变的参考线,用于传统RSI对比
**视觉层次 / Visual Hierarchy:**
- 线条粗细:RSI主线(最粗)> 极端阈值(粗)> 普通阈值(细)> 参考线(最细)
- 透明度:核心线条(不透明)> 百分位线(半透明)> 填充区(高透明)
---
## Settings / 设置
### RSI Settings / RSI设置
| Setting | Default | Description |
|---------|---------|-------------|
| RSI Length | 14 | RSI calculation period / RSI计算周期 |
| RSI Source | Close | Price source / 价格源 |
### Adaptive Settings / 自适应设置
| Setting | Default | Description |
|---------|---------|-------------|
| Lookback Mode | Auto | Auto (statistical formula) / Custom / 自动/自定义 |
| Custom Lookback | 252 | Only used in Custom mode / 仅自定义模式使用 |
| Precision | Normal | High/Normal/Low: Adjusts error tolerance / 精度等级 |
| History Depth | 1 Year | 6 Months / 1 Year / 2 Years for volatility calculation / 波动率历史深度 |
### Visual Settings / 视觉设置
| Setting | Default | Description |
|---------|---------|-------------|
| Threshold Line Mode | **Unified** | Unified(推荐)/Z-Score/Percentile/Both / 阈值线模式 |
| Show Gradient Fill | ON | Display background gradients / 显示背景渐变 |
| Show Dashboard | ON | Display dashboard panel / 显示仪表盘面板 |
| Dashboard Mode | Full | Full/Lite/Mobile(Phone) / 面板模式 |
| Dashboard Size | Normal | Tiny/Small/Normal/Large / 面板大小 |
| Dashboard Transparency | 30 | 0-100% transparency level / 透明度 |
| Bullish Color | #00E676 | Custom color for bullish signals / 牛市信号颜色 |
| Bearish Color | #FF5252 | Custom color for bearish signals / 熊市信号颜色 |
| RSI Line Color | #FFEB3B | RSI line color / RSI主线颜色 |
### Trend Filter / 趋势过滤
| Setting | Default | Description |
|---------|---------|-------------|
| Enable Trend Filter | OFF | Only trigger signals in trend direction / 趋势方向过滤 |
| Filter Mode | Auto | Auto/Fixed 50/Adaptive P50/SMA(RSI)/BB(RSI) / 过滤模式 |
### Alert Settings / 警报设置
| Setting | Default | Description |
|---------|---------|-------------|
| **🎯 Smart Alert** | **ON** | **V6 Unified Alert System** / V6统一警报系统 |
| Show Normal Signals | OFF | Display ⬆️⬇️ on chart / 图表显示普通信号 |
| Normal Signal Threshold | 1.5σ | Z-Score threshold (1.0-2.0σ) / 普通信号阈值 |
| Enable Signal Cooldown | ON | Prevent duplicate signal counting / 防止重复信号 |
| Cooldown Period | 5 bars | Bars between same signal type / 冷却K线数 |
### Multi-Timeframe / 多时间框架
| Setting | Default | Description |
|---------|---------|-------------|
| Enable | ON | Show MTF analysis / 显示MTF分析 |
| MTF Mode | **Auto** | **Auto** (Fractal Breakdown) / **Manual** (Fixed) / 自动/手动模式 |
| TF1/TF2/TF3 | 60/240/D | Timeframes (Manual mode only) / 时间框架(仅手动模式)|
### Signal Statistics / 信号统计
| Setting | Default | Description |
|---------|---------|-------------|
| Enable | ON | Track performance / 跟踪表现 |
| Forward Bars | 20 | Bars for return calculation / 收益计算K线数 |
### Divergence Detection / 背离检测
| Setting | Default | Description |
|---------|---------|-------------|
| Enable Detection | ON | Detect divergences / 检测背离 |
| Divergence Mode | Auto | Auto/Low Vol/Normal/High Vol/Crypto/Custom / 背离模式 |
| Custom Lookback | 5 | Only in Custom mode / 仅自定义模式使用 |
| Custom Range | 60 | Only in Custom mode / 仅自定义模式使用 |
**Auto Mode Presets / 自动模式预设**:
- Low Vol (蓝筹/ETF): Lookback 3, Range 40
- Normal (一般股票): Lookback 5, Range 60
- High Vol (成长股): Lookback 7, Range 80
- Crypto (加密货币): Lookback 10, Range 120
---
## Alerts / 警报
### 🎯 Smart Alert (V6 Unified System)
**The only alert method / 唯一的警报方式** - 自动聚合所有信号到一条富文本消息
Automatically aggregates all signals into a single rich-text message.
**Setup Steps / 设置方法**:
1. Keep "🎯 Smart Alert" enabled in indicator settings (default) / 指标设置中保持 "🎯 Smart Alert" 开启(默认)
2. When creating alert, select **"Any alert() function call"** / 创建警报时选择 **"Any alert() function call"**
3. Done! You'll receive real-time aggregated alerts / 完成!您会收到实时的聚合警报
**Message Example / 消息示例**:
```
AAPL: 🟢 BUY SIGNALS → 🌟MTF共振 💎背离 🔥极端 | RSI:25.3 Z:-2.1σ (≈P2)
AAPL: 🔴 SELL SIGNALS → ❄️极端 | RSI:78.5 Z:2.3σ (≈P98)
```
**Features / 特性**:
- ✅ **Real-time trigger / 实时触发** - Sends when condition met within bar / K线运行中触发条件即发送
- ✅ **Anti-flicker / 防闪烁** - Uses `varip` to prevent duplicate alerts from signal flickering within same bar / 使用 `varip` 防止信号闪烁导致同一K线内重复警报
- ✅ **Signal upgrade detection / 信号升级检测** - Alerts when stronger signal appears (e.g., 🔥Extreme → 🌟MTF) even on same bar / 同一K线内出现更强信号时也会触发(如:🔥极端 → 🌟MTF共振)
- ✅ **Full context / 完整上下文** - Includes RSI value, Z-Score, approximate percentile / 包含RSI值、Z-Score、近似百分位
- ✅ **Auto-aggregation / 自动聚合** - One message contains all triggered signals / 一条消息包含所有触发的信号
- ✅ **Buy/Sell independent tracking / 买卖独立追踪** - Buy and Sell alerts tracked separately / 买入和卖出警报独立追踪,互不干扰
**Signal Priority Levels / 信号优先级**:
| Level 等级 | Signal 信号 | Description 描述 |
|------------|-------------|------------------|
| 4 (Highest) | 🌟 MTF Resonance | Multi-timeframe agreement / 多周期共振 |
| 3 | 💎 Divergence | Divergence + Extreme zone / 背离+极端区 |
| 2 | 🔥❄️ Extreme | Extreme oversold/overbought / 极端超卖/超买 |
| 1 (Lowest) | ⬆️⬇️ Normal | Normal oversold/overbought / 普通超卖/超买 |
---
## Usage Tips / 使用建议
| Timeframe | Lookback | Use Case |
|-----------|----------|----------|
| Daily | 252 | Swing trading / 波段交易 |
| 4H | 1000 | Short-term / 短线 |
| 1H | 2000 | Day trading / 日内交易 |
**Best Practices / 最佳实践:**
1. Focus on 🌟 and 💎 signals (highest priority) / 优先关注 🌟 和 💎 信号(最高优先级)
2. Use MTF resonance for high-confidence entries / 使用 MTF 共振确认高置信度入场
3. Check win rate in stats before trading / 交易前查看统计胜率
---
## Changelog / 更新日志
### v6.2 - Smart Alert Anti-Flicker / 智能防抖警报 (Current / 当前版本)
- 🛡️ **Anti-flicker Mechanism / 防闪烁机制**: Fixed issue where signal flickering caused multiple duplicate alerts within same bar. Now uses `varip` to track alert status per bar. / 修复信号闪烁导致同一K线内发送多次重复警报的问题,使用 `varip` 追踪每根K线的警报状态。
- 📈 **Signal Upgrade Detection / 信号升级检测**: Tracks signal priority level (MTF=4, Divergence=3, Extreme=2, Normal=1). Sends new alert when stronger signal appears on same bar. / 追踪信号优先级等级。同一K线内出现更强信号时会发送新警报。
- 🔄 **Independent Buy/Sell Tracking / 买卖独立追踪**: Buy and Sell alerts are tracked independently, allowing direction changes within same bar. / 买入和卖出警报独立追踪,允许同一K线内捕捉方向变化。
### v6.1 - Mobile Experience / 移动端体验
- 📱 **Mobile Dashboard / 手机端面板**: Added simplified "Mobile" mode optimized for phone screens (RSI + Signal Emoji only). / 新增简化的"Mobile"模式,针对手机屏幕优化(仅显示RSI+信号Emoji)。
- 🔥 **Persistent Zone Status / 持续区域状态**: Mobile Dashboard now shows persistent extreme zone indicators when no new signal but RSI remains in zone: `🔥持续` (Extreme Oversold), `❄️持续` (Extreme Overbought), `⬆️区` (Oversold), `⬇️区` (Overbought). / 手机端面板现在显示持续极端区域指示器:无新信号但RSI仍在区域内时显示持续状态。
- 🔧 **UX Improvements / 用户体验优化**: Optimized font sizes and layout for small screens. / 优化字体大小和小屏幕布局。
### v6.0 - Alert System Simplification & V6 Optimization / 警报系统简化与V6优化
- 🎯 **Smart Alert System / 智能警报系统简化**:
- **Unified entry / 唯一警报入口**: Removed all legacy alertcondition, unified to V6 Smart Alert / 移除所有legacy alertcondition,统一为V6 Smart Alert
- **Real-time trigger / 实时触发**: Changed to `alert.freq_once_per_bar` for intra-bar response / 改为 `alert.freq_once_per_bar` 实现K线内实时响应
- **Smart dedup / 智能去重**: Rising edge detection (`signal and not signal `) / 上升沿检测,只在新信号出现时触发
- **Auto-aggregation / 自动聚合**: Single message with all signals + RSI + Z-Score + Percentile / 单条消息包含所有触发信号 + RSI + Z-Score + 百分位
- **Simplified settings / 简化设置**: Removed "Extreme Alerts" and "Normal Alerts", only Smart Alert toggle / 移除 "Extreme Alerts" 和 "Normal Alerts",只保留Smart Alert开关
- 🛠 **Performance Optimization / 性能优化**:
- Reduced `request.security` calls by 50% using Tuple Requests / 使用元组请求减少50%的`request.security`调用
- Implemented `str.format()` for cleaner and faster string processing / 实现`str.format()`使字符串处理更简洁高效
- 🧹 **Code Cleanup / 代码清理**:
- Refactored timeframe display and alert logic / 重构时间框架显示和警报逻辑
- Fixed plot limit issues and tuple assignment syntax / 修复绑点限制问题和元组赋值语法
- Unified plot titles with percentile annotations / 统一绑点标题与百分位标注
### v5.0 - Adaptive Fractal MTF / 自适应分形MTF
- 🧠 **Adaptive Fractal MTF / 自适应分形MTF**: New "Auto" mode automatically selects lower timeframes for precision structure analysis (Internal Fractal Resonance). / 新增"Auto"模式,自动选择更低时间框架进行精确结构分析(内部分形共振)。
- Daily Chart → Analyzes 1H & 4H / 日线图 → 分析1小时和4小时
- 1H Chart → Analyzes 5m & 15m / 1小时图 → 分析5分钟和15分钟
- 15m Chart → Analyzes 1m & 5m / 15分钟图 → 分析1分钟和5分钟
- 🛠 **Code Refactoring / 代码重构**: Implemented Pine Script v6 UDTs (Objects) and Methods for robust signal statistics. / 实现Pine Script v6 UDT(对象)和方法,增强信号统计的健壮性。
- 🎨 **Dashboard Optimization / 面板优化**: Enhanced string formatting using `str.format` for cleaner display. / 使用`str.format`优化字符串格式,显示更简洁。
### v4.0 - Pine Script v6 Upgrade / Pine Script v6升级
- 🚀 Upgraded entire codebase to **Pine Script v6** engine / 将整个代码库升级到 **Pine Script v6** 引擎
- ⚡ Optimization for better performance and future-proofing / 性能优化,面向未来
- 🛠 Maintenance updates for latest TradingView standards / 维护更新以符合最新TradingView标准
### v3.0 - Auto-Adaptive Systems / 自动自适应系统
- ✨ Auto-adaptive lookback using formula `n = (Z × σ / E)²` / 使用统计公式 `n = (Z × σ / E)²` 自动计算回看期
- ✨ Auto-adaptive trend filter with 5 modes / 5种模式的自动自适应趋势过滤器
- ✨ Auto-adaptive divergence detection with 4 presets / 4种预设的自动自适应背离检测
- ✨ Layered statistics (MTF/Divergence/Extreme/Normal) / 分层统计系统(MTF/背离/极端/普通)
- ✨ Signal cooldown to prevent duplicate counting / 信号冷却机制防止重复计数
- ✨ Health indicators for lookback validation / 回看期健康度指标验证
- ✨ Dashboard modes (Lite/Full) with customization / 面板模式(Lite/Full)支持自定义大小和透明度
- ✨ Dual volatility system (short + long-term) / 双重波动率系统(短期+长期)
### v2.1 - Signal Optimization / 信号优化
- ✨ Consolidated signals with priority system / 信号合并与优先级系统(无重叠)
- ✨ Emoji-based signal display / 基于Emoji的信号显示
- ✨ MTF timeframe auto-skip for duplicates / MTF时间框架自动跳过重复
### v2.0 - Pro Edition / 专业版
- ✨ Added Trend Filter, MTF RSI, Statistics, Divergence / 新增趋势过滤、MTF RSI、统计、背离检测
- ✨ Z-Score based signal triggering / 基于Z-Score的信号触发
### v1.0 - Initial Release / 初始发布
- ✨ Adaptive percentile-based thresholds / 自适应百分位阈值
---
## License
MIT License - Feel free to use, modify, and share.