Daily ATR SL/TP Labels on ChartATR-Based Stop Loss & Take Profit Calculator
This script calculates 20% of the Average True Range (ATR) to determine optimal Stop Loss and Take Profit levels. Designed to assist traders in setting precise risk parameters when placing Buy/Sell orders based on daily market volatility.
Key Features:
Computes 20% of ATR value for proportional risk management
Provides dynamic SL/TP levels aligned to current market conditions
Optimised for Daily timeframe analysis to capture full trading day range
Recommended Usage:
Apply on Daily (1D) timeframe for most accurate results, as this captures the complete intraday price movement and provides reliable volatility measurements for position sizing and risk management decisions.
חפש סקריפטים עבור "ATR"

ATR Gauge - Audiophile StyleThe ATR Gauge - Audiophile Style indicator is a custom visualization tool. It's designed to give you a quick, retro-inspired snapshot of market volatility using the Average True Range (ATR) metric. Think of it as a dashboard widget styled like the VU meters on old-school audiophile equipment (e.g., vintage stereo amps from brands like McIntosh or Marantz)—simple, elegant, and functional. It sits in one of the corners of your chart and helps you gauge how "hot" or "cool" the current price action is compared to recent levels.
Why This Gauge?: Standard ATR plots as a line on your chart, but this turns it into a visual "meter" focused on the last 24 hours. It's like a speedometer for volatility—quick to read at a glance. Useful for day traders, scalpers, or anyone monitoring intraday risk without cluttering the main chart.

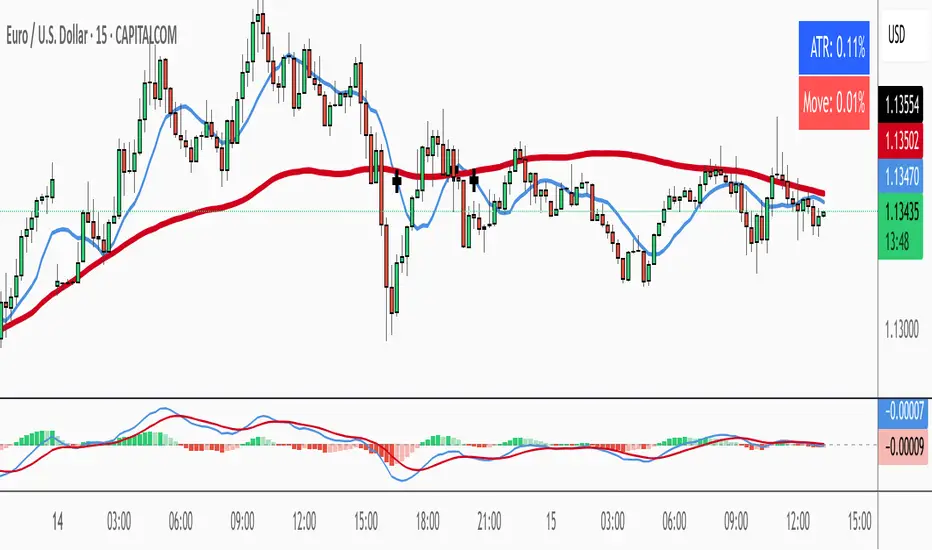
ATR % + Pump Detector📘 **ATR % + Pump Detector (Fixed 0.10%)**
This indicator combines two powerful volatility tools in one:
- **ATR % Display (Blue):**
Calculates the Average True Range as a percentage of price. Triggers an alert when ATR % exceeds **0.10%**, signaling rising volatility and potential breakout conditions.
- **Pump % Detector (Red):**
Measures the percentage change from **open to close** of the current candle. Triggers alerts when the move exceeds **+0.10%** (pump) or **–0.10%** (dump), helping you catch sudden price spikes in real time.
🔹 **Top-right display** shows both metrics in a clean table
🔹 Works on **any timeframe**
🔹 Ideal for **momentum trading, breakout entries**, or filtering low-vol setups
ATR & PTR TableThe ATR & PTR Table Indicator displays a dynamic table that provides Average True Range (measures market volatility over 1D, 1W, and 1M timeframes), Price trading range (difference between the high and low prices over the same periods) & percentage of the typical range that has been traded. This indicator will help traders identify potential breakout zones and assess volatility across multiple timeframes.
This had been optimized to show ATR and PTR on every time frame. The (1D) represents ATR on whatever timeframe you are currently on.

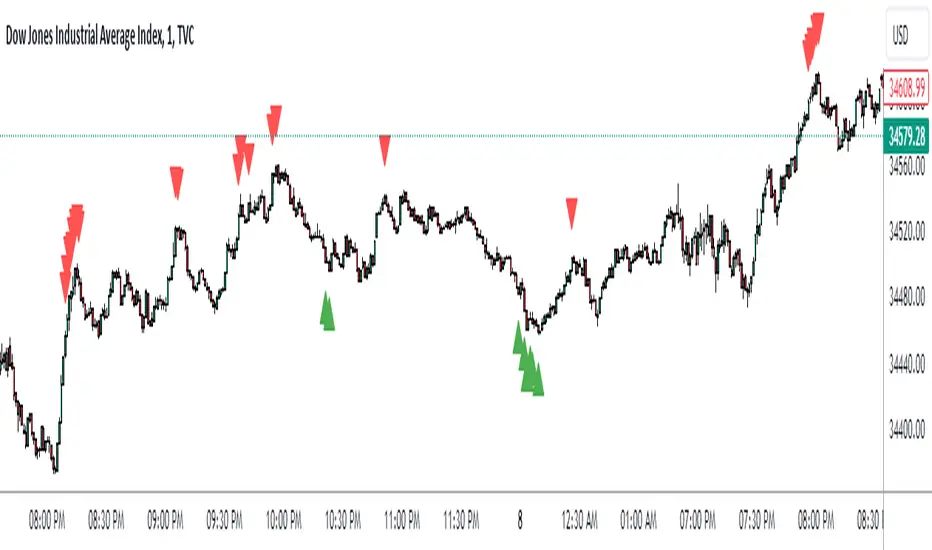
ATR Trend Reversal Zone indicatorThis indicator helps avoid taking reversal trades too close to the 21 EMA, which may fail since the market often continues its trend after retracing from the 21 EMA level. It does not generate a direct signal for reversal trades but rather indicates points where you can consider potential reversal trades based on your trading methodology
This script defines an indicator that calculates the 21 Exponential Moving Average (EMA) and the Average True Range (ATR) for a given period. It then computes the distance between the most recent closing price and the 21 EMA in terms of ATR units. If this distance is equal to or greater than 3 ATRs, a small green circle is plotted below the corresponding bar on the chart, indicating a potential reversal condition.
Remaining ATR [vnhilton]ATR levels can be used on a trading day to look for overextensions beyond the average, where you can look to take profits. Remaining ATR is calculated as the current day range subtracted by the previous day ATR. RATR is then plotted away from the high & low lines. All lines (except for the day open) are dynamic, so RATR lines will move according to how much RATR remains.
Note: This indicator only works on intraday timeframes
(FEATURES)
- Works on either RTH or ETH sessions
- Select Day ATR period, & 3 multipliers that will be applied to RATR values away from respective intraday high & low
- Extend current lines to the right
- Show recent lines only
- Change line style, colours within & out the intraday range, & thickness
- Change label offset, size, & colours within & out the intraday range
- Hide RATR lines & labels when within intraday range
- Plot fill between lines (note: RATR plot fills are from their lines to the intraday high & low, so there'll be overlapping)
To show more lines in the past, go to higher intraday timeframes.
Same chart & timeframe as above but on RTH session only.

ATR Trex [SHK] - Modified Some minor changes :
1. APR Removed Temporarily
2. Whole table moved to new pane ( not overlay )
3. % of changes added to numbers for better decision
4. Some plots added. ( thick green line : higher timeframe ATR, orange line: current timeframe atr, black line: one timeframe lower ATR, purple line: largest candle shadow ( up or down) )
Bugs:
There is no upper time frame for weekly timeframe
There is no lower time frame for 1m
....

ATR SLHi traders,
As you know, ATR trailing stop is very popular indicator. So I decided to make my own one.
The logic is simple.
If the price is above the RMA(src,len), then put a SL at OPEN - ATR value of that time period
otherwise, put a SL at OPEN + ATR value of that time period.
Stay safe ^^

ATR Based Trendlines - JDThis script draws trendlines from the pivot points in the price chart.
The angle of the trendlines is determined by (a percentage of) the atr.
The angle follows the change in price, dictated by the atr at the moment where the pivot point is detected.
The atr percentage determines if the trendline follows the rate of change of the atr or a fraction ( value < 100) or a multiple ( value > 100) of that
JD.
#NotTradingAdvice #DYOR
Disclaimer.
I AM NOT A FINANCIAL ADVISOR.
THESE IDEAS ARE NOT ADVICE AND ARE FOR EDUCATION PURPOSES ONLY.
ALWAYS DO YOUR OWN RESEARCH!

ATR Stoploss Lines - Minimize Risk | Maximize ProfitThe ATR Stoploss is best used as a trailing stop. While actively managing your trades, move your stops up as price increases/decreases.
There is an offset of 1 candle, so the ATR will only be based on closed candles. This prevents you from moving your stop's when you really shouldn't.
The top lines are used for short positions and the bottom lines are used for long positions.
You can adjust the distance of the ATR lines from your candles by changing the multiplier in the settings.
You may want to increase the multiplier to 2-3 on less volatile assets, and keep it ~1.75 for volatile assets like BTC.
Feel free to reach out if you need any tips or more help with using these. Just remember, this indicator should only be used to manage your trades, not enter them.

Scott’s volatility histogramATR shows volatility. SMA of ATR measures the average volatility over a chosen look-back period (default 200).
Divergence of ATR and sma is represented as a histogram.
Low periods of volatility are below the zero line. High periods of volatility are above the zero line.
Average volatility over a 200 period look-back is the zero value.

ATR + BB Swing StrategyMechanical daily stock swing strategy using ATR stops, Heikin Ashi trend confirmation, and Bollinger Bands context. Entries occur above 50 SMA on bullish Heikin Ashi candles; initial stop is 3xATR with trailing stop of highest close minus 2xAtr, reducing to 1.5xATR when profit protection triggers (+2R and momentum weakening). Exits are fully ATR-based, giving a simple, rules-driven approach to ride trends while protecting gains

ATR Channels 1-2-3 + Elder Value Zone V2This indicator combines volatility-based ATR channels with the Elder value zone to provide a structural view of trend and pullbacks.
It plots a central moving average and three pairs of ATR channels at 1, 2, and 3 times the Average True Range, giving a clear visualization of price extension relative to current volatility. The channels are linear and non-adaptive, serving strictly as a volatility envelope, not as support or resistance levels.
In addition, the indicator plots the Elder fast and slow exponential moving averages (EMA 13 and EMA 26) and highlights the area between them as the Elder value zone. This zone represents the price area where pullbacks occur within an established trend, and where continuation setups are typically evaluated.
The indicator does not generate signals or trading rules. It is designed for contextual analysis, helping to assess trend structure, volatility expansion or contraction, and whether price is extended or trading within a normal corrective range.

ATR Trailing StopShows a trailing stop loss based on ATR (Average True Range).
The user can select ATR period and multiple, to adjust to the volatility of the current chart.
Only for long positions.

ATR (No Gap) - Advanced Volatility IndicatorA customizable Average True Range indicator that eliminates gap distortion between trading sessions, providing cleaner volatility measurements for intraday and swing traders.
Key Features:
Gap Filtering: Optional toggle to ignore overnight/weekend gaps that distort volatility readings
EMA Smoothing: Defaults to EMA for more responsive volatility tracking (also supports RMA and SMA)
Half ATR Display: Shows 50% ATR value for quick stop-loss and take-profit calculations
Clean Value Table: Real-time values displayed on chart with configurable decimal precision
Flexible Settings: Customize length, smoothing method, and display options
Ideal for:
Setting dynamic stop losses and take profits
Position sizing based on current volatility
Comparing gap vs. no-gap volatility measurements
Trading instruments with large overnight gaps (indices, forex, crypto)
Use this indicator to get a more accurate picture of intraday volatility without the noise from session gaps!

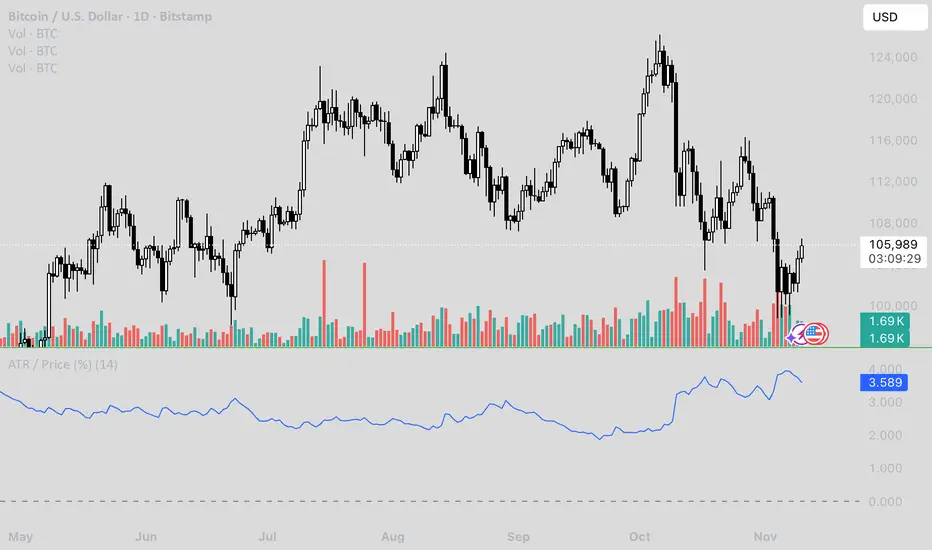
ATR / Price RatioDescription:
This indicator plots the ratio of the Average True Range (ATR) to the current price, showing volatility as a percentage of price rather than in absolute terms. It helps compare volatility across assets and timeframes by normalizing for price level.
A higher ATR/Price ratio means the market is moving a larger percentage of its value each bar (high relative volatility). A lower ratio indicates tighter, quieter price action (low relative volatility).
Traders can use this ratio to:
• Compare volatility between instruments
• Identify shifts into high or low volatility regimes
• Adjust position sizing and stop distances relative to risk
Average True Range Stop Loss Finder with KAMAATR SL finder with bands
Kaufmann adaptive moving average
ATR SL finder with bands
Kaufmann adaptive moving average

ATR by Session Library [1CG]Library "ATRxSession"
This library shows you how big the bars usually are during a trading session. It looks only at the times you choose (like New York or London hours), measures the “true range” of every bar in that session, then finds the average for that session. It keeps the last N sessions and gives you their overall average, so you can quickly see how much the market typically moves per bar during your chosen session.
Call getSessionAtr(timezone, session, sessionCount) from your script, and it will return a single number: the average per-bar volatility during the chosen session, based on the last N completed sessions. This makes it easy to plug session-specific volatility into your own indicators or strategies.
getSessionAtr(_timezone, _session, _sessionCount)
getSessionAtr - Computes a session-aware ATR over completed sessions.
Parameters:
_timezone (string) : (string) - Timezone string to evaluate session timing.
_session (string) : (string) - Session time range string (e.g., "0930-1600").
_sessionCount (int) : (int) - Number of past completed sessions to include in the rolling average.
Returns: (float) - The average ATR across the last N completed sessions, or na if not enough data.

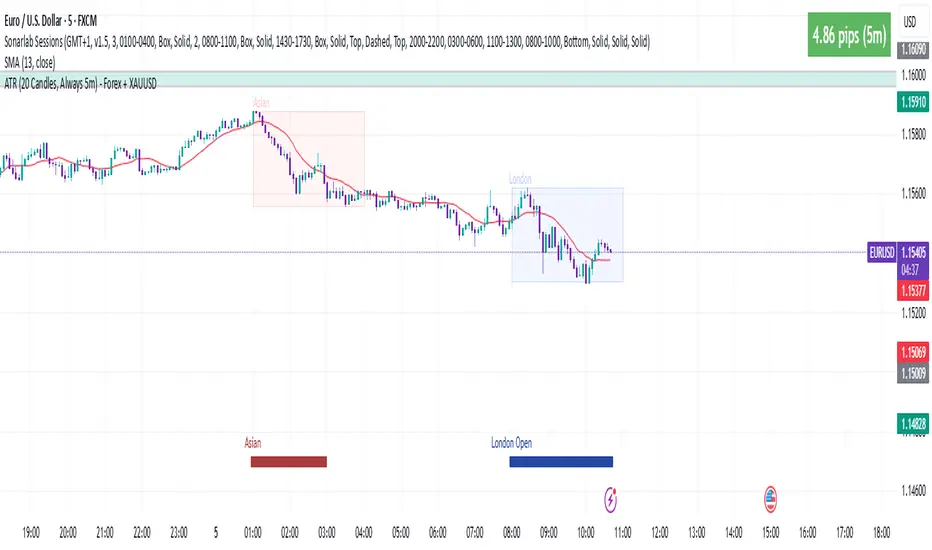
ATR 5 min- FOREX + XAUThis indicator displays the Average True Range (ATR) over the last 20 candles, calculated using the 5-minute timeframe, regardless of the chart timeframe you're currently viewing.
It supports:
All major forex pairs
XAUUSD (Gold), with ATR displayed in full dollars
Key Features
Always reflects 5-minute volatility
Accurate pip scaling:
JPY pairs = 1 pip = 0.01
Other forex pairs = 1 pip = 0.0001
XAUUSD = 1 pip = 1.00 (i.e., full dollar)
Clean and minimal top-right table display
Automatically adapts based on the instrument you're viewing
Helps traders gauge recent market volatility across timeframes
This is an ideal tool for scalpers, intraday traders, or swing traders who want to monitor short-term volatility conditions from any timeframe view.
ATR Stop Loss Non-Decreasing & LineThe script calculates a custom stop-loss level based on the Average True Range (ATR) indicator, ensuring that this stop-loss level never decreases from one bar to the next unless a reset condition is met. It also visually displays the ATR value and the calculated stop-loss level as a line on the chart.

ATR Percentage TableSimple ATR shows the average price change per candle. In order to enter a trade, I need to know how much percent I will win.
I should enter the game for the cross with the highest percentage change. I created a table by entering a cross name in each line in the list and made it possible to follow the changes in the active window.
I sorted the ATR change percentages from largest to smallest. Being able to see the highest percentage change is an answer to the question of which crosses I should choose to open a trade.

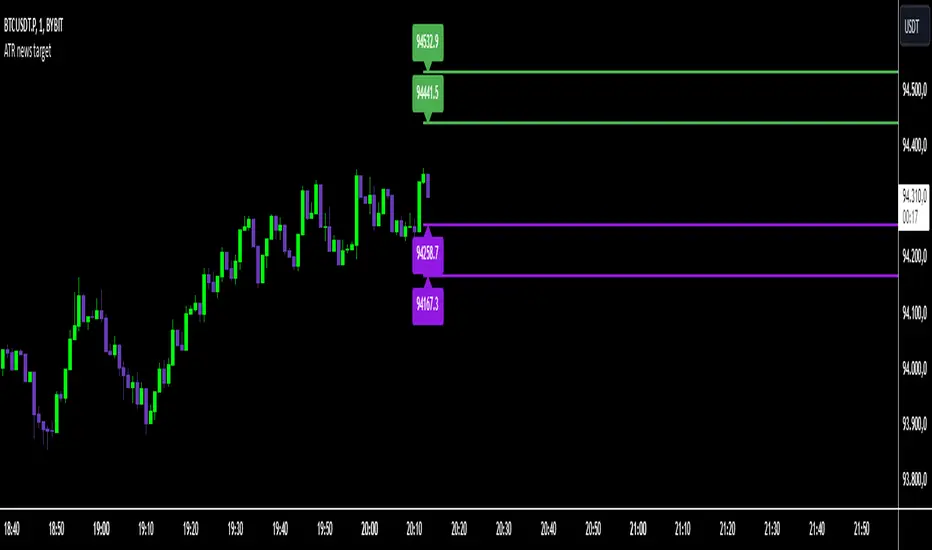
ATR news targetThis indicator is based on the calculation of the ATR and the use of multipliers to define specific price levels. It is crucial that it is fixed to the price axis.
During periods of high volatility, such as during the release of macroeconomic data, it is essential to understand the magnitude of price movements.
By multiplying the ATR (customizable period) by specific multipliers (customizable variables), exit targets (stop loss and take profit) are determined based on the current volatility, ensuring greater adaptability to the market.
The directionality will be determined by the news, but thanks to the indicator (calculated on the last closed candle), you will have the ability to precisely determine stop loss, take profit, and retracement points.
ATR ReadoutDisplays a readout on the bottom right corner of the screen displaying ATR average (not of the individual candlestick, but of the current rolling period, including the candlestick in question).
Due to restrictions with Pine Script (or my knowledge thereof) only the current and previous candlestick data is shown, rather than the one currently hovered over.
The data is derived via the standard calculation for ATR.
Using this, one can quickly and easily get the proper data needed to calculate one's stop loss, rather than having to analyze the line graph of the basic ATR indicator.
Settings are implemented to change certain variables to your liking.
