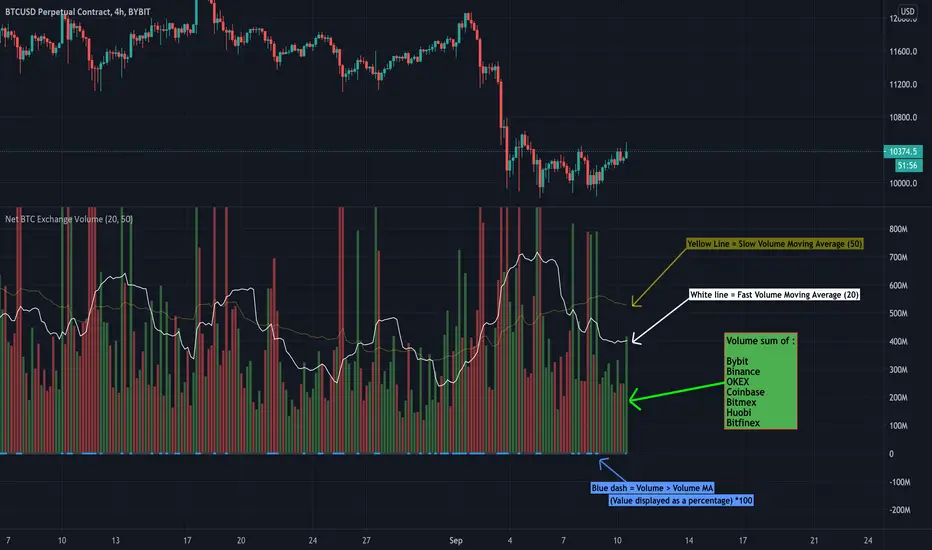
Net BTC Exchange VolumeBTC Net exchange volume of top BTC exchanges with moving averages
- Jake Scanlan
חפש סקריפטים עבור "BTC"
BTC Fibonacci DMA350 TrendlinesAdapted from Tim Graham's Code.
See Original Inspiring Article from Phillip Swift at: @positivecrypto
When looking into BITSTAMP:BTCUSD 1D data in spreadsheet. Historically, BTC Highs Hit (Simple Daily Moving Average 350 Days) DMA350 in reverse Fibonacci Sequence Order
2013 Hit DMA350*8 before All Time High (ATH)
2017 Hit DMA350*5 before ATH
I expect 2021 to hit DMA350*3 ATH. When BTC hits DMA350*3 ATH, I suggest selling!

crypto chart BTC is often moved by other brands
This indicator to detect the precedence and enter BTC
BTC 1H Optimal Moving Average Ribbon
This plots a moving average ribbon (It is tight so it looks more like a line than ribbon), please use the exponential not the standard.
It is based on a constant calculation of the most profitable EMAs to trade on the 1H time frame for BTC!
Thus the values will be updated with time as they change.
As an example trading the EMA 176 will return ~8500% (20.8.2019)on initial investment starting April 2015, compared to holding giving ~4800%.
It is a simple price breaks above EMAs to go long and break below to go short strategy but I recommend waiting for the full twist.
Lime : Uptrend. Long trading
Green : Reentry (buy the dip) or downtrend reversal warning
Red : Downtrend. Short trading
Maroon : Short Reentry (sell the peak) or uptrend reversal warning
Stolen from Madrid Moving Average Ribbon : 2.0 : MMAR
madridjourneyonws.blogspot.com
Adapted for 1H optimal EMAs for BTC

BTC Cycle High IndicatorWith high probability show BTC price cycle highs. When price touches the white line, and when yellow and red moving averages cross, we will most likely have our next BTC cycle price high.
Based on Philip Swift's analysis (@positivecrypto)

What is ProfitableBTC, BNB or your favorite Alt Coin? This indicator shows what is profitable at the moment. Red bars are alt days, green bars are BTC days. Otherwise, it is a BNB day.
Hmm, most of the time it is a BNB day!

BTC<>USDT calculator [mado]it's Calculator for Altcoin Arbitrage
need to input current price(XXX/btc and XXX/usdt) on config
default calculate BINANCE:BTCUSDT (based price)
red price USDT(cent)
green price BTC(sat)

BTC-WEEKEND GRAVITY Indicator @COINOBS - Hello Fam,
Coin Observatory, back with another indicator.
We call this one the:
Weekend GRAVITY indicator!
That's right,
How to use this indicator:
-ONLY APPLICABLE FOR WEEKEND PRICE ACTION:
-If BTC is trading above our GRAVITY indicator, low leverage shorts, until price returns to gravity line.
-If BTC is trading below our GRAVITY indicator, low leverage longs, until price returns to gravity line.
ONLY USE THIS FOR WEEKEND PRICE ACTION.
Please backtest for us, this indicator has had a 99% accuracy rate for weekend price action.
Want this indicator?
-Just request access! We'll hook you up ;)
-Jump in our discord, link in my bio
At the time of publishing, XBT is trading at 6885
Gravity Indicator tells us, target is 6290

XRPBTCBITFINEXLONGCHANGEBTC建てのロングポジションの変化を示します。
ゼロラインよりも上側のヒストグラムは、ロングポジションの増加を意味します。
ゼロラインよりも下側のヒストグラムは、ロングポジションの減少を意味します。
市場心理を推測し、今後の値動きを予想することに役立ちます。
機械翻訳 Machine translation
The change in long position of BTC is shown.
The histogram above the zero line means an increase in long position.
The histogram below the zero line means a decrease in long position.
It is useful for estimating market psychology and forecasting future price movements.

BTC Futures Settlement Dates - Life Zoltar InvestingThis is a TradingView script to map out the BTC Futures Settlement Dates. There was one floating around the internet but it was old and wasn’t updated. I took that, changed up the code and created this. Orange is CBOE and Blue is CME. You’ll notice shortly after the highlighted closed date, BTC starts to trend upwards.
Data from the below:
CBOE: cfe.cboe.com
CME: www.cmegroup.com

BTC STH Proxy vs Realized Price (RP) Ratio | STH : LTH📊 REALIZED PRICE MARKET SIGNAL
Indicator that builds a Short-Term Holder (STH) price proxy using a configurable moving average of Bitcoin’s market price and compares it to Bitcoin’s Realized Price (RP) derived from on-chain data.
Realized Price (RP) is calculated from CoinMetrics Realized Market Cap divided by Glassnode circulating supply.
STH Proxy is a user-defined moving average (EMA/SMA/WMA) of BTC price, designed to mimic the behavior of the true STH Realized Price.
Users can adjust the MA type, length, and RP smoothing to closely replicate the STH curve seen on Glassnode, Bitbo, and Bitcoin Magazine Pro.
Optionally, the indicator can display the STH/RP ratio, which highlights transitions between market phases.
This tool provides a simple but effective way to visualize short-term vs long-term holder cost-basis dynamics using only publicly accessible on-chain aggregates and price data.
----------
💡TLDR: An alt take on the Short-Term Holder Realized Price / Long-Term Holder Realized Price cross model | (STH/LTH cross)
- A mix of MAs are used to mimic STH.
- RP here used as a proxy for the long-term holder (LTH) cost basis.
- Bull/Bear signals are generated when the STH proxy crosses above or below RP.
⭐ Free to use • Leave feedback • Happy trading!

BTC – LEVR: Leverage Efficiency & Volume RatioLEVR: Leverage Efficiency & Volume Ratio
Observation-only. Data: IntoTheBlock.
Overview
The Leverage Efficiency & Volume Ratio (LEVR) is a market structure oscillator designed to detect "Paper Bubbles" and "Organic Bottoms" by separating speculative greed from network utility. While most indicators analyze price action, LEVR analyzes market fragility. It operates on the thesis that Sustainable Rallies are driven by Spot/Network Activity, while Fragile Rallies are driven by Derivatives Leverage.
Synergy
How it works with VERI
LEVR is designed to be the tactical counterpart to the fundamental VERI Indicator (Valuation & Entity Ratio Index).
Use VERI for Strategy: To identify Value. (Is Bitcoin cheap? Are Whales buying?)
Use LEVR for Risk: To identify Structure. (Is the current price move real, or is it a leverage bubble about to pop?)
The "Perfect Setup"
The strongest buy signals occur when VERI is in the Accumulation Zone (Whales buying) AND LEVR is in the Organic Zone (Leverage is flushed out) (as it was the case in the Dec 2022 Bear Market Bottom).
Why LEVR is Unique
Standard indicators often fail to contextualize Open Interest:
vs. Raw Open Interest: Raw OI always trends up over time as the market grows. LEVR solves this by normalizing OI against Active Addresses. This reveals when leverage is outpacing actual adoption.
vs. ELR (Estimated Leverage Ratio): Classic ELR divides Open Interest by Exchange Reserves. However, Exchange Reserves are notoriously difficult to track accurately. LEVR uses Active Addresses (Network Utility) as a cleaner, more reliable denominator for network health.
Methodology
The Mathematics: The indicator calculates a normalized Z-Score ratio between two IntoTheBlock datasets:
The Numerator (Greed): Perpetual Open Interest. The total dollar value of all open futures contracts. This represents the "Gambling" capital.
The Denominator (Utility): Active Addresses. The number of unique addresses transacting on-chain. This represents the "Real" user base.
The Formula : LEVR = Z-Score ( Perpetual Open Interest / Active Addresses )
How to Interpret the Visuals
The line color changes dynamically to reflect the current risk regime:
🟥 Speculative Premium (Red Line > 2.0) :
Signal: "Leverage Bubble."
Context: Open Interest is rising significantly faster than User Growth. The rally is fueled by debt.
Risk: High probability of a "Long Squeeze" or liquidation cascade.
🟦 Organic Base (Blue Line < -1.5) :
Signal: "Spot Driven Market."
Context: Speculators have been flushed out, but active network usage remains high. The line turns Blue to signal a healthy opportunity zone.
Risk: Low. Historically marks robust bottoms where hands are strong.
🟧 Neutral (Orange Line) :
The market is in a transition phase between organic growth and speculation.
Settings & Inputs
Users can customize the sensitivity of the Z-Score to fit their trading style (in brackets their current standard value):
Lookback Period (365) : The rolling window used to establish the "Baseline." A 365-day window captures the yearly trend.
Signal Smoothing (7) : A short moving average to reduce daily data noise.
Bubble Zone Top/Bottom (3.0 / 2.0) : The thresholds for the Red Zone. Raising the "Top" value will only show the most extreme, generational leverage bubbles.
Organic Zone Top/Bottom (-1.5 / -2.5) : The thresholds for the Green Zone. Lowering these values requires a deeper "flush" to trigger a signal.
Optimization
This indicator is mathematically optimized for the Daily (1D) timeframe. Using it on lower timeframes may result in noise due to the daily resolution of on-chain data.
Important Note on Historical Data
Please be aware that aggregated global Perpetual Open Interest data only becomes reliable and widely available starting around 2020-2021.
Pre-2021: The indicator will show a flat line or empty values. This is not a bug; it reflects the lack of historical derivatives market data for that period.
2021-Present: The indicator functions fully as intended.
Credits
Concept inspired by the "Estimated Leverage Ratio" (ELR) popularised by CryptoQuant and analysts like Willy Woo. LEVR adapts this concept for TradingView by substituting Exchange Reserves with Network Activity for better reliability.
Disclaimer
This tool is for research purposes only. It visualizes market structure data and does not constitute financial advice.
Tags
bitcoin, btc, open interest, leverage, on-chain, intotheblock, risk, derivatives, levr, veri

BTC - VERI - Valuation & Entity Ratio IndexVERI: Valuation & Entity Ratio IndexObservation-only.
Data: IntoTheBlock.
Overview & Philosophy
The name VERI is derived from the Latin Veritas (Truth). In a crypto market often driven by deceptive speculative noise, this indicator seeks to establish the "On-Chain Truth" of a price trend.
It operates on the thesis that price action is only sustainable when verified by high-conviction capital flows.VERI is a fundamental composite oscillator that fuses Entity Behavior (Who is holding?) with Network Valuation (Is the price fair?) to identify Bitcoin market cycle extremes.
The "Alpha"
Why this Composite stands out: on-chain metrics often tell only half the story.
MVRV tells you if the price is cheap, but not if anyone is actually buying.
Whale Activity tells you if large players are moving, but not if they are accumulating at a value discount.
VERI fuses these two dimensions into a single Z-Score. It identifies the rare, high-probability moments where Smart Money Conviction intersects with Deep Value.
Methodology
The Mathematics of VERI: The indicator constructs a composite index using three fundamental metrics from IntoTheBlock:
The "Who" (Entity Ratio) : We calculate the flow ratio between Whales (>1% supply holders) and Retail (<0.1% supply holders). A rising ratio indicates supply is transferring from weak hands to strong hands.
The "Why" (Valuation Multiplier) : We utilize the MVRV (Market Value to Realized Value) ratio. To isolate value opportunities, we use the inverse (1 / MVRV).
The Fusion : These factors are multiplied to create the raw VERI index.
Normalization & Inversion
We apply a rolling Z-Score (standard deviation from the mean) and invert the result.
How to Interpret the Indicator
Because the output is inverted, the visual logic matches price action intuitively:
🟥 Distribution Zone (High Values > 1.5):
The Signal: "Low Conviction Overvaluation."
Context: The price is historically expensive relative to the cost basis (High MVRV), and Whales are distributing coins to Retail.Implication: Historically precedes macro tops or deep corrections.
🟩 Accumulation Zone (Low Values < -1.5):
The Signal: "High Conviction Undervaluation."Context: The price is historically cheap (Low MVRV), and Whales are aggressively accumulating relative to Retail.
Implication: Historically precedes macro bottoms and generational entry points.
Zero Line : Represents the historical baseline. A crossover of the zero line often confirms a regime shift (e.g., from Bear to Bull).
Visual Guide & Features
Dynamic Coloring: The line turns Red in the Distribution Zone, Blue in the Accumulation Zone, and Orange during neutral trends.
Zone Labels: Static labels are pinned to the left side of the chart for immediate context.
The "Data Check" Monitor (Status Table): Since this indicator relies on third-party fundamental data, we have included a diagnostic table in the bottom-right corner.
Data Check Monitor Guide
STATUS: LIVE (Green): The indicator is functioning correctly. All data feeds (Whales, Retail, MVRV) are being retrieved successfully.
STATUS: WAIT (Red): The indicator cannot retrieve data. This might happen for some reasons, e.g. your TradingView plan may not support IntoTheBlock integration.
Settings
Lookback Period (Default: 365): The window used for Z-Score normalization. We use a full year to smooth out seasonal volatility.
Smoothing (Default: 7): A 7-day smoothing is applied to the signal to filter out daily noise.
Zone Thresholds: Users can customize the specific Z-Score levels for the Distribution and Accumulation bands.
Disclaimer
This script is for research and educational purposes only. It uses historical on-chain data to visualize market structure and does not constitute financial advice. Past performance of whale entities does not guarantee future results.
Tags
bitcoin, btc, on-chain, mvrv, whales, valuation, fundamentals, cycle, oscillator, veri

BTC Dashboard D / 4H / 1H (simple)//@version=5
indicator("BTC Dashboard D / 4H / 1H (simple)", overlay = true)
// ---------- Réglages ----------
rsiLen = 14
emaLen50 = 50
emaLen200 = 200
// Petite fonction pour formater les nombres
f_fmt(float v) =>
str.tostring(v, format.mintick)
// ---------- TIMEFRAMES ----------
tfD = "D"
tf4H = "240"
tf1H = "60"
// ---------- DAILY ----------
closeD = request.security(syminfo.tickerid, tfD, close)
ema50D = request.security(syminfo.tickerid, tfD, ta.ema(close, emaLen50))
ema200D = request.security(syminfo.tickerid, tfD, ta.ema(close, emaLen200))
rsiD = request.security(syminfo.tickerid, tfD, ta.rsi(close, rsiLen))
// ---------- 4H ----------
close4H = request.security(syminfo.tickerid, tf4H, close)
ema504H = request.security(syminfo.tickerid, tf4H, ta.ema(close, emaLen50))
ema2004H = request.security(syminfo.tickerid, tf4H, ta.ema(close, emaLen200))
rsi4H = request.security(syminfo.tickerid, tf4H, ta.rsi(close, rsiLen))
// ---------- 1H ----------
close1H = request.security(syminfo.tickerid, tf1H, close)
ema501H = request.security(syminfo.tickerid, tf1H, ta.ema(close, emaLen50))
ema2001H = request.security(syminfo.tickerid, tf1H, ta.ema(close, emaLen200))
rsi1H = request.security(syminfo.tickerid, tf1H, ta.rsi(close, rsiLen))
// ---------- TABLE ----------
var table t = table.new(position.top_right, 4, 4, border_width = 1)
if barstate.islast
// Ligne d’en-tête
table.cell(t, 0, 0, "TF", text_color = color.white, bgcolor = color.new(color.black, 0))
table.cell(t, 0, 1, "Close", text_color = color.white, bgcolor = color.new(color.black, 0))
table.cell(t, 0, 2, "EMA50 / EMA200", text_color = color.white, bgcolor = color.new(color.black, 0))
table.cell(t, 0, 3, "RSI", text_color = color.white, bgcolor = color.new(color.black, 0))
// ----- DAILY -----
rowD = 1
table.cell(t, rowD, 0, "D", text_color = color.yellow, bgcolor = color.new(color.blue, 70))
table.cell(t, rowD, 1, f_fmt(closeD))
table.cell(t, rowD, 2, "50: " + f_fmt(ema50D) + "\n200: " + f_fmt(ema200D))
table.cell(t, rowD, 3, f_fmt(rsiD))
// ----- 4H -----
row4 = 2
table.cell(t, row4, 0, "4H", text_color = color.white, bgcolor = color.new(color.teal, 70))
table.cell(t, row4, 1, f_fmt(close4H))
table.cell(t, row4, 2, "50: " + f_fmt(ema504H) + "\n200: " + f_fmt(ema2004H))
table.cell(t, row4, 3, f_fmt(rsi4H))
// ----- 1H -----
row1 = 3
table.cell(t, row1, 0, "1H", text_color = color.white, bgcolor = color.new(color.green, 70))
table.cell(t, row1, 1, f_fmt(close1H))
table.cell(t, row1, 2, "50: " + f_fmt(ema501H) + "\n200: " + f_fmt(ema2001H))
table.cell(t, row1, 3, f_fmt(rsi1H))

BTC Global M2 Indicator by FenixThe index is based on the price of btc and the m2 supply in the market.

BTC Future CME Cross-Market DetectorProject Spec: BTC CME Cross-Market Detector
1. Project Overview
Indicator Name
CME Cross-Market Detector
Objective
To identify high-probability trade setups by detecting and confirming "smart money" activity across two distinct market venues simultaneously: a primary crypto exchange (e.g., Bybit, Binance) and the institutional CME futures market.
Core Philosophy
Price movements are often preceded by the positioning of large, institutional players ("smart money"). While their activity can be seen on any single exchange, the signal becomes exceptionally reliable when the same footprint appears at the same time in both the broader crypto derivatives market and the highly regulated institutional futures market. This dual-market confirmation acts as a powerful noise filter, isolating signals that have a higher probability of follow-through.
2. Key Concepts & Signal Logic
The indicator's entire foundation rests on confirming that specific conditions are met on two datasets at the same time: (1) The user's current chart (e.g., BYBIT:BTCUSDT) and (2) The CME Bitcoin Futures chart (CME:BTC1!).
Smart Volume Analysis
To gauge buying vs. selling pressure, the total volume of a single candle is algorithmically split. This is not a perfect science but an effective estimation based on the candle's structure.
Buying Pressure is considered proportional to the distance the price closed from the low. Buying Pressure ≈ Total Volume × ((Close - Low) / (High - Low))
Selling Pressure is considered proportional to the distance the price closed from the high. Selling Pressure ≈ Total Volume × ((High - Close) / (High - Low))
Signal Trigger Conditions
For a potential signal to be identified on each market independently, two conditions must be met:
Volume Spike: The volume of the current candle must be significantly higher than the recent average volume (e.g., >150% of the 20-period moving average). This shows a sudden, high level of interest.
Pressure Imbalance: The estimated buying pressure must overwhelm the selling pressure by a certain factor (e.g., 3x), or vice versa for a sell signal. This indicates a clear directional intent.
The Final Confirmed Signal
A signal is only considered valid and plotted on the chart when the Signal Trigger Conditions (both Volume Spike and Pressure Imbalance) are met on both the primary chart and the CME chart on the very same candle.
3. Signal Strength Calculation
The percentage shown on the chart is a Signal Strength Score (0-100%), which rates the quality and conviction of the confirmed signal.
The score is calculated as follows:
Base Score Calculation (0-100 points): A base score is calculated for each market (primary and CME) by combining two factors:
Volume Component (0-50 pts): Measures the intensity of the volume spike. A 300% volume spike will score higher than a 150% spike.
Imbalance Component (0-50 pts): Measures the intensity of the buy/sell pressure ratio. A 5x imbalance will score higher than a 3x imbalance.
Advanced Modifiers (Bonus Points): The base score is then enhanced with bonus points for favorable conditions:
Trend Alignment (+10 pts): A buy signal that occurs during a clear uptrend receives extra points.
Candle Structure (+10 pts): A buy signal on a candle with a long lower wick (indicating rejection of lower prices) receives extra points.
Final Averaged Score: The final percentage you see is the average of the two individual strength scores calculated for the primary exchange and the CME market.
4. Visualization
Energy Waves: Signals are displayed as circles. Green for Buy Signals (below the candle) and Red for Sell Signals (above the candle).
Dynamic Sizing: The size of the circle directly reflects the Signal Strength Score, categorized into four distinct levels (e.g., 10%+, 40%+, 60%+, and 80%+) for at-a-glance interpretation.
Percentage Labels: Each signal is plotted with its precise, final strength score for clear analysis.
5. Summary: Steps to Replicate the Logic
To recreate this indicator, follow these high-level steps for each candle on the chart:
Gather Data: Fetch the Open, High, Low, Close, and Volume data for the primary chart asset AND for the corresponding CME Bitcoin Futures symbol (CME:BTC1!).
Calculate Buy/Sell Pressure: For both datasets, use the "Smart Volume Analysis" formula to estimate the buying and selling pressure for the current candle.
Check for Volume Spikes: For both datasets, calculate a simple moving average of the volume. Check if the current candle's volume exceeds this average by a set threshold (e.g., 150%).
Check for Pressure Imbalance: For both datasets, check if the buying pressure is greater than the selling pressure by a set multiplier (e.g., 3.0), or vice versa.
Confirm the Signal: A final signal is only valid if the conditions from both Step 3 and Step 4 are true for both datasets on the same candle.
Calculate Strength: If a signal is confirmed, compute a strength score (0-100) for each dataset based on the intensity of the volume spike and pressure imbalance. Add bonus points for confluence factors like trend alignment.
Finalize and Plot: Average the two strength scores from each market. Plot a colored, sized circle on the chart that visually represents this final averaged score, and display the score as a text label.
Last but not least, the idea of the indicator is inspired by 52SIGNAL

BTC 1H Momentum + Near-Setup Alerts bigbeeukthis alert, sets up on 1h chart of BTC only. it alerts you to price action and when its close to a setup. it will then trigger again once the setup is ready

BTC Pi Cycle Top + 50W MA To indicate BTC TOP using pi cycle top + weekly 50 MA
Both overlay in a chart.
by ahmadzombie
19.10.2025
BTC Flow Dashboard (Spot Premium + OI + Funding)It builds a single flows dashboard that shows whether real spot demand (fiat buyers) or leveraged perps (futures traders) are driving BTC, and then cross-checks that with Open Interest (OI) and funding pressure—all normalized so you can spot regime shifts and squeeze risk fast.
How to read it (practical playbook)
Continuation (healthier trend)
Price ↑, premium > 0 and rising, oiZ ≥ 0 → spot sponsoring the move; perps chase → add on pullbacks.
Leverage-led & vulnerable
Price ↑, premium < 0, fundZ > 0 (expensive longs) → crowding → fade extensions / expect sharp pullbacks.
Buyable dip / absorption
Price ↓, premium ≥ 0 (spot supporting), oiZ flat/down, fundZ ≤ 0 → selling looks weak → scale into reversals.
Exhaustion / mean reversion
premZ ≥ +2 after a run → flows unusually hot → take profits / tighten risk.
premZ ≤ −2 into key support → capitulation risk but also bounce setups if OI/funding aren’t pressuring.

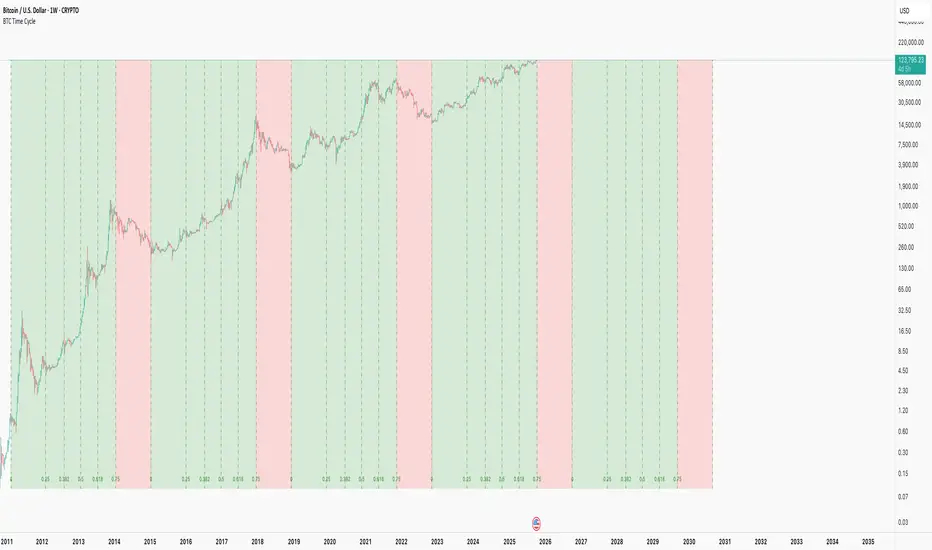
BTC Time CycleThis indicator helps track Bitcoin's historical four-year cycles by dividing time from market bottoms into Fibonacci-based segments, providing clear visual cues for potential bullish and bearish phases.
How It Works: This indicator overlays repeating Fibonacci-based time cycles onto weekly BTC charts , plotting vertical lines at key Fib ratios (0, 0.25, 0.382, 0.5, 0.618, 0.75, 1.0) to track cycle progress. Each cycle concludes at 1.0 and seamlessly resets as the next cycle's 0, capturing historical trough-to-trough intervals like those observed from 2018 to 2022. The week preceding the 0.75 Fibonacci ratio typically signals the cycle peak and bear market onset, transitioning through the final phase until 1.0 initiates a new cycle.
Disclaimer: This pattern has consistently repeated in past cycles, but financial markets are inherently unpredictable—it is not guaranteed to persist and remains valid only until disproven. Treat it as an analytical aid, not a predictive certainty.
This is merely a curiosity and is: True until it isn't™
BTC Price Spread Heatmap (Coinbase vs Binance (chart symbol))Observation was made about price spread varying among exchanges. Original event took place Oct 4-5th. BIN/BTC was about 1K lower than COIN/BTC.
Implemented a visualization to capture specifically Binance and coinbase spread comparison. This may lend as a tool to help build a case if there is a correlation. At this time Binance holds 43.1% of the market share and coinbase a mear 5.5%...

BTC TOPperThe BTC TOPper indicator is a sophisticated technical analysis tool designed to identify critical price levels where Bitcoin's weekly Simple Moving Average (SMA) intersects with historically significant All-Time High (ATH) levels. This indicator is particularly valuable for long-term trend analysis and identifying potential reversal zones in Bitcoin's price action.
Key Features:
🔹 Weekly SMA Analysis: Uses a 200-period Simple Moving Average on weekly timeframe to smooth out short-term volatility and focus on long-term trends
🔹 Persistent Historical ATH Tracking: Automatically detects and "freezes" ATH levels that have been held for more than one year, creating persistent reference levels
🔹 Multi-Level Cross Detection: Tracks up to 10 different frozen ATH levels simultaneously, providing comprehensive historical context
🔹 Visual Cross Alerts: Highlights entire weeks with red background when the weekly SMA crosses any frozen ATH level, making signals impossible to miss
🔹 Advanced Smoothing Options: Includes optional secondary moving averages (SMA, EMA, SMMA, WMA, VWMA) with Bollinger Bands for enhanced analysis
🔹 Customizable Parameters: Adjustable SMA length, offset, and smoothing settings to fit different trading strategies
How It Works:
ATH Detection: Continuously monitors for new all-time highs
Level Freezing: After an ATH is held for 1+ year, it becomes a "frozen" historical level
Cross Monitoring: Watches for intersections between the 200-week SMA and any frozen ATH level
Signal Generation: Highlights the entire week when a cross occurs, providing clear visual alerts
Trading Applications:
Long-term Trend Analysis: Identify when Bitcoin approaches historically significant resistance levels
Reversal Zone Detection: Spot potential areas where price might reverse based on historical context
Support/Resistance Confirmation: Use frozen ATH levels as dynamic support and resistance zones
Market Structure Analysis: Understand how current price relates to historical market cycles
Best Practices:
Use on weekly timeframe for optimal results
Combine with other technical indicators for confirmation
Pay attention to multiple frozen levels clustering in the same price range
Consider market context and fundamentals alongside technical signals
Settings:
Length: 200 (default) - SMA period
Source: Close price
Smoothing: Optional secondary MA with multiple types available
Bollinger Bands: Optional volatility bands around secondary MA
This indicator is ideal for Bitcoin traders and analysts who want to understand the relationship between current price action and historical market structure, particularly useful for identifying potential major reversal zones based on historical ATH levels.

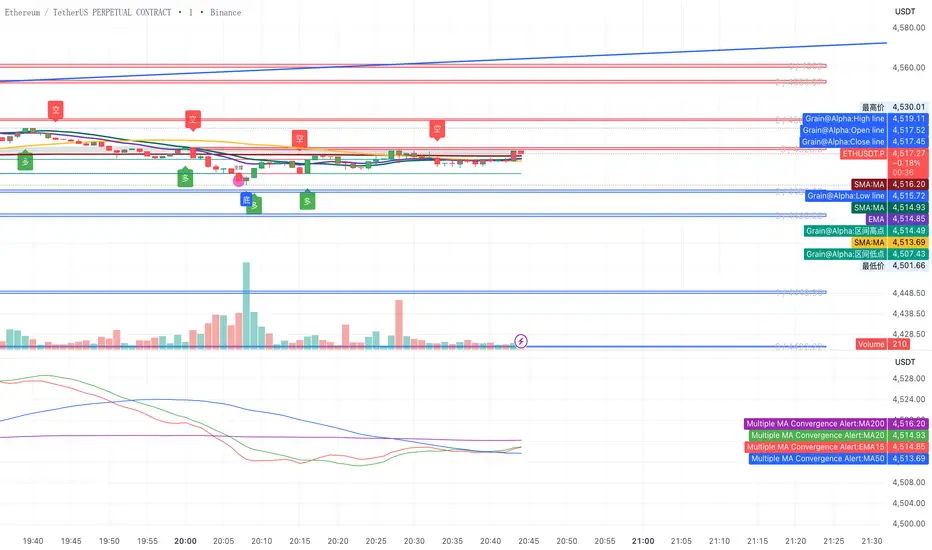
ma btc Multiple MA Convergence Alertbtc and eth ma15 20 50 200if converge
alert("EMA15, MA20, MA50, MA200 are converging/overlap crossing!", alert.freq_once_per_bar_close)