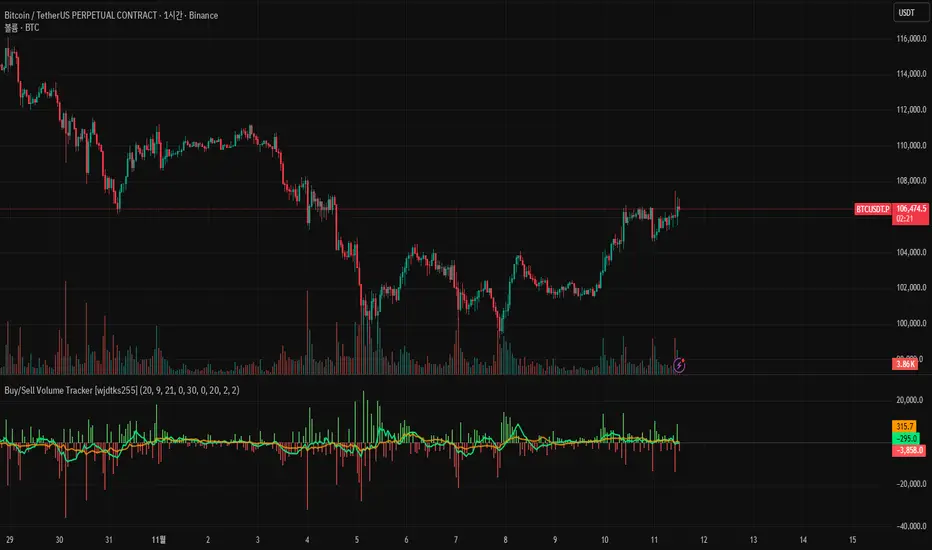
Buy/Sell Volume Tracker [wjdtks255]Indicator Description
Function: Separates buy and sell volume based on candle direction (close ≥ open) and displays the buy−sell difference (hist_val) as a histogram.
Visuals: Buy/sell bars are distinguished by user-selectable colors and opacity; two moving averages (MA1 and MA2) are shown to smooth the flow.
Meaning: A positive histogram indicates buy dominance; a negative histogram indicates sell dominance.
Limitation: The current separation is estimated from candle direction and may differ from execution-side (tick/trade-side) based data.
Trading Rules (Summary)
Conservative trend-following long
Entry: Enter long when hist_val turns above 0 and MA1 crosses MA2 from below.
Stop-loss: Exit if hist_val falls back below 0 or MA1 drops below MA2.
Take-profit: Use a risk:reward of 1:1.5 or set targets based on ATR.
Short-term rebound long
Entry: Enter a short-term long when a large negative histogram region begins to narrow and shows a recovery sign.
Stop-loss: Exit if hist_val drops below the previous low or bearish candles continue.
Take-profit: Prefer quick partial profit-taking.
Short (sell) strategy
Entry: Enter short when hist_val falls below 0 and MA1 crosses MA2 from above.
Stop-loss / Take-profit: Apply the inverse rules of the long strategy.
Filters and risk management
Volume filter: Only accept signals when volume exceeds a fraction of average volume to reduce noise.
Entry strength: Require |hist_val| to exceed a historical average threshold (e.g., avg(|hist_val|, N) × factor) to strengthen signals.
Position sizing: Size positions so that account risk per trade is within limits (e.g., 1–2% of account equity).
Timeframe: Use short timeframes for scalping and 1h+ for swing trading.
חפש סקריפטים עבור "Buy sell"
Buy - Sell indicatorKey Features:
🎯 Multi-Indicator Signal System
Parabolic SAR + CCI (Commodity Channel Index) combination
Bollinger Bands with customizable smoothing
DEMA (Double Exponential Moving Average) trend confirmation
WaveTrend Cross oscillator
📊 Smart Trend Detection
EMA-based trend filter (21/50 periods)
Strong trend tracking with consecutive rise counter
Dynamic trailing stop mechanism
Volume surge detection for momentum confirmation
📈 Advanced Entry/Exit Logic
Fibonacci-based decline ratio filter (prevents premature entries)
Second bottom confirmation for safer entries
Dynamic sell levels that adapt to strong trends
Automatic pivot high/low detection
💰 DCA (Dollar Cost Averaging) System
Automatic DCA level plotting on 9/3 signal combinations
Customizable buy levels (-0.6%, -0.94% default)
Customizable sell targets (+0.85%, +1.5% default)
Visual price lines extending 50 bars forward
⚙️ Customizable Filters
Minimum bar spacing between signals (default: 20)
Volume filter with adjustable multiplier
Toggle for trend filters and hidden signal display
Separate controls for EMA lines, ratio info, and trend info
📋 Comprehensive Info Table
Real-time indicator values
Current trend status
DCA trigger status
Rally/decline ratio tracking
Last buy/sell prices
Best Used For:
Swing trading on 4H-1D timeframes
Cryptocurrency and volatile assets
Catching reversals at Bollinger Band extremes
Managing positions with predefined DCA levels
Alerts Available:
Buy signal alerts
Sell signal alerts
DCA 9/3 combination alerts

Buy Sell Volume Dashboard (Conditional Colors)Display all data in the box (dashboard) on the top right chart.
✅ Data output:
Buy Volume
Sell Volume
Volume Difference (Buy – Sell)
Buy % / Sell % Dominance
✅ Auto according to the timeframe we open (for example if open 5m, data follows 5m; if daily, follow daily).

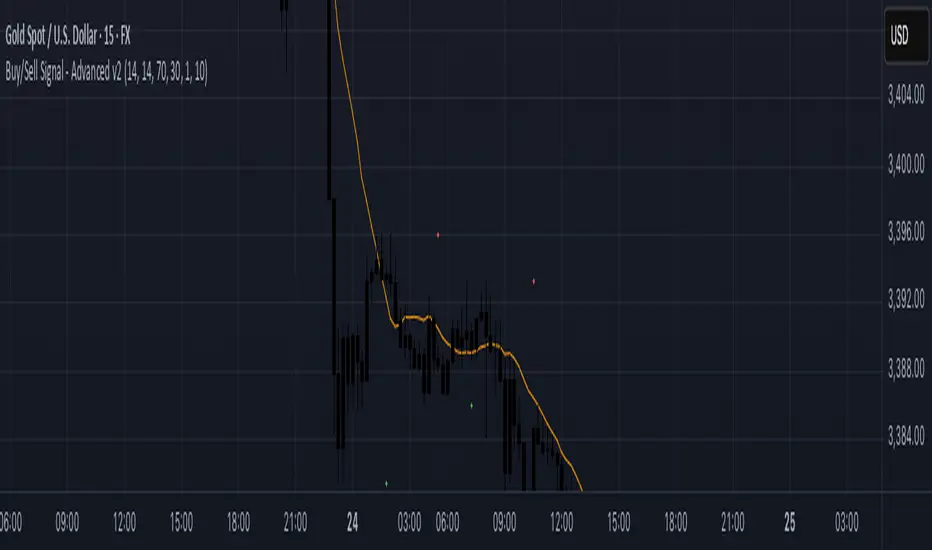
Buy/Sell Signal - Advanced v2The Buy/Sell Signal – Advanced v2 indicator is a powerful tool designed for traders who seek more reliable and filtered entries. This indicator combines classic technical analysis with modern enhancements to reduce noise and false signals. It generates Buy signals when a bullish candle closes above the 14-period Simple Moving Average (SMA), the RSI is below the oversold threshold (default: 30), and trading volume is higher than the 20-period average—indicating strong momentum and potential reversal from a discounted price zone. Conversely, a Sell signal appears when a bearish candle closes below the SMA, RSI is above the overbought level (default: 70), and volume exceeds its average—signaling potential weakness after a price rally.
In addition to entry signals, the indicator automatically plots dynamic support and resistance levels using pivot highs and lows. These levels help traders identify key zones for confirmation, breakout, or rejection. The SMA provides trend direction context, while the volume and RSI filters act as safeguards to avoid trading in low-quality conditions.
Ideal for scalpers and intraday traders on 5-minute to 1-hour timeframes, this indicator helps capture trend continuations and early reversals with confidence. For best results, use the signals in conjunction with multi-timeframe analysis and price action confirmation. This tool is especially effective on assets like XAUUSD, forex pairs, and indices.
BUY/SELL Timeframe ContinuityTime frame continuity refers to the alignment of price trends across multiple time frames. This means that the price movement is showing a consistent trend (either up or down) on various timeframes, like the 5-minute, 30-minute, hourly, and daily charts.
Why is it important?
Confirms Trend Strength: When multiple timeframes align, it indicates a strong and sustained trend.
Risk Management: Trading in the direction of the aligned trend can reduce risk.
This indicator checks if the current price of a selected timeframe is above or below its opening price. A buy/sell signal appears the second all bullish timeframes align (buy) or all bearish timeframes align. You can choose to paint the candles when the buy/sell conditions happen. You can select up to 10 different timeframes.
NOTE: With this indicator I prefer timeframes 15m, 30m, 1H, 4H, D, 5D, W - Together these timeframes are great for short-term trends on any stock.

Buy-Sell-Hold RecommendationsDescription:
The indicator displays "recommendations" for the active symbol (Buy, Strong buy, Sell, Strong sell or Hold), based on the Tradingview's recommendations data. There are 3 presentations you can choose from:
- Bar -> displays a vertical/horizontal bar with sections for each rating
- Pie chart -> displays a pie chart with sections
- Table -> displays a table with score for each recommendation
Inputs:
- Display mode -> data presentation mode
- Position -> position of the bar/pie chart/table
- Highlight the highest rating -> recommendation(s) with highest score will be highlighted
- Buy, Strong buy, Sell, etc. -> colors of the "bar" sections
- Pixel Width, Pixel Height, etc. -> size of each "pixel" (cell) of the pie chart
- Resolution (X), Resolution (Y) -> how many pixels (cells) the pie chart has on each axis
- Inner area size (%) -> size of the empty space at the center of the pie chart
- Invert theme -> invert coloring scheme for "table" presentation mode
Notes:
- Tradingview seems to provide the recommendations only for major stocks
- Data is taken directly from Tradingview and is based on opinions of "analysts"

Buy Sell Trend MonitorDescription
The purpose of this indicator is to create symbols that try to show the most accurate positions possible for trading. The formation of BUY/SELL symbols is based on the intersection of SYMBOL(Himself), BTC.D, BTC and DXY indices. The resulting signals take values between 0 and 16. These values represent the strength of the signal, and the higher its numerical value, the stronger the signal. Here, 2 different calculation methods are followed for BTC and Altcoins. In BTC, calculations are made according to the direction of BTC Market value and DXY averages, while in Altcoins, calculations are made according to the direction of BTC, BTC.D and DXY averages. If DXY for BTC is trending downwards and the BTC market value is trending upwards, the BUY symbol is formed depending on the level at which the trend occurs. For altcoins, if DXY is trending down, BTC is trending up and BTC.D is trending down, the BUY symbol is formed depending on the level at which the trend occurs. For the SELL signal, the opposite is true.
Symbols are drawn according to standard ticker and OHLC4 values.
The averages of the 1-length RSI value of these symbols are taken as the 6-length SMA.
Symbols
The symbols are explained one by one below.
Orange Line: Bitcoin Marketcap line.
White Line: DXY line.
Red Line: Bitcoin Dominance line.
Aqua Line: Current Symbol line.
Best Use
This indicator should be used for SPOT trades. Regardless, since it is not possible to know exactly the direction of the market, it should be considered to buy gradually at buy signals and sell gradually at sell signals.
It should be followed for at least a 4-hour period. We do not recommend its use as the margin of error will increase in shorter time periods.
Since the signals are not guaranteed to work 100%, we do not recommend you to trade with all your money.
No Repainting
Repainting is definitely not done. After the symbols appear, the closing should be expected. Once the closing occurs, the symbol will now be permanent.
Disclaimer
This indicator is for informational purposes only and should be used for educational purposes only. You may lose money if you rely on this to trade without additional information. Use at your own risk.
Version
v1.0

BUY/SELL RSI FLIUX v1.0The "BUY/SELL RSI FLUX v1.0" indicator is designed to provide buy and sell signals based on the RSI (Relative Strength Index) and price action in relation to support and resistance levels. It overlays directly on the price chart and includes the following components:
- Support and Resistance Levels: Determined over a specified number of bars (lengthSR), these levels represent potential barriers where price action may stall or reverse.
- ATR (Average True Range): Used to measure market volatility. While it's calculated in the script, it's not visualized on the chart as per the latest modification.
- RSI: The RSI is calculated over a defined period (lengthRSI) and is used to identify overbought or oversold conditions. Buy signals are generated when the RSI is below the oversold threshold (rsiOversold) and the price is above the support level. Conversely, sell signals occur when the RSI is above the overbought threshold (rsiOverbought), the price is below the resistance level, and additionally, the price is below a long-term moving average, which acts as a trend filter.
- Long-Term Moving Average: This moving average is plotted to help identify the prevailing market trend. Sell signals are filtered based on the price's position in relation to this moving average.
- Buy/Sell Signals: Visual representations in the form of shapes are plotted below (for buy) or above (for sell) the price bars to indicate potential entry points.
By combining these elements, the indicator aims to provide high-probability trading signals that align with both the market's momentum and trend.

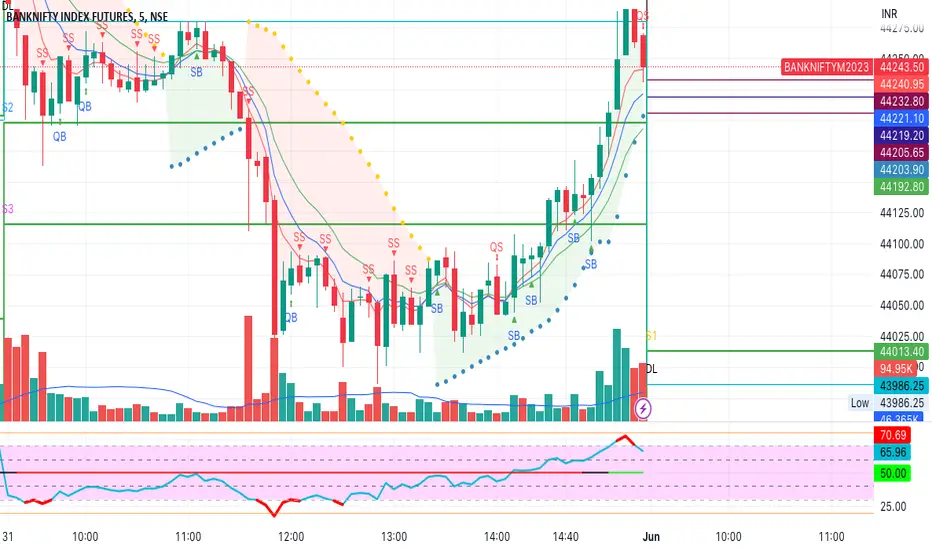
Buy Sell using 5-8-13 EMA, RSI, PSAR IndicatorThis indicator generates Scalping and Strong Buy/Sell Signals.
Quick Scalp signals are generated using 5 EMA and RSI.
Strong Buy/Sell Signals are generated using combination of 5-8-13 EMA and Parabolic SAR.
Signals generated:
QB: Quick Buy
QS: Quick Sell
SB: Strong Buy
SS: Strong Sell
BUY/SELL + ADVANCE DECLINEThis script is a custom trading view indicator that helps to identify potential buy and sell signals based on the RSI (Relative Strength Index) and SMA (Simple Moving Average) indicators. The script also identifies potential reversals using a combination of RSI and price action. It plots buy, sell, and reversal signals on the chart along with an SMA line. Additionally, it provides alerts based on the buy, sell, and reversal conditions.
Changes made to the original script:
Fixed the undeclared identifier 'c' error by calculating the difference between the current closing price and the previous closing price: c = close - close .
Added an "ADD Value Floating Label" to the chart. The label shows the difference between the current and previous closing prices (ADD value) along with a "Bullish" or "Bearish" indicator based on the value of 'c'. The label is positioned at the top right of the visible chart area and remains static.
Here's a summary of the major components of the script:
Input settings: Define the input parameters for RSI and SMA.
Calculation of RSI and SMA: Compute the RSI and SMA values based on the input parameters.
Color definitions: Define colors for different conditions and levels.
Condition definitions: Define various conditions for buy, sell, reversal, and other criteria.
Buy and sell conditions: Determine buy and sell signals based on RSI, SMA, and price action.
Reversal conditions: Identify potential reversals using RSI and price action.
Plot signals: Display buy, sell, and reversal signals on the chart.
Bar colors: Color the bars based on the identified signals.
Plot SMA: Display the SMA line on the chart.
Alert conditions: Set up alerts for buy, sell, and reversal conditions.
ADD Value Floating Label: Add a label to the chart showing the ADD value and a "Bullish" or "Bearish" indicator.

Volume Buy/Sell (by iammaximov)Buy/Sell Volume
Buy/Sell volume based on total bar amplitude (high/low price) and close/open (for calculate vbuy > vsell or vbuy < vsell)

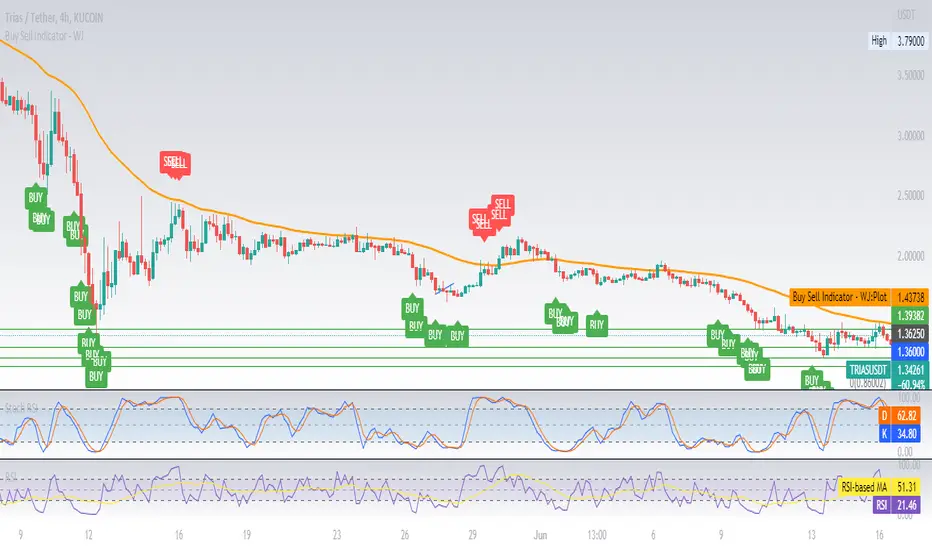
Buy Sell Indicator - WJThis is a simple Buy Sell indicator using the 3 indicators namely EMA50, RSI3 and ADX5. This is just for illustration feel free to test it and make improvements.
Buy/Sell Aggregated Delta Pressure - InFinitoModified & Updated script from MARKET VOLUME by Ricardo M Arjona @XeL_Arjona that Includes Aggregated Volume , Delta Buy/Sell Pressure
Aggregation code originally from Crypt0rus
***The indicator can be used for any coin/symbol to aggregate volume , but it has to be set up manually***
***The indicator can be used with specific symbol data only by disabling the aggregation option, which allows for it to be used on any symbol***
- Calculated based on Aggregated Volume instead of by symbol volume . Using aggregated data makes it more accurate and allows to compare volume flow between different kinds of markets (Spot, Futures , Perpetuals, Futures+Perpetuals and All Volume ).
- As well, in order to make the data as accurate as possible, the data from each exchange aggregated is normalized to report always in terms of 1 BTC . In case this indicator is used for another symbol, the calculations can be adjusted manually to make it always report data in terms of 1 contract/coin.
- Buy/Sell Pressure: Smoothens the buy and sell volume into a signal for each. Which makes it easier to identify Buy and Sell Volume Flow.
- Buy/Sell Delta Pressure: Calculates the difference between Buy & Sell Pressure and plots a Delta signal that shows who is in control currently.
- Buy/Sell + Delta Pressure: Displays both Buy & Sell Pressure and Delta pressure. This can help to visualize who is in control but also how much pressure there is on each side.
- A Moving Average can be plotted to the Delta pressure. This, with confluence, can give great entries/exits
Things to look for:
- Divergences: If price keeps moving in one direction but the pressure to that side decreases it can be inferred that the move might slow down soon or revert. As well if pressure to one side increases but price does not react to it, it signals that the other side is stronger.
- MA/Zero Crossovers: Delta Pressure Crossover of its moving average or the 0 Line can indicate direction changes prematurely

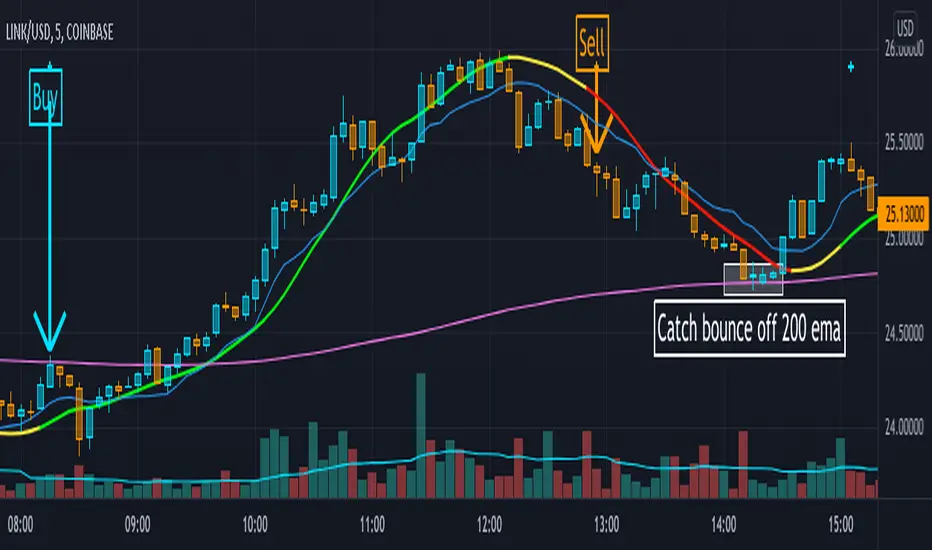
BUY/SELL SIGNALS from LSMA/ALMA/HMAThis indicator uses the Least Squares Moving Average (LSMA) in tandem with the Arnaud Legoux Moving Average (ALMA) and Hull Moving Average (HMA) to generate buy-sell signals, represented by the light blue and orange crosses respectively.
The yellow lines produced by the indicator show periods of market uncertainty and possible reversal, and a modified, user-defined VWAP is given along with a 200 EMA. The point of this indicator was to create a smoother, more visually appealing moving-average, price action-based indicator when compared to the trend-step and simple moving average indicators available. This indicator uses a fast (25 period) LSMA coupled with a slower (50 period) HMA and ALMA in order to make signals both smooth and fast.
This indicator will work on all markets, except the modified VWAP will naturally not function if the volume is unpublished for that market. Use of this indicator will be very strong in trending markets, as the yellow line will spot possible reversals quite early, meaning the trader can be ready early for the buy/sell signal to appear. Use of this indicator in sideways market conditions will be limited, as it is for all moving average-based indicators, but the damage will be minimal as bad trades will be quickly realized by the indicator and the color will switch to yellow, this is possible because of the settings differences between the period lengths of the LSMA vs the ALMA + HMA.
Buy/Sell RatingIdentifies prices above and below input percentile thresholds over the input length of time. Use to identify buy/sell opportunities relative to recent pricing. Also provides percent of price distance from moving average over the same length.

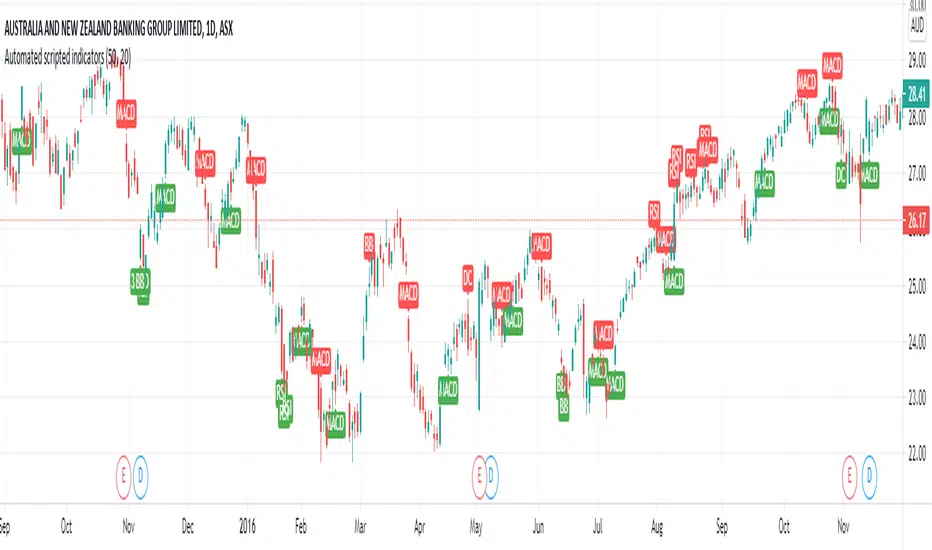
Buy Sell signals for indicatorsThis is a simple script where I have compiled my most commonly used overlays and given each unique buy/sell signals. I have found this to greatly simply my searching for future trades as it quickly outlines the current technical postion of the stock.
Some cons of this script though is the visualization can get messy due to multiple alerts being set off.
--> RSI
Buy signal at or above 70
Sell Signal at or below 30
--> MACD
Buy signal at crossover between macd line and signal line aswell as the histogram line being above 0
Sell signal at crossover between signal line and macd line aswell as the histogram line being below 0
--> Standard Deviations from Mean
Buy signal when the price is 3 standard deviations from the mean.
Sell signal when the price is 3 standard deviations from the mean.
Mean can be adjusted in settings
--> Donchian Channels
Buy signal when the lowest length value is greater than or equal to low aswell as rsi > 45 to help eliminate false signals
Sell signal when the highest length value is greater than or equal to high aswell as rsi < 55 to help eliminate false signals
--> Bollinger bands
Buy when low is at or below the lower band
Sell when high is at or above the higher band
Soon to come:
--> Linear regression
--> ATR
--> CCI
--> Volume
PS. I can also add candlestick patterns, Gann and Fib levels aswell if it will help people out :)
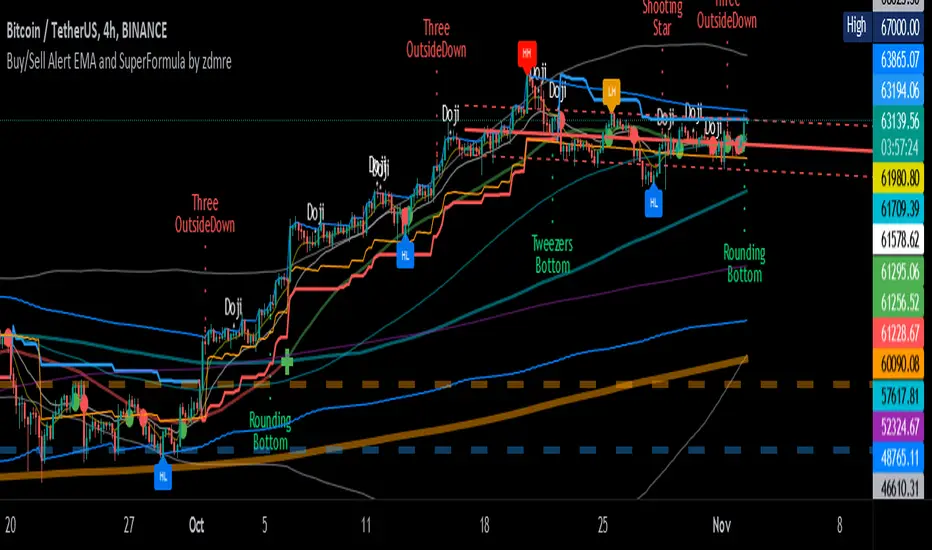
Buy/Sell Alert EMA with SuperFormula by zdmre*** Use it at your own risk
This indicator has 3 indicators and gives a buy/sell signal depending on the EMA.
3 indicators:
- Ichimoku
- Bollinger Band
- EMA
It also shows the value on the candle as a warning in the Buy and Sell signals. This value is calculated with a special formula I have created.
On the other hand Bollinger Band and Ichimoku Cloud are also included to check the accuracy of the signals.
For this indicator, I recommend a minimum of 4 hours chart.
Buy/Sell/TP/SL/TSL Alerts ModuleThis tool is not a self-sufficient indicator, just an attachable module that allows you to enhance a specific indicator with risk management components without having a headache.
What you need to do, and actually this is the most important step, is to rewrite your indicator to a buy-sell signal form which will output only -1, 0, 1 values and then connect it to the module.
After that the module gives you a lot of possibilities to customize Take Profit, Stop Loss and Trailing Stop Loss levels through the settings window and to set all the alerts you need up.
Simple Buy/Sell setup for the RSI:
Now I am adding Stop Loss:
and Take Profit:
and finally Trailing Stop Loss:
Okay, I have shown how it works with RSI signals. Here is example for the MACD:
and example for the WaveTrend Oscillator:
If you have any questions don't hesitate to ask and contact me either via private messages on TradingView or via Telegram

Buy Sell SignalsWill be making more enhancements to the Buy Sell indicator in the coming days..
The main idea of the indicator is to pick up small but powerful ups and downs in the market.
I personally use 1 min Time Frame as it works the best for me. These are quick entries, you can either exit quickly or trail your stoplosses for a nice profit.
The design is to provide possible entry points. It is not designed to provide you with Exit points.
Also added the Current Day High & Current Day Low (CDH & CDL can change when new highs or new lows are made in intraday).
PDH & PDL denotes the Previous Day High and Low (these are static lines that do not change)
This gives you a sense of how the day is moving.
Please do your own analysis before you take up entries. Trade at your own risk..!
Time Frame: works best in intra day time frames like 1 min, 3 min and 5 mins
Signal:
Possible Long Trend: Background color is GREEN, there is a high possibility that the price would shoot up
Possible Short Trend: Background color is RED, there is a high possibility that the price would take a nose dive
A continued GREEN or RED background does not indicate a fresh entry, it merely shows that the conditions still haven't changed.
Risky traders can still take up a new position or add to their positions when there is a continuous same color - GREEN or RED
When there is no background color, it means that not all conditions are met to give a clear direction. In short the view is neutral.
Recommended Stop Loss or Take Profit:
I personally use 0.5% as the SL and 0.5% as TP. You can use multiples of 0.5% to keep trailing your profits. I've seen some very good results with this. By default, 0.5% for both SL & TP is shown with a grey dotted line for both the Long positions and Short positions.
Alternatively, you can also use the Resistance levels and Support levels as your SL and TP areas too.
Do backtest and find your sweet spot.
Good luck..!

buy/sellits a EMA crossover pls only trade if the gape between the 3 line is proper (no claims, rights reserved i am not responsible for any loss)

Buy/Sell Signal base on RSIHi there,
This is my new script: Buy Sell Signal base on RSI Divergence!
Green arrow below the candle is the buy signal
Red arrow above the candle is the sell signal
Use it with other indicators to get better confirmation.
Highly recommend using it on the high timeframe like 4H or Daily chart.
Hope you like it!
- From Tonyz of TTC