cephxs / Quarterly Theory [Ultimate +]QUARTERLY THEORY
Multi-cycle Sequential SMT divergence analysis with 7-layer time fractal detection, PSP swing points, CISD momentum tracking, Purge visualization, and a comprehensive alert system with preset combinations.
This indicator is subject to the terms of the Mozilla Public License 2.0.
WHAT IT DOES
The Quarterly Theory indicator maps Trader Daye's time-based market cycles—from Monthly down to Nano—and detects SSMT (Sequential SMT) divergences across correlated assets within each cycle. It tracks when your chart asset and its correlated pairs disagree on highs and lows, often preceding significant reversals.
This is NOT a signal generator. It is a divergence detection tool designed to show you WHEN correlated markets are disagreeing within the natural rhythm of time cycles—information that helps identify high-probability turning points.
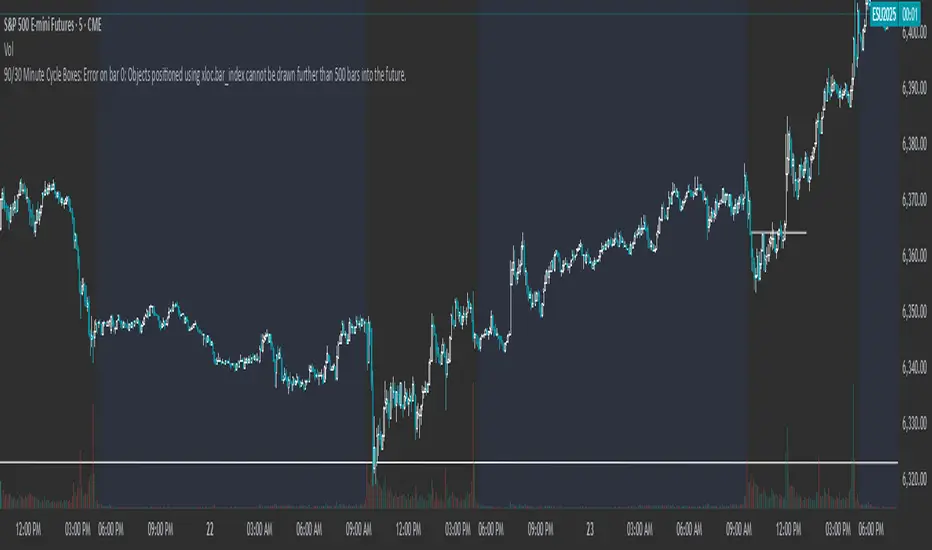
-- IMAGE: Main indicator view showing SSMT lines across multiple cycles --
CORE CONCEPTS
Quarterly Theory Time Cycles
The indicator tracks 7 nested time cycles based on ICT/Daye's Quarterly Theory:
Monthly: Week-based quarters within each month (Q1-Q4)
Weekly: Daily quarters within each trading week
Daily: Session-based quarters (Asia, London, NY AM, NY PM)
90m: 90-minute cycles divided into quarters (~22.5 minutes each)
30m: 30-minute cycles (90m divided by 3)
Micro: 64 sessions per day (~22.5 minutes each)
Nano: 256 sessions per day (~5-6 minutes each) - optional high-resolution mode (basically each Micro session divided by 4)
Each cycle has its own SSMT detection, allowing you to see divergences across multiple time fractals simultaneously.
SSMT (Sequential SMT) Divergences
SSMT tracks when correlated assets disagree on extremes within a time cycle:
Bullish SSMT: Primary asset makes a lower low while correlated asset makes a higher low
Bearish SSMT: Primary asset makes a higher high while correlated asset makes a lower high
Lines connect the divergent extremes, providing visual confirmation of market disagreement.
Normal vs Hidden Divergences
Normal: Wick-based extremes—traditional SMT comparing session highs and lows
Hidden: Body-based extremes—more selective, comparing close prices for stronger signals according to some.
You can display Normal only, Hidden only, or Both for maximum information—flexible.
All of these lines have robust labels and dual label handling for when correlations occur with two of the assets in the triad at once to avoid collision.
PSP (Precision Swing Points)
A PSP is not just a pivot—it is a pivot WITH a divergence on the closure. When one asset makes a new high or low but correlated assets FAIL to confirm, the pivot becomes a Precision Swing Point. These often mark significant turning points. It also highlights PSPs that are not divergences for even more advanced analyses and alerts.
Example: ES closes bullish on a candle, but NQ closes bearish. If this occurs at a pivot point, the C2 candle is flagged as a PSP on the chart itself. The indicator also allows one to filter PSPs based on proximity to an existing SMT Divergence.
CISD (Change In State of Delivery)
CISD identifies momentum shifts after pivot formation by detecting opposing candle stretches and confirming when price closes beyond the stretch level. This helps validate directional commitment. It uses a custom pivot system to track originating trends.
Purge Detection
Purges occur when price sweeps through a previous pivot level (liquidity grab). The indicator tracks these events with solid/dotted line visualization and optional alerts.
KEY FEATURES
7-Layer Cycle Detection: Monthly, Weekly, Daily, 90m, 30m, Micro, and Nano cycles all computed simultaneously
Auto Timeframe Gating: Automatically shows relevant cycles based on your chart timeframe. On 15m, you see Daily SSMT. On 1m, you see Micro and 30m SSMT.
Dual Detection Modes: Normal (wick) and Hidden (body) divergence detection per cycle
Automatic Asset Correlation: Uses the same AssetCorrelationUtils library as our other tools—auto-detects correlated pairs or configure manually
Per-Cycle Colors: Customize bull/bear colors for each cycle level
Pivot Time Labels: Optional time labels at swing points with key time highlighting
Purge Visualization: Solid lines for confirmed purges, dotted extensions while active
CISD with Size Filter: ATR-based filtering to ignore insignificant stretches
THE ALERT SYSTEM
The Quarterly Theory indicator provides a comprehensive alert system with multiple layers:
Individual Event Alerts
Swing High/Low: Alert when a new pivot forms
Purge High/Low: Alert when price sweeps through a pivot level
CISD Pending/Confirmed: Alert on momentum shift detection
SSMT per Cycle: Individual alerts for Monthly, Weekly, Daily, 90m, 30m, Micro divergences
CISD Model Combo Alerts
Pre-built alert presets that combine SSMT + CISD confirmation per cycle:
Monthly SSMT + CISD
Weekly SSMT + CISD
Daily SSMT + CISD
90m SSMT + CISD
30m SSMT + CISD
Micro SSMT + CISD
Stacked (multiple cycles aligning)
PSP Model Combo Alerts
Alerts when a Precision Swing Point forms with SSMT confirmation:
PSP + SSMT per cycle
PSP + Stacked SSMT (multiple cycles)
Directional filtering (bullish/bearish only)
Alert Kitchen - Custom Combos
Build your own alert conditions by combining:
Any cycle level (or multiple)
Direction (bullish/bearish/both)
Detection type (Normal/Hidden/Both)
Additional filters (CISD, PSP, Purge/Sweep)
Session Filter
Restrict alerts to specific trading sessions: Asia, London, NY AM, NY PM, London + NY, or define a custom time window.
-- IMAGE: Alert settings panel --
Will be streamlining the inputs to allow for an improved UX.
HOW TO USE IT
Getting Started (2 minutes)
Add the indicator to your chart
SSMT lines will appear automatically based on your timeframe
Each colored line represents a divergence at that cycle level
Labels show the cycle name and/or correlated asset
Understanding the Display
Lines connecting highs = Bearish SSMT (potential reversal down)
Lines connecting lows = Bullish SSMT (potential reversal up)
Solid lines = Normal divergence (wick-based)
Dotted lines = Hidden divergence (body-based)
Line color = Cycle level (customizable per cycle)
Adjusting Timeframe Visibility
Auto: Shows only the most relevant cycle for your chart TF
All: Shows all enabled cycles regardless of chart TF
Extended: Broader visibility ranges per cycle
Custom: Define exact min/max TF ranges per cycle
Configuring Asset Correlation
Go to Asset Selection settings
Set to Auto (detects correlated assets automatically)
Or set to Manual and enter custom ticker symbols
Use Invert Asset 3 for inverse correlations (e.g., DXY vs EUR/USD)
Pro Tips
Start with Auto timeframe gating to reduce clutter
Focus on one or two cycle levels until you understand the rhythm
Enable Hidden divergence for higher-probability signals
Use the Directional Bias Filter to focus on one direction only
The Status Bar shows current cycle states at a glance
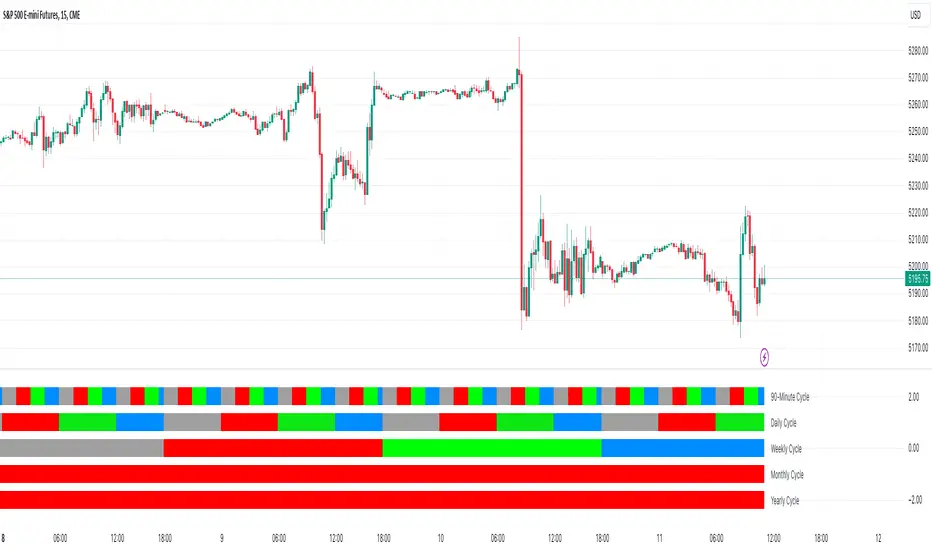
-- IMAGE: Status bar showing active cycles vs when it's not active --
INPUT SETTINGS OVERVIEW
These inputs may change as updates roll out with improvements.
Visual Preset
Preset options: SSMT Only, SSMT + CISD, SSMT + Purge, CISD + Purge, All Features
Directional Bias Filter: All, Bullish only, Bearish only
SSMT Plots (Section 2)
Show SSMT master toggle
Labels toggle with size and color
Label Mode: Cycle + Asset, Cycle only, Asset only
Timeframe Gating: Auto, All, Extended, Custom
Detection Mode: Normal, Hidden, All
Per-cycle toggles and colors (Monthly through Nano)
Min/Max TF ranges for Custom mode
Pivot & PSP Settings (Section 3)
Show swing high/low shapes
Shape styles and colors
Show pivot lines with crossing style
PSP highlighting options
Pivot Time Labels (Section 3.5)
Show Time Labels toggle
Key time highlighting (macros)
Label styling options
Purge Settings (Section 4)
Show purge lines
Solid/dotted line styles
Line colors for bull/bear
CISD Settings (Section 5)
Show CISD toggle
Maximum CISDs displayed
Size filter (ATR-based)
Bull/bear colors
Alert Sections (6-11)
Master switches
Session filter
Individual event alerts
CISD model combos
PSP model combos
Alert Kitchen custom combos
Asset Selection (Section 12)
Correlation Preset: Off, Auto, Manual
Manual Asset 1/2/3 inputs
Invert Asset 3 for inverse correlations
Status Bar (Section 13)
Position, size, colors
Shows active cycle states
SUPPORTED MARKETS
The built-in correlation library automatically detects pairs for:
Index Futures: NQ/ES/YM/RTY and micro variants
Forex: EUR/GBP/DXY triad, USD/JPY/CHF triad, CAD pairs
Crypto: BTC/ETH/TOTAL3, SOL/XRP pairs, major alts
Metals: Gold/Silver/Copper
Energy: Crude/Gasoline/Heating Oil
Treasuries: ZB/ZF/ZN
For assets not covered, use Manual mode to define your own correlation group.
AUTOMATICALLY RECOMMENDED TIMEFRAMES
1m: See Micro and 30m cycles
3m-5m: See 90m and 30m cycles
15m: See Daily cycle
1H: See Weekly cycle
4H: See Monthly cycle
Use Extended or Custom mode to see multiple cycles simultaneously.
TERMINOLOGY QUICK REFERENCE
QT: Quarterly Theory (time-based cycle analysis)
SSMT: Sequential SMT (divergence within a time cycle)
SMT: Smart Money Technique (divergence between correlated assets)
PSP: Precision Swing Point (pivot with divergence)
CISD: Change In the State of Delivery (confirmed directional shift)
Purge: Liquidity sweep through a pivot level
Normal: Wick-based divergence detection
Hidden: Body-based divergence detection
Q1/Q2/Q3/Q4: Quadrants within each cycle
PERFORMANCE NOTES
Micro cycle (64 sessions) adds significant computation load and makes the tool unbearably slow—disable if not needed
30m cycle (48 sessions) is an alternative to Micro with less load
Nano cycle (256 sessions) is optional and only active below 1m timeframes
Use Auto timeframe gating to reduce unnecessary computations
A bar limiter is implemented at the bottom for performance considerations, prioritizing real-time analysis.
DISCLAIMER
This indicator is for educational and informational purposes only. It does not constitute financial advice. Trading involves substantial risk of loss and is not suitable for all investors. Past performance does not guarantee future results. Always use proper risk management and conduct your own analysis before making trading decisions.
CREDITS
Developed by cephxs and fstarcapital
Uses AssetCorrelationUtils library by fstarcapital for automatic correlation detection
Conceptual Credits
This Indicator uses Concepts by the Inner Circle Trader, Michael Huddleston.
This Indicator uses concepts from Quarterly Theory as taught by TraderDaye.
VERSION
PineScript v6 | Ultimate+ Edition
אינדיקטור Pine Script®