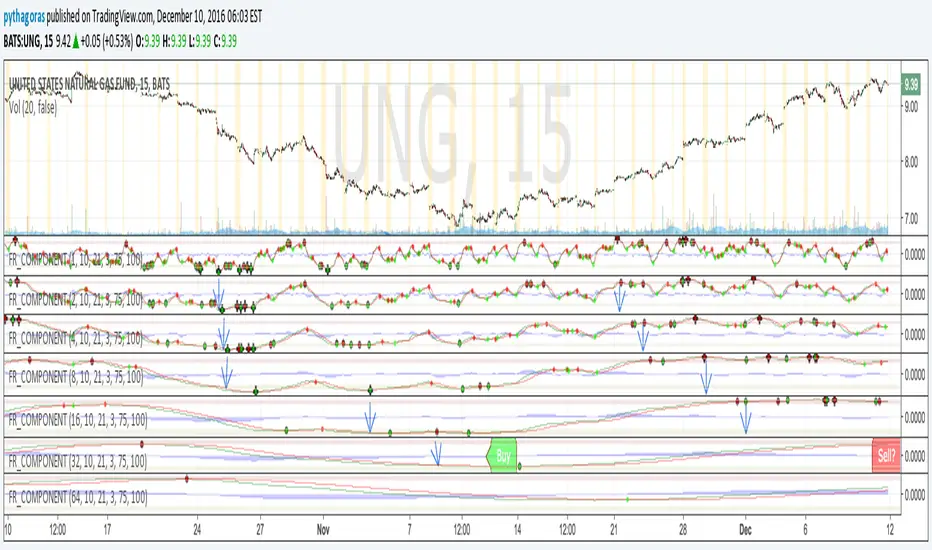
Fractal Resonance ComponentLazyBear's WaveTrend port has been praised for highlighting trend reversals with precision and punctuality (minimal lag). But strong "3rd Wave" trends can "embed" or saturate any oscillator flashing several premature crosses while stuck overbought/oversold. This happens when the trend stretches over a longer timescale than the oscillator's averaging window or filter time constant. Our solution: simultaneously monitor many oscillator timescales. Watch for fresh crossovers in "dominant" timescales alternating most smoothly between the overbought (red shade) and oversold (green shade) range.
Fractal Resonance Component facilitates simultaneous viewing of eight timescales that are power of 2 multiples of the chart timescale. Each timescale shows lead line, lag line, lead-lag difference, and crossover marks. Add 4 to 8 copies to your chart for a good multi-fractal read. Format * the "Timescale Multiplier" attribute of each row to be twice that of the row above for a sequence like 1, 2, 4, 8, 16, 32, 64, 128...
Fractal Resonance Component shifts its timescales along with your choice of main chart timescale:
1 minute chart: 1 minute through 128 minute (~2 hour) oscillators.
1 hour chart: 1 hour through 128 hour (~2 week) oscillators.
Daily chart: 1 day through 128 day (~4 month) oscillators.
Crossovers in different oscillator ranges tend to have different meanings:
Minor (< 75%) crossovers: small green/red dot
usually noise
Overbought/Sold crossovers (shaded 75 to 100%): black outlined dot (o)
reliable reversal indicators (when they appear alone)
Extreme Overbought (> 100%) crossovers: black outlined plus (+).
Can be a major reversal in fast markets, but usually portend the end of Elliot 3rd waves with just a small corrective (4th wave) retrace before the larger impulsive (5-wave) sequence resumes in original direction.
The final 5th-wave terminus should appear later as a lone non-extreme (black outlined circle) crossover on a slower timescale coincident with weaker (non-extreme) dot crosses on this timescale.
Careful examination of historical charts leads to many useful observations such as:
Dominant crossovers punctuating true reversals are usually in the green/red shaded ranges with black outlined dots (o) rather than minor or Extreme (+) ranges.
Due to market's fractal nature, two well-separated timescales like 1 minute and 1 hour can show dominant crosses simultaneously in opposite directions, e.g. the 1 minute showing a very short term high and the 1 hour a medium term low nearby.
Staying Nimble
Watch out for embedding on your supposedly dominant timescale -- a second cross while stuck in the overbought/oversold region suggests a stronger, longer trend than expected. Drop your eyes to a slower timescale below for the real dominant whose crossover will validate main trend reversal.
Embedding can often be predicted even at the first cross mark by checking whether the green lead line of the next slower timescale (one row below) has already hit the Overbought or especially the Extreme Overbought range but isn't close to rolling over. Fractal Resonance Bar (to be published) uses this principle to mark embedded timescales with white stripes, warning of a powerful trend wave on longer timescales you shouldn't fight until the white stripes subside.
Overnight gaps surge all timescales in ways that obscure the dominant timescale, so for shorter than daily charts, these methods work best on Futures contracts that only suffer weekend gaps.
חפש סקריפטים עבור "Elliot"
True Williams Alligator (Timeframe Multiplier)Modified version of my original "True Williams Alligator (SMMA)" indicator that includes a multiplier to show the alligator (ie elliot wave mode) of higher timeframes. See original indicator for details.
Note: First script submission. Didn't mean to use this chart. Ugly and messy. Oops.
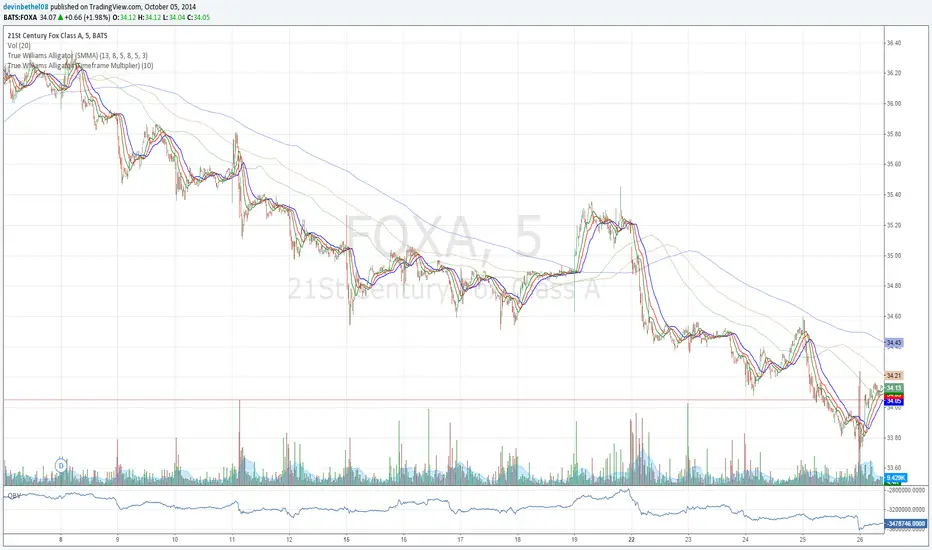
True Williams Alligator (Timeframe Multiplier)Modified version of the true alligator indicator (ie SMMA) that features a timeframe multiplier so that you can monitor the elliott wave of higher timeframes. (See original "True Williams Alligator" for more details.)
Note: First script submission. Didn't mean to use this chart. Also this is a duplicate post -- oops.

True Williams Alligator (SMMA)The built-in implementation of the alligator is incorrect. It uses SMA with altered input parameters to approximate the true alligator indicator.
The alligator was created with a supercomputer to model the elliott wave - it's very apart from other MA techniques. The built-in approximation (and similar techniques) and the true alligator yield very different conclusions. Hence the need for this, a true and exact implementation of "The Mighty Alligator" (Bill Williams, Trading Chaos 1, New Trading Dimensions, Trading Chaos 2).
Note: First script submission. Didn't mean to use this chart. Ugly and messy. Oops.

Advanced Elliott Wave PlotterAdvanced Elliott Wave plotter, Parameters can be adjusted.
AI Generated, so no particular credits to anyone.

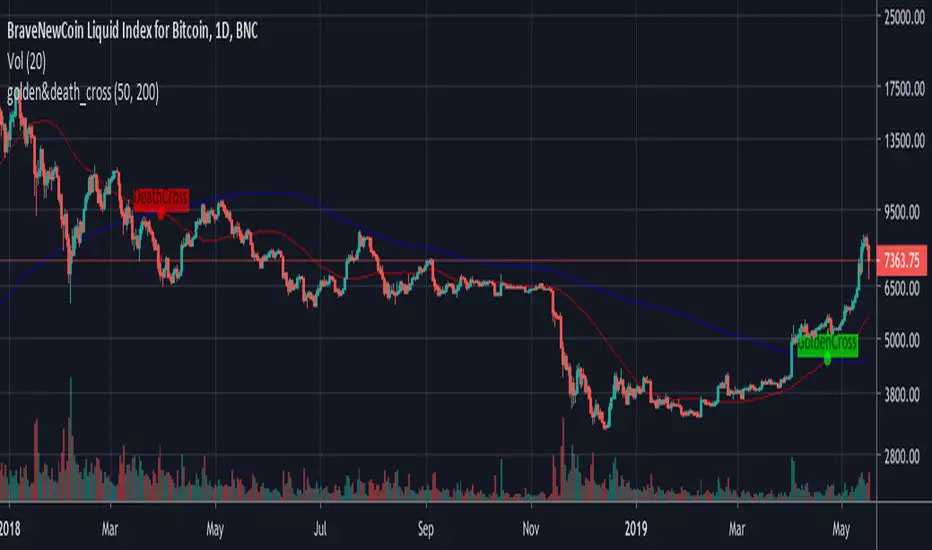
GoldenCross & DeathCrossBNC:BLX
Its a simple Golden- and Death-Cross Indicator BNC:BLX
... it highlights the Crosses and labels them. It also highlights the bar where the cross happend.
Enjoy and buy me a coffee if you liked it.
ETH: 0x4F27c7eC42b898E0B79fA9a35dC9b585e4c56579


Elliott Wave Auto (Impulse + Correction) — stable deleteAutomatic pivot detection: The script identifies swing highs and swing lows using ta.pivothigh and ta.pivotlow.
Impulse wave labeling (1–5):
Detects 5 alternating pivots and labels them as waves 1 to 5.
Uses green/red labels for impulse and correction legs.
Connects waves with blue lines for visual clarity.
Corrective wave labeling (A–B–C):
Detects the next 3 alternating pivots after wave 5.
Labels them as A, B, C with orange lines connecting them.
Dynamic cleanup:
Stores labels and lines in arrays.
Deletes previous drawings automatically before redrawing, keeping the chart clean.
Optional pivot markers:
Plots tiny triangles for detected pivots (green for lows, red for highs).
Information table:
Displays the direction (Bullish/Bearish) and percentage move of the 1–5 impulse waves.
Pine Script v5 compliant:
Uses str.tostring() and array-based deletion to avoid tostring() or line.deleteall() errors.
If you want, I can also add an alert feature to notify you when a full impulse + corrective wave pattern completes. This makes it actionable for trading.

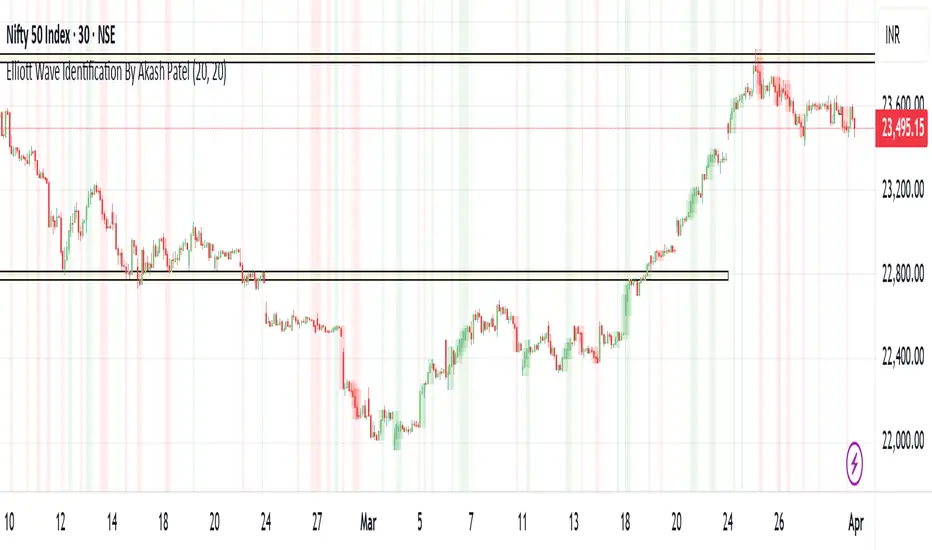
Elliott Wave Identification By Akash Patel
This script is designed to visually highlight areas on the chart where there are consecutive bullish (green) or bearish (red) candles. It also identifies sequences of three consecutive candles of the same type (bullish or bearish) and highlights those areas with adjustable box opacity. Here's a breakdown of the functionality:
---
### Key Features:
1. **Bullish & Bearish Candle Identification:**
- **Bullish Candle:** When the closing price is higher than the opening price (`close > open`).
- **Bearish Candle:** When the closing price is lower than the opening price (`close < open`).
2. **Consecutive Candle Counter:**
- The script counts consecutive bullish and bearish candles, which resets when the direction changes (from bullish to bearish or vice versa).
- The script tracks these counts using the `bullishCount` and `bearishCount` variables, which are incremented based on whether the current candle is bullish or bearish.
3. **Highlighting Candle Areas:**
- If there are **3 or more consecutive bullish candles**, the script will highlight the background in a green color with 90% transparency (adjustable).
- Similarly, if there are **3 or more consecutive bearish candles**, the script will highlight the background in a red color with 90% transparency (adjustable).
4. **Three-Candle Sequence:**
- The script checks if there are three consecutive bullish candles (`threeBullish`) or three consecutive bearish candles (`threeBearish`).
- A box is drawn around these areas to visually highlight the sequence. The boxes extend to the right edge of the chart, and their opacity can be adjusted.
5. **Box Creation:**
- For bullish sequences, a green box is created using the high and low prices of the three candles in the sequence.
- For bearish sequences, a red box is created in the same manner.
- The box size is determined by the highest high and the lowest low of the three consecutive candles.
6. **Box Opacity:**
- You can adjust the opacity of the boxes through the input parameters `Bullish Box Opacity` and `Bearish Box Opacity` (ranging from 0 to 100).
- A higher opacity will make the boxes more solid, while a lower opacity will make them more transparent.
7. **Box Cleanup:**
- The script also includes logic to remove boxes when they are no longer needed, ensuring the chart remains clean without excessive box overlays.
8. **Extending Boxes to the Right:**
- When a bullish or bearish sequence is identified, the boxes are extended to the right edge of the chart for continued visibility.
---
### How It Works:
- **Bullish Area Highlight:** When three or more consecutive bullish candles are detected, the background will turn green to indicate a strong bullish trend.
- **Bearish Area Highlight:** When three or more consecutive bearish candles are detected, the background will turn red to indicate a strong bearish trend.
- **Three Consecutive Candle Box:** A green box will appear around three consecutive bullish candles, and a red box will appear around three consecutive bearish candles. These boxes can be extended to the right edge of the chart, making the sequence visually clear.
---
### Adjustable Parameters:
1. **Bullish Box Opacity:** Set the opacity (transparency) level of the bullish boxes. Ranges from 0 (completely transparent) to 100 (completely opaque).
2. **Bearish Box Opacity:** Set the opacity (transparency) level of the bearish boxes. Ranges from 0 (completely transparent) to 100 (completely opaque).
---
This indicator is useful for identifying strong trends and visually confirming market momentum, especially in situations where you want to spot sequences of bullish or bearish candles over multiple bars. It can be customized to suit different trading styles and chart preferences by adjusting the opacity of the boxes and background highlights.
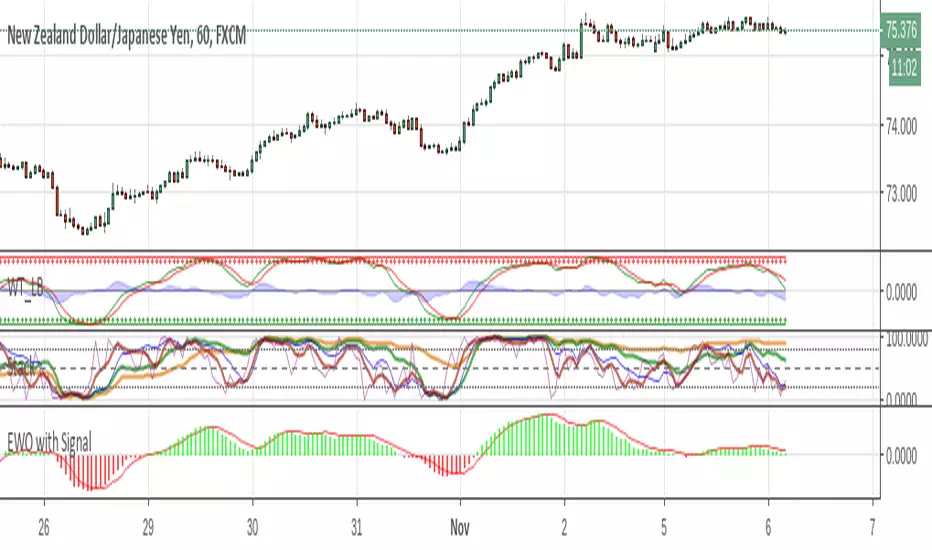
Elliott Wave Oscillator w/ Signal LineI just added a signal line to Koryu's code to fit my trading style. When the signal line crosses zero, it confirms to me that it's safe to trade.

Fractal Market Geometry [JOAT]
Fractal Market Geometry
Overview
Fractal Market Geometry is an open-source overlay indicator that combines fractal analysis with harmonic pattern detection, Fibonacci retracements and extensions, Elliott Wave concepts, and Wyckoff phase identification. It provides traders with a geometric framework for understanding market structure and identifying potential reversal patterns with multi-factor signal confirmation.
What This Indicator Does
The indicator calculates and displays:
Fractal Detection - Identifies fractal highs and lows using Williams-style pivot analysis with configurable period
Fractal Dimension - Calculates market complexity using range-based dimension estimation
Harmonic Patterns - Detects Gartley, Butterfly, Bat, Crab, Shark, Cypher, and ABCD patterns using Fibonacci ratios
Fibonacci Retracements - Key levels at 38.2%, 50%, and 61.8%
Fibonacci Extensions - Projection level at 161.8%
Elliott Wave Count - Simplified wave counting based on pivot detection (1-5)
Wyckoff Phase - Volume-based phase identification (Accumulation, Markup, Distribution, Neutral)
Golden Spiral Levels - ATR-based support and resistance levels using phi (1.618) ratio
Trend Detection - EMA crossover trend identification (20/50 EMA)
How It Works
Fractal detection uses a configurable period to identify swing points:
detectFractalHigh(simple int period) =>
bool result = true
float centerVal = high
for i = 0 to period - 1
if high >= centerVal or high >= centerVal
result := false
break
Harmonic pattern detection uses Fibonacci ratio analysis between swing points. Each pattern has specific ratio requirements:
Gartley: AB 0.382-0.618, BC 0.382-0.886, CD 1.27-1.618
Butterfly: AB 0.382-0.5, BC 0.382-0.886, CD 1.618-2.24
Bat: AB 0.5-0.618, BC 1.13-1.618, CD 1.618-2.24
Crab: AB 0.382-0.618, BC 0.382-0.886, CD 2.24-3.618
Shark: AB 0.382-0.618, BC 1.13-1.618, CD 1.618-2.24
Cypher: AB 0.382-0.618, BC 1.13-1.414, CD 0.786-0.886
Wyckoff phase detection analyzes volume relative to price movement:
wyckoffPhase(simple int period) =>
float avgVol = ta.sma(volume, period)
float priceChg = ta.change(close, period)
string phase = "NEUTRAL"
if volume > avgVol * 1.5 and math.abs(priceChg) < close * 0.02
phase := "ACCUMULATION"
else if volume > avgVol * 1.5 and math.abs(priceChg) > close * 0.05
phase := "MARKUP"
else if volume < avgVol * 0.7
phase := "DISTRIBUTION"
phase
Signal Generation
Signals use multi-factor confirmation for accuracy:
BUY Signal: Fractal low + Uptrend (EMA20 > EMA50) + RSI 30-55 + Bullish candle + Volume confirmation
SELL Signal: Fractal high + Downtrend (EMA20 < EMA50) + RSI 45-70 + Bearish candle + Volume confirmation
Pattern Detection: Label appears when harmonic pattern completes at current bar
Dashboard Panel (Top-Right)
Dimension - Fractal dimension value (market complexity measure)
Last High - Most recent fractal high price
Last Low - Most recent fractal low price
Pattern - Current harmonic pattern name or NONE
Elliott Wave - Current wave count (Wave 1-5) or OFF
Wyckoff - Current market phase or OFF
Trend - BULLISH, BEARISH, or NEUTRAL based on EMA crossover
Signal - BUY, SELL, or WAIT status
Visual Elements
Fractal Markers - Small triangles at fractal highs (down arrow) and lows (up arrow)
Geometry Lines - Dashed lines connecting the most recent fractal high and low
Fibonacci Levels - Clean horizontal lines at 38.2%, 50%, and 61.8% retracement levels
Fibonacci Extension - Horizontal line at 161.8% extension level
Golden Spiral Levels - Support and resistance lines based on ATR x 1.618
3D Fractal Field - Optional depth layers around swing levels (OFF by default)
Harmonic Pattern Markers - Small diamond shapes when Crab, Shark, or Cypher patterns detected
Pattern Labels - Text label showing pattern name when detected
Signal Labels - BUY/SELL labels on confirmed multi-factor signals
Input Parameters
Fractal Period (default: 5) - Bars on each side for fractal detection
Geometry Depth (default: 3) - Complexity of geometric calculations
Pattern Sensitivity (default: 0.8) - Tolerance for pattern ratio matching
Show Fibonacci Levels (default: true) - Display retracement levels
Show Fibonacci Extensions (default: true) - Display extension level
Elliott Wave Detection (default: true) - Enable wave counting
Wyckoff Analysis (default: true) - Enable phase detection
Golden Spiral Levels (default: true) - Display spiral support/resistance
Show Fractal Points (default: true) - Display fractal markers
Show Geometry Lines (default: true) - Display connecting lines
Show Pattern Labels (default: true) - Display pattern name labels
Show 3D Fractal Field (default: false) - Display depth layers
Show Harmonic Patterns (default: true) - Display pattern markers
Show Buy/Sell Signals (default: true) - Display signal labels
Suggested Use Cases
Identify potential reversal zones using harmonic pattern completion
Use Fibonacci levels for entry, stop-loss, and target planning
Monitor Wyckoff phases for accumulation/distribution awareness
Track Elliott Wave counts for trend structure analysis
Use fractal dimension to gauge market complexity
Wait for multi-factor signal confirmation before entering trades
Timeframe Recommendations
Best on 1H to Daily charts. Lower timeframes produce more fractals but with less significance. Higher timeframes provide stronger levels and more reliable signals.
Limitations
Harmonic pattern detection uses simplified ratio ranges and may not match all textbook definitions
Elliott Wave counting is basic and does not include all wave rules
Wyckoff phase detection is volume-based approximation
Fractal dimension calculation is simplified
Signals require fractal confirmation which has inherent lag equal to the fractal period
Open-Source and Disclaimer
This script is published as open-source under the Mozilla Public License 2.0 for educational purposes. It does not constitute financial advice. Past performance does not guarantee future results. Always use proper risk management.
- Made with passion by officialjackofalltrades

Gann Levels (Auto) by RRR📌 Gann Levels (Auto) — Intraday, Swing & Elliott Wave Precision Tool
Gann Levels (Auto) is a high-accuracy price-reaction indicator designed for intraday scalpers, swing traders, and Elliott Wave traders who want clean, auto-updating support and resistance levels without manually drawing anything.
The indicator automatically detects the latest swing high & swing low and plots the 8 Gann Octave Levels between them. These levels act as a complete price map—showing equilibrium, structure, trend continuation zones, and reversal points with extreme precision.
🔥 Why This Indicator Stands Out
✔ Fully automatic swing detection
Levels update as structure evolves — no manual adjustments.
✔ All Gann Octave levels
Plots 1/8 through 8/8 including the critical 4/8 midpoint.
✔ Intraday-optimized
Exceptional on 1m, 3m, 5m, and 15m charts.
✔ Ultra-clean support & resistance
Levels act as reliable barriers and breakout zones.
⭐ MOST IMPORTANT LEVELS FOR INTRADAY
4/8 – Midpoint (Major Decision Pivot)
Strongest Gann level.
Controls trend or reversal for the session.
Breakout → Trend Day
Rejection → Reversal Day
8/8 & 0/8 – Extreme Structure Edges
Most likely zones for intraday reversals.
Perfect for scalp entries when combined with volume exhaustion.
🎯 How to Trade ELLIOTT WAVE Using Gann Levels
This indicator is exceptionally powerful when combined with Elliott Wave Theory.
Here is how to use it wave-by-wave:
🔵 Wave 2 → Identify Bottom Using 0/8 or 1/8 Levels
Wave 2 typically retraces deep but remains above key structure.
Gann confirmation:
Price stops at 0/8 or 1/8 zone
Rejection wick + low volume breakdown attempt
Bullish intent starts forming
This gives a perfect Wave 3 entry zone.
🔴 Wave 3 → Breakout Above 4/8 Midpoint
Wave 3 is the strongest impulsive wave.
The 4/8 level works like a force-field.
Wave 3 confirmation:
Price breaks and retests 4/8
Strong volume
No deep pullbacks after break
This is one of the most reliable Elliott + Gann trades.
🟡 Wave 4 → Uses 3/8 or 5/8 as Support/Resistance
Wave 4 is corrective and shallow compared to Wave 2.
Gann alignment:
Wave 4 often consolidates between 3/8 and 5/8
Levels act like range boundaries
Avoid trading inside chop; wait for breakout
This gives perfect continuation entries for Wave 5.
🟣 Wave 5 → Ends Near 7/8 or 8/8 Extreme Zone
Wave 5 usually ends in overbought territory.
Gann confirmation:
Price hits 7/8 or 8/8
Momentum weakens
Divergence builds (RSI/MACD optional)
Last push = exhaustion
This is where reversals or major pullbacks begin.
💥 BONUS: Corrective Waves (A-B-C)
Wave A:
Often rejects from 4/8 or 5/8.
Wave B:
Typically trapped between 3/8–5/8.
Wave C:
Usually ends around 0/8 (for bullish trend)
or 8/8 (for bearish trend).
These zones give ultra-high confidence entries.
⚙️ Who This Indicator Is Perfect For
Elliott Wave traders
Intraday scalpers
Swing traders
Price action & structure traders
Traders who want automatic support-resistance levels
Traders who want clean, non-cluttered levels
⚠️ Disclaimer
This indicator is for educational purposes only.
Trading involves risk. Always use proper risk management.

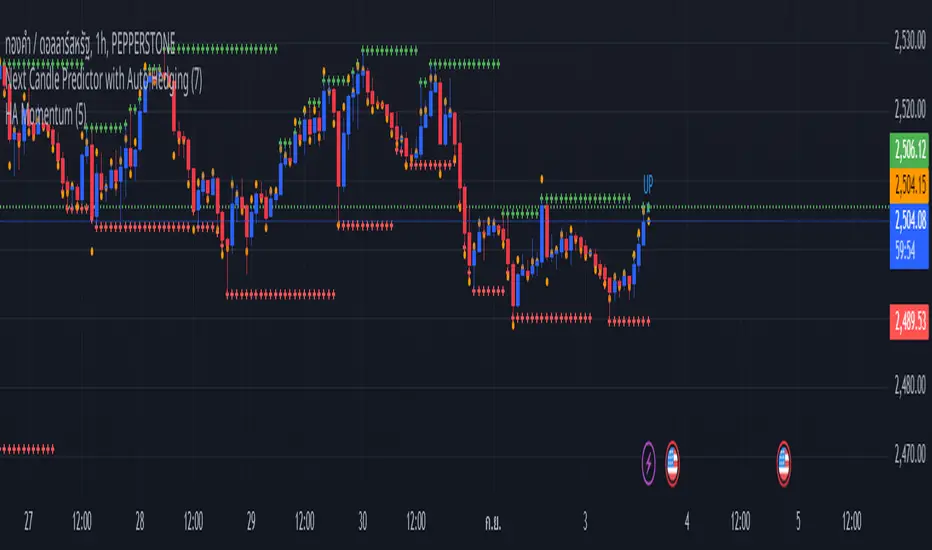
Next Candle Predictor with Auto HedgingThe "Next Candle Predictor with Auto Hedging" is a Pine Script indicator designed for use on TradingView. It combines predictive analysis and basic hedging techniques to assist traders in making informed decisions. Here's a detailed explanation suitable for public sharing on TradingView:
Overview
This script predicts the closing price of the next candle based on the current candle's open and close prices. It also includes an auto hedging feature that suggests potential hedging levels to mitigate risk based on the predicted price movement. The indicator is particularly useful for traders looking to enhance their trading strategies with predictive analytics.
Key Features
Next Candle Prediction:
The indicator analyzes the current candle's data (open and close prices) to predict whether the next candle will close higher or lower.
If the current candle is bullish (close > open), it predicts a higher close for the next candle. Conversely, if the candle is bearish, it predicts a lower close.
Auto Hedging:
The script calculates a hedging level based on the predicted close price.
If the predicted close indicates a bullish move, the hedge level is set slightly below the predicted close, suggesting where a trader might consider placing a hedge. If the prediction indicates a bearish move, the hedge level is set above the predicted close.
Elliott Wave Analysis:
The script includes a basic implementation of identifying significant price movements, akin to Elliott Wave analysis, by detecting peaks and troughs over a specified number of bars (wave length).
This can help traders identify potential trend reversals or continuations.
How It Works
Input Parameters: Users can customize the waveLength parameter, which determines how many bars back the script looks to identify significant highs and lows.
Peak and Trough Detection: The script identifies the highest high and lowest low within the specified wave length, plotting these points on the chart for visual reference.
Prediction Logic: The predicted close is calculated based on the current candle's behavior, allowing traders to anticipate price movements.
Hedging Level Calculation: The script dynamically calculates a hedging level based on the predicted close, providing a visual cue for potential risk management strategies.
Visual Representation
The indicator plots:
Elliott Wave Highs: Marked in green.
Elliott Wave Lows: Marked in red.
Predicted Close: Shown as a blue step line.
Hedge Level: Displayed as an orange step line.
Benefits
Enhanced Decision-Making: By providing predictions and potential hedging levels, traders can make more informed decisions about entering or exiting positions.
Risk Management: The auto hedging feature helps traders manage risk by suggesting levels where they might place hedges against adverse price movements.
Customizable: The script allows for user-defined parameters, making it adaptable to different trading strategies and market conditions.
Conclusion
The "Next Candle Predictor with Auto Hedging" indicator is a powerful tool for traders seeking to enhance their trading strategies with predictive analytics and risk management techniques. By utilizing this indicator, traders can gain insights into potential price movements and make more informed trading decisions.
Feel free to explore the script, customize it to fit your trading style, and engage with the TradingView community for further insights and improvements!
Related
All Chart Patterns [theEccentricTrader]█ OVERVIEW
This indicator automatically draws and sends alerts for all of the chart patterns in my public library as they occur. The patterns included are as follows:
• Ascending Broadening
• Broadening
• Descending Broadening
• Double Bottom
• Double Top
• Triple Bottom
• Triple Top
• Bearish Elliot Wave
• Bullish Elliot Wave
• Bearish Alternate Flag
• Bullish Alternate Flag
• Bearish Flag
• Bullish Flag
• Bearish Ascending Head and Shoulders
• Bullish Ascending Head and Shoulders
• Bearish Descending Head and Shoulders
• Bullish Descending Head and Shoulders
• Bearish Head and Shoulders
• Bullish Head and Shoulders
• Bearish Pennant
• Bullish Pennant
• Ascending Wedge
• Descending Wedge
• Wedge
█ CONCEPTS
Green and Red Candles
• A green candle is one that closes with a close price equal to or above the price it opened.
• A red candle is one that closes with a close price that is lower than the price it opened.
Swing Highs and Swing Lows
• A swing high is a green candle or series of consecutive green candles followed by a single red candle to complete the swing and form the peak.
• A swing low is a red candle or series of consecutive red candles followed by a single green candle to complete the swing and form the trough.
Peak and Trough Prices
• The peak price of a complete swing high is the high price of either the red candle that completes the swing high or the high price of the preceding green candle, depending on which is higher.
• The trough price of a complete swing low is the low price of either the green candle that completes the swing low or the low price of the preceding red candle, depending on which is lower.
Historic Peaks and Troughs
The current, or most recent, peak and trough occurrences are referred to as occurrence zero. Previous peak and trough occurrences are referred to as historic and ordered numerically from right to left, with the most recent historic peak and trough occurrences being occurrence one.
Upper Trends
• A return line uptrend is formed when the current peak price is higher than the preceding peak price.
• A downtrend is formed when the current peak price is lower than the preceding peak price.
• A double-top is formed when the current peak price is equal to the preceding peak price.
Lower Trends
• An uptrend is formed when the current trough price is higher than the preceding trough price.
• A return line downtrend is formed when the current trough price is lower than the preceding trough price.
• A double-bottom is formed when the current trough price is equal to the preceding trough price.
Range
The range is simply the difference between the current peak and current trough prices, generally expressed in terms of points or pips.
Retracement and Extension Ratios
Retracement and extension ratios are calculated by dividing the current range by the preceding range and multiplying the answer by 100. Retracement ratios are those that are equal to or below 100% of the preceding range and extension ratios are those that are above 100% of the preceding range.
Measurement Tolerances
Tolerance refers to the allowable variation or deviation from a specific value or dimension. It is the range within which a particular measurement is considered to be acceptable or accurate. I have applied this concept in my pattern detection logic and have set default tolerances where applicable, as perfect patterns are, needless to say, very rare.
Chart Patterns
Generally speaking price charts are nothing more than a series of swing highs and swing lows. When demand outweighs supply over a period of time prices swing higher and when supply outweighs demand over a period of time prices swing lower. These swing highs and swing lows can form patterns that offer insight into the prevailing supply and demand dynamics at play at the relevant moment in time.
‘Let us assume… that you the reader, are not a member of that mysterious inner circle known to the boardrooms as “the insiders”… But it is fairly certain that there are not nearly so many “insiders” as amateur trader supposes and… It is even more certain that insiders can be wrong… Any success they have, however, can be accomplished only by buying and selling… hey can do neither without altering the delicate poise of supply and demand that governs prices. Whatever they do is sooner or later reflected on the charts where you… can detect it. Or detect, at least, the way in which the supply-demand equation is being affected… So, you do not need to be an insider to ride with them frequently… prices move in trends. Some of those trends are straight, some are curved; some are brief and some are long and continued… produced in a series of action and reaction waves of great uniformity. Sooner or later, these trends change direction; they may reverse (as from up to down), or they may be interrupted by some sort of sideways movement and then, after a time, proceed again in their former direction… when a price trend is in the process of reversal… a characteristic area or pattern takes shape on the chart, which becomes recognisable as a reversal formation… Needless to say, the first and most important task of the technical chart analyst is to learn to know the important reversal formations and to judge what they may signify in terms of trading opportunities’ (Edwards & Magee, 1948).
This is as true today as it was when Edwards and Magee were writing in the first half of the last Century, study your patterns and make judgements for yourself about what their implications truly are on the markets and timeframes you are interested in trading.
Over the years, traders have come to discover a multitude of chart and candlestick patterns that are supposed to pertain information on future price movements. However, it is never so clear cut in practice and patterns that where once considered to be reversal patterns are now considered to be continuation patterns and vice versa. Bullish patterns can have bearish implications and bearish patterns can have bullish implications. As such, I would highly encourage you to do your own backtesting.
There is no denying that chart patterns exist, but their implications will vary from market to market and timeframe to timeframe. So it is down to you as an individual to study them and make decisions about how they may be used in a strategic sense.
█ INPUTS
• Change pattern and label colours
• Show or hide patterns individually
• Adjust pattern ratios and tolerances
• Set or remove alerts for individual patterns
█ NOTES
I have decided to rename some of my previously published patterns based on the way in which the pattern completes. If the pattern completes on a swing high then the pattern is considered bearish, if the pattern completes on a swing low then it is considered bullish. This may seem confusing but it makes sense when you come to backtesting the patterns and want to use the most recent peak or trough prices as stop losses. Patterns that can complete on both a swing high and swing low are for such reasons treated as neutral, namely all broadening and wedge variations. I trust that it is quite self-evident that double and triple bottom patterns are considered bullish while double and triple top patterns are considered bearish, so I did not feel the need to rename those.
The patterns that have been renamed and what they have been renamed to, are as follows:
• Ascending Elliot Waves to Bearish Elliot Waves
• Descending Elliot Waves to Bullish Elliot Waves
• Ascending Head and Shoulders to Bearish Ascending Head and Shoulders
• Descending Head and Shoulders to Bearish Descending Head and Shoulders
• Head and Shoulders to Bearish Head and Shoulders
• Ascending Inverse Head and Shoulders to Bullish Ascending Head and Shoulders
• Descending Inverse Head and Shoulders to Bullish Descending Head and Shoulders
• Inverse Head and Shoulders to Bullish Head and Shoulders
You can test the patterns with your own strategies manually by applying the indicator to your chart while in bar replay mode and playing through the history. You could also automate this process with PineScript by using the conditions from my swing and pattern libraries as entry conditions in the strategy tester or your own custom made strategy screener.
█ LIMITATIONS
All green and red candle calculations are based on differences between open and close prices, as such I have made no attempt to account for green candles that gap lower and close below the close price of the preceding candle, or red candles that gap higher and close above the close price of the preceding candle. This may cause some unexpected behaviour on some markets and timeframes. I can only recommend using 24-hour markets, if and where possible, as there are far fewer gaps and, generally, more data to work with.
█ SOURCES
Edwards, R., & Magee, J. (1948) Technical Analysis of Stock Trends (10th edn). Reprint, Boca Raton, Florida: Taylor and Francis Group, CRC Press: 2013.

Amazing Oscillator MTF MulticolorIngles
The amazing multitemporal oscillator, allows you to see in a single graph the Waves that move the market in different temporalities, that is, you will be able to see the market trend, the impulse movement, the forced movement, and the entry and exit points, as well as also how both collide with each other, to understand why the smaller waves succumb to the impulse of the larger waves.
Elliot already described them as such, in his legacy of the Elliot waves and their different sub-waves, just as Wycoff spoke of the theory of effort and result.
Español:
El oscilador asombroso multitemporal, permite ver en una sola grafica las Ondas que mueven el mercado en diferentes temporalidades, es decir, podrás ver la tendencia del mercado, el movimiento de impulso, el movimiento de fuerza y los puntos de entrada y salida, así como también como ambos chocan entre si, para entender porque las ondas mas pequeñas sucumben al impulso de las ondas de mayor tamaño.
Ya Elliot las describía como tal, en su legado de las ondas de Elliot y sus diferentes sub-ondas, al igual que Wycoff hablaba de la teoría de esfuerzo y resultado.

Amazing Oscillator MTF plusIngles
The amazing multitemporal oscillator, allows you to see in a single graph the Waves that move the market in different temporalities, that is, you will be able to see the market trend, the impulse movement, the force movement and the entry and exit points, as well as also how both collide with each other, to understand why the smaller waves succumb to the impulse of the larger waves.
Elliot already described them as such, in his legacy of the Elliot waves and their different sub-waves, just as Wycoff spoke of the theory of effort and result.
Español:
El oscilador asombroso multitemporal, permite ver en una sola grafica las Ondas que mueven el mercado en diferentes temporalidades, es decir, podrás ver la tendencia del mercado, el movimiento de impulso, el movimiento de fuerza y los puntos de entrada y salida, así como también como ambos chocan entre si, para entender porque las ondas mas pequeñas sucumben al impulso de las ondas de mayor tamaño.
Ya Elliot las describía como tal, en su legado de las ondas de Elliot y sus diferentes sub-ondas, al igual que Wycoff hablaba de la teoría de esfuerzo y resultado.

qEMA 3 LineMy scenario consists of 3 ema lines which are ema 34, ema89, ema 144.
3 ema lines are important in elliott waves:
- A complete elliott wave of 144 waves
- An eliott wave has 89 waves
- In wave with wave, in wave 89 again wave 34 waves
I used to find the waves in elliott, know where the cycle elliott will end up (when the price hit ema144)

Indicator: ElliotWave Oscillator [EWO]This oscillator has to be used in conjunction with other EW tools (certainly cannot be the main indicator).
EWO has:
- Higher values during third waves' up
- Lower but still Positive values during the first and fifth waves up
- Negative values during the biggest corrections or downtrend impulse waves.
Personally, I am still trying to figure out EW, so do not use this. Just wanted to publish this for the EW masters out there who can put this to good use.
Appreciate any comments/feedback.

deKoder | Structural Flow [SF]deKoder | SF | Structural Flow - Swing/Pivot Structure Charting
Strips away the noise of standard candlestick charts and reveals the true underlying swing structure through clean, connected pivot lines.
Beneath the storm of wicks / Silent structure whispers truth
Extreme Noise Reduction
Replaces cluttered price action with a minimalist pivot based line chart. The user-defined Window length lets you control sensitivity: shorter for more detail on lower timeframes, longer for cleaner structure on higher timeframes.
Accurate Swing Detection
Only stronger pivots are accepted. Weaker same side pivots are ignored, preserving the true extreme highs and lows without distortion.
Real Time Extension
The final incomplete leg dynamically follows the current close until the next confirmed pivot forms.
Optional Directional Colouring
Enable Directional Colouring to automatically colour confirmed legs with the user defined bull and bear colours on upward and downward swings.
Adjustable Background Candles
Candles with adjustable transparency may be displayed on the chart. Adjust the visibility setting to find the perfect balance between full raw candle data and clean structure
Practical Uses
Instantly reveals classic chart patterns — head & shoulders, double tops/bottoms, triangles, flags with unmistakable clarity
Becomes simple to spot Wyckoff springs, upthrusts, and phase transitions inside trading ranges
Provides a clean foundation for manual Elliott Wave counting . Clear swing structure makes labeling impulses and corrections much easier
Makes trend changes and potential reversals stand out without second-guessing every wick
Excellent for higher-timeframe structural analysis — the longer window setting produces exceptionally clean swing views
Ideal for creating clean educational screenshots and annotated posts - the chart speaks for itself
Reduces emotional noise by shifting focus from every candle to meaningful swing structure
Well suited for swing and price action traders, Wyckoff and Elliott Wave analysis, and anyone who prefers calm, uncluttered charts over constant visual chaos.
Clean charts. Clear sight.
☠ FR33FA11 | deKoder ☠
Released January 2025 | Open Source
If this open-source script (or any of its free companions) has saved you time or helped you read the market better, a coffee or a few sats helps to keep the Pine coming ❤️
Solana: 2N8HWPAHSC7Z8SLyneMrZp234UAP9HCtQX7wNXw7LKQC
Ethereum: 0xE770D254DC579d1db7bA2fe74376b7009527356B
Bitcoin: bc1qd8j3awht5yrjtnvt5dagxldzhaesc83sftype3
Polygon: 0xE770D254DC579d1db7bA2fe74376b7009527356B
Hype: 0xE770D254DC579d1db7bA2fe74376b7009527356B

Waves UltimateWaves Ultimate is a comprehensive Elliott Wave analysis tool designed to assist traders in identifying and validating wave structures in real-time. This indicator combines automatic wave detection with strict Elliott Wave rule validation, Fibonacci projections, and visual wave labeling to provide a complete wave analysis suite.

Auto 5-Wave Fixed Channel + Wave 5 Top / Wave 2-ABC BottomAuto 5-Wave Fixed Channel + Wave 5 Top / Wave 2-ABC Bottom
by Ron999
1. What this indicator does
This tool automatically hunts for bullish 5-wave impulse structures and then:
Labels the waves: W1, W2, W3, W4, W5
Draws a fixed “acceleration” channel based on the wave structure
Projects a Wave-5 target zone using a 1.618 extension
Marks the Wave-2 level as an ABC correction target
Triggers optional alerts when:
A new Wave-5 top completes
An ABC bottom forms back near the Wave-2 low
It’s designed as a mechanical, rule-based approximation of Elliott 5-wave impulses – built for traders who like the idea of wave structure but want something objective and programmable.
2. How the wave logic works
The script continuously scans for pivot highs and lows using a user-defined Pivot Length.
It only keeps the last 5 alternating pivots (high → low → high → low → high).
When those last 5 pivots form this pattern:
Pivot 1 → High (W1)
Pivot 2 → Low (W2)
Pivot 3 → High (W3)
Pivot 4 → Low (W4)
Pivot 5 → High (W5)
…the indicator treats this as a bullish 5-wave impulse.
When such a structure is detected, it “locks in” the wave prices and bars and draws the channels and labels.
Note: Pivots are only confirmed after Pivot Length bars, so swings are slightly delayed by design (standard pivot logic).
3. Channels & levels
Once a valid bullish 5-wave structure is found, the script builds three key pieces:
a) Base Acceleration Channel (Blue)
Anchored from Wave-2 low toward Wave-3 high.
This forms a rising acceleration channel that represents the impulse leg.
The channel extends to the right, so you can see how price interacts with it after W3–W5.
b) Wave-5 Target Line (Red, dashed)
Uses the height from Wave-2 low to Wave-3 high.
Projects a 1.618 extension of that height above Wave-3.
This line acts as a potential Wave-5 exhaustion zone (take-profit / reversal watch area).
c) Wave-2 / ABC Bottom Level (Green, dotted)
Horizontal line drawn at the Wave-2 low.
This acts as a retest / corrective target for the ABC correction after the impulse completes.
When price later revisits this area (within a tolerance), the script can mark it as a potential ABC bottom.
4. Labels & signals
If labels are enabled:
W1, W2, W3, W4, W5 are plotted directly on their corresponding pivot bars.
When an ABC-style retest is detected near the Wave-2 level, an “ABC” label is printed at that low.
Wave-5 Top Event
Triggered when a new valid bullish 5-wave structure is completed.
The last pivot high in the pattern is flagged as Wave-5.
ABC Bottom Event
After a Wave-5 impulse, the script watches for new low pivots.
If a new low forms within ABC Bottom Proximity (%) of the Wave-2 price, it is treated as an ABC bottom near Wave-2 and marked on the chart.
5. Inputs & customization
Show Fixed Channels
Toggle all channel drawing on/off.
Label Waves
Toggle plotting of W1–W5 and ABC labels.
Alerts: Wave-5 Top & ABC Bottom
Master switch for enabling the script’s alert conditions.
Pivot Length
Controls how “swingy” the detection is.
Smaller values → more frequent, smaller waves
Larger values → fewer, larger structural waves
ABC Bottom Proximity (%)
Allowed percentage distance between the ABC low and the Wave-2 price.
Example: 5% means any ABC low within ±5% of Wave-2 is considered valid.
6. Alerts (how to use them)
The script exposes two alertcondition() events:
Wave-5 Top (Bullish Impulse)
Fires when a new 5-wave bullish structure completes.
Use this to watch for potential exhaustion tops or to tighten stops.
ABC Bottom near Wave-2 Low
Fires when an ABC-style correction prints a low near the Wave-2 level.
Use this to stalk potential end-of-correction entries in the direction of the original impulse.
On TradingView, add an alert to the script and choose the desired condition from the dropdown.
7. How to use it in your trading
This tool is best used as a structural context layer, not a standalone system:
Identify bullish impulsive trends when a Wave-5 structure completes.
Use the Wave-5 target line as a potential area for:
Scaling out
Watching for exhaustion / divergences / reversal patterns
Use the Wave-2/ABC level and ABC Bottom signal:
To look for end of correction entries back in the trend direction
To align with your own confluence (support/resistance, volume, RSI, etc.)
It works well on crypto, FX, indices, and stocks, especially on higher timeframes where structure is cleaner.
8. Limitations & notes
This is a mechanical approximation of Elliott 5-wave theory — it will not match every analyst’s discretionary count.
Pivots are confirmed after Pivot Length bars, so signals are not instant; they’re based on completed swings.
The indicator currently focuses on bullish impulses (upward 5-wave structures).
As always, this is not financial advice. Combine it with your own strategy, risk management, and confirmation tools.
Created & coded by: Ron999
Built for traders who want wave structure + fixed channels, without the subjective Elliott argument on every chart. files.catbox.moe
