[JL] Fractals ATR BlockI decided to combine Fractal ROC , ATR Break, and Order Blocks to an Indicator
The Fractal ROC , ATR Break, and Order Blocks indicator combines three concepts to help traders identify potential trade opportunities and manage risk. By using a combination of Fractal ROC , ATR Break, and Order Blocks, traders can gain a deeper understanding of market dynamics and make more informed trading decisions.
Fractal ROC is a momentum-based indicator that calculates the rate of change of the price between fractals, which are turning points in the market. It is calculated by taking the difference between the closing price and the lowest price in the previous n+1 periods, and dividing it by the difference between the open price 2n periods ago and the lowest price in the previous n+1 periods. This calculation is done for both up and down fractals. When the Fractal ROC value is greater than the ROC Break Level (as determined by the input variable roclevel), it indicates a potential momentum shift in the market. This can be used to identify potential trade entries or exits, depending on your trading strategy.
ATR Break is an indicator that helps traders identify significant price movements in the market. It measures the distance between the price and the Average True Range (ATR), which is a measure of the volatility of the market. ATR Break is calculated by taking the difference between the close and high/low, and dividing it by the previous ATR value. This calculation is done for both up and down movements. When the ATR Break value is greater than the ATR Break Level (as determined by the input variable atrlevel), it indicates a significant move in the market. This can be used to identify potential breakouts or breakdowns, and can be used to set stop-loss and take-profit levels.
An Order Block is a price level where significant buying or selling activity has taken place. The order blocks made by ATR Break and Fractal ROC are drawn using boxes on the chart. When the ATR or Fractal ROC level is breached, a box is drawn with the high and low of the candle that breached the level as the top and bottom of the box, respectively. The box is then extended to the right until the end of the chart or until another ATR or Fractal ROC level is breached, at which point a new box is drawn. This allows traders to easily identify significant price movements and potential support and resistance levels on the chart. When an Order Block is identified, it can be used as a potential support or resistance level . If price approaches an Order Block from below, it is likely to bounce off this level and continue in an upward direction. Similarly, if price approaches an Order Block from above, it is likely to bounce off this level and continue in a downward direction. Traders can use these levels to identify potential trade entries or exits, as well as to set stop-loss and take-profit levels.
Overall, the Fractal ROC , ATR Break, and Order Blocks indicator is a powerful tool for traders who want to identify potential trade opportunities and manage risk. By combining these three concepts, traders can gain a deeper understanding of market dynamics and make more informed trading decisions. As with any indicator, it is important to use it in conjunction with other analysis tools and to have a clear trading plan in place.
חפש סקריפטים עבור "Fractal"

BB ATR Fractal MMThe Bollinger Bands + ATR with Fractal indicator is a powerful combination of Bollinger Bands, ATR (Average True Range), and Fractal to help identify market volatility and potential entry/exit points on the chart.
Bollinger Bands help to assess the market’s volatility by calculating upper and lower bands based on the simple moving average (SMA) and standard deviation. It’s an excellent tool for identifying overbought and oversold conditions.
ATR (Average True Range) is used to measure market volatility. It helps determine how much the price is moving, and it can be used to adjust the Bollinger Bands, creating bands that reflect the current volatility more accurately.
Fractal helps to identify peaks and troughs in the market, supporting decision-making by highlighting potential reversal points. Fractals mark regions where price may reverse direction, making it easier to spot possible trade opportunities.
How to Use:
Bollinger Bands Upper and Lower Bands: These bands help to identify overbought or oversold conditions. If the price breaks above the upper band, the market may be overbought. If the price breaks below the lower band, the market may be oversold.
ATR: It indicates the volatility level of the market. When the market shows large volatility (ATR increases), the Bollinger Bands expand to reflect higher price swings.
Fractal: Arrows appear at the market’s peaks and troughs, helping identify entry points for buying (at fractal lows) or selling (at fractal highs). These signals can help you make trading decisions based on potential price reversals.

Williams Fractals for ExtremesThis script, written in Pine Script (version 5), implements an indicator for the automatic detection and visualization of fractal extremes on the price chart. The core algorithm is based on Bill Williams' fractal theory and identifies local highs and lows, which are often used to determine potential reversal points and support/resistance levels in the market.
### Key Features:
#### Fractal Detection:
- The indicator identifies a fractal high if the middle candle in a sequence of five candles (two on the left and two on the right) has the highest value.
- A fractal low is identified if the middle candle in the same type of five-candle sequence has the lowest value.
#### Extreme Visualization:
- Fractal highs are displayed as red dots on the chart, signaling potential local peaks.
- Fractal lows are shown as green dots, indicating local troughs.
### Usage:
- The indicator is designed for use across all timeframes and can be applied to both cryptocurrency and traditional financial markets.
- Highlighted points allow traders to quickly spot key levels, aiding in identifying potential zones for trade entry or exit.
### Application in Trading:
#### Identifying Key Levels:
- Fractal highs and lows can serve as resistance and support levels. A breakout beyond a fractal in either direction may signal a continuation of movement in that direction.
#### Finding Reversal Points:
- Fractal extremes indicate potential market reversals, making them useful in counter-trend trading strategies.
#### Adaptability to Market Conditions:
- The indicator updates dynamically with the appearance of new candles, providing traders with real-time fractal extreme levels.
### Settings and Parameters:
- In its current version, the script does not include customizable settings as it implements the standard concept of Williams' fractals.

Multi-Scale Adaptive MAs (Hurst, CVaR, Fractal) // AlgoFyreThe Multi-Scale Adaptive MAs (Hurst, CVaR, Fractal) indicator adjusts moving averages based on market conditions, using Hurst Exponent for trend persistence, CVaR for extreme risk assessment, and Fractal Dimension for market complexity. It enhances trend detection and risk management across various timeframes.
TABLE OF CONTENTS
🔶 ORIGINALITY 🔸Adaptive Mechanisms
🔸Multi-Faceted Analysis
🔸Versatility Across Timeframes
🔸Multi-Scale Combination
🔶 FUNCTIONALITY 🔸Hurst Exponent (H)
🞘 How it works
🞘 How to calculate
🞘 Code extract
🔸Conditional Value at Risk (CVaR)
🞘 How it works
🞘 How to calculate
🞘 Code extract
🔸Fractal Dimension (FD)
🞘 How it works
🞘 How to calculate
🞘 Code extract
🔶 INSTRUCTIONS 🔸Step-by-Step Guidelines
🞘 Setting Up the Indicator
🞘 Understanding What to Look For on the Chart
🞘 Possible Entry Signals
🞘 Possible Take Profit Strategies
🞘 Possible Stop-Loss Levels
🞘 Additional Tips
🔸Customize settings
🔶 CONCLUSION
▅▅▅▅▅▅▅▅▅▅▅▅▅▅▅▅▅▅▅▅▅▅▅▅▅▅▅▅▅▅▅▅▅▅▅▅▅▅▅▅▅▅▅▅▅▅
🔶 ORIGINALITY The Multi-Scale Adaptive MAs (Hurst, CVaR, Fractal) indicator stands out due to its unique approach of dynamically adjusting moving averages based on advanced statistical measures, making it highly responsive to varying market conditions. Unlike traditional moving averages that rely on static periods, this indicator adapts in real-time using three distinct adaptive methods: Hurst Exponent, CVaR, and Fractal Dimension.
🔸Adaptive Mechanisms
Traditional MA indicators use fixed lengths, which can lead to lagging signals or over-sensitivity in volatile markets. The Multi-Scale Adaptive MAs employ adaptive methods to adjust the MA length dynamically, providing a more accurate reflection of current market conditions.
🔸Multi-Faceted Analysis
By integrating Hurst Exponent, CVaR, and Fractal Dimension, the indicator offers a comprehensive market analysis. It captures different aspects of market behavior, including trend persistence, risk of extreme movements, and complexity, which are often missed by standard MAs.
🔸Versatility Across Timeframes
The indicator’s ability to switch between different adaptive methods based on market conditions allows traders to analyze short-term, medium-term, and long-term trends with enhanced precision.
🔸Multi-Scale Combination
Utilizing multiple adaptive MAs in combination provides a more nuanced view of the market, allowing traders to see how short, medium, and long-term trends interact. This layered approach helps in identifying the strength and consistency of trends across different scales, offering more reliable signals and aiding in complex decision-making processes. When combined, these MAs can also signal key market shifts when they converge or diverge, offering deeper insights than a single MA could provide.
🔶 FUNCTIONALITY The indicator adjusts moving averages based on a variety of different choosable adaptives. The Hurst Exponent to identify trend persistence or mean reversion, adapting to market conditions for both short-term and long-term trends. Using CVaR, it evaluates the risk of extreme price movements, ensuring the moving average is more conservative during high-risk periods, protecting against potential large losses. By incorporating the Fractal Dimension, the indicator adapts to market complexity, adjusting to varying levels of price roughness and volatility, which allows it to respond more accurately to different market structures and patterns.
Let's dive into the details:
🔸Hurst Exponent (H)
Measures the degree of trend persistence or mean reversion.
By using the Hurst Exponent, the indicator adjusts to capture the strength and duration of trends, helping traders to stay in profitable trades longer and avoid false reversals in ranging markets.
It enhances the detection of trends, making it suitable for both short-term scalping and identifying long-term trends.
🞘 How it works Rescaled Range (R/S) Analysis Calculate the mean of the closing prices over a set window.
Determine the deviation of each price from the mean.
Compute the cumulative sum of these deviations over the window.
Calculate the range (R) of the cumulative deviations (maximum minus minimum).
Compute the standard deviation (S) of the price series over the window.
Obtain the R/S ratio as R/S.
Linear Regression for Hurst Exponent Calculate the logarithm of multiple window sizes and their corresponding R/S values.
Use linear regression to determine the slope of the line fitting the log(R/S) against log(window size).
The slope of this line is an estimate of the Hurst Exponent.
🞘 How to calculate Range (R)
Calculate the maximum cumulative deviation:
R=max(sum(deviation))−min(sum(deviation))
Where deviation is the difference between each price and the mean.
Standard Deviation (S)
Calculate the standard deviation of the price series:
S=sqrt((1/(n−1))∗sum((Xi−mean)2))
Rescaled Range (R/S)
Divide the range by the standard deviation:
R/S=R/S
Hurst Exponent
Perform linear regression to estimate the slope of:
log(R/S) versus log(windowsize)
The slope of this line is the Hurst Exponent.
🞘 Code extract // Hurst Exponent
calc_hurst(source_, adaptive_window_) =>
window_sizes = array.from(adaptive_window_/10, adaptive_window_/5, adaptive_window_/2, adaptive_window_)
float hurst_exp = 0.5
// Calculate Hurst Exponent proxy
rs_list = array.new_float()
log_length_list = array.new_float()
for i = 0 to array.size(window_sizes) - 1
len = array.get(window_sizes, i)
// Ensure we have enough data
if bar_index >= len * 2
mean = adaptive_sma(source_, len)
dev = source_ - mean
// Calculate cumulative deviations over the window
cum_dev = ta.cum(dev) - ta.cum(dev )
r = ta.highest(cum_dev, len) - ta.lowest(cum_dev, len)
s = ta.stdev(source_, len)
if s != 0
rs = r / s
array.push(rs_list, math.log(rs))
array.push(log_length_list, math.log(len))
// Linear regression to estimate Hurst Exponent
n = array.size(log_length_list)
if n > 1
mean_x = array.sum(log_length_list) / n
mean_y = array.sum(rs_list) / n
sum_num = 0.0
sum_den = 0.0
for i = 0 to n - 1
x = array.get(log_length_list, i)
y = array.get(rs_list, i)
sum_num += (x - mean_x) * (y - mean_y)
sum_den += (x - mean_x) * (x - mean_x)
hurst_exp := sum_den != 0 ? sum_num / sum_den : 0.5
else
hurst_exp := 0.5 // Default to 0.5 if not enough data
hurst_exp
🔸Conditional Value at Risk (CVaR)
Assesses the risk of extreme losses by focusing on tail risk.
This method adjusts the moving average to account for market conditions where extreme price movements are likely, providing a more conservative approach during periods of high risk.
Traders benefit by better managing risk and avoiding major losses during volatile market conditions.
🞘 How it works Calculate Returns Determine the returns as the percentage change between consecutive closing prices over a specified window.
Percentile Calculation Identify the percentile threshold (e.g., the 5th percentile) for the worst returns in the dataset.
Average of Extreme Losses Calculate the average of all returns that are less than or equal to this percentile, representing the CVaR.
🞘 How to calculate Return Calculation
Calculate the return as the percentage change between consecutive prices:
Return = (Pt − Pt−1) / Pt−1
Where Pt is the price at time t.
Percentile Threshold
Identify the return value at the specified percentile (e.g., 5th percentile):
PercentileValue=percentile(returns,percentile_threshold)
CVaR Calculation
Compute the average of all returns below the percentile threshold:
CVaR = (1/n)∗sum(Return) for all Return≤PercentileValue
Where n is the total number of returns.
🞘 Code extract // Percentile
calc_percentile(data, percentile, window) =>
arr = array.new_float(0)
for i = 0 to window - 1
array.push(arr, data )
array.sort(arr)
index = math.floor(percentile / 100 * (window - 1))
array.get(arr, index)
// Conditional Value at Risk
calc_cvar(percentile_value, returns, window) =>
// Collect returns worse than the threshold
cvar_sum = 0.0
cvar_count = 0
for i = 0 to window - 1
ret = returns
if ret <= percentile_value
cvar_sum += ret
cvar_count += 1
// Calculate CVaR
cvar = cvar_count > 0 ? cvar_sum / cvar_count : 0.0
cvar
🔸Fractal Dimension (FD)
Evaluates market complexity and roughness by analyzing how price movements behave across different scales.
It enables the moving average to adapt based on the level of market noise or structure, allowing for smoother MAs during complex, volatile periods and more sensitive MAs during clear trends.
This adaptability is crucial for traders dealing with varying market states, improving the indicator's responsiveness to price changes.
🞘 How it works Total Distance (L) Calculation Sum the absolute price movements between consecutive periods over a given window.
Maximum Distance (D) Calculation Calculate the maximum displacement from the first to the last price point within the window.
Calculate Fractal Dimension Use Katz's method to estimate the Fractal Dimension as the ratio of the logarithms of L and D, divided by the logarithm of the number of steps (N).
🞘 How to calculate Total Distance (L)
Sum the absolute price changes over the window:
L=sum(abs(Pt−Pt−1)) for t from 2 to n
Where Pt is the price at time t.
Maximum Distance (D)
Find the maximum absolute displacement from the first to the last price in the window:
D=max(abs(Pn-P1))
Fractal Dimension Calculation
Use Katz's method to estimate fractal dimension:
FD=log(L/D)/log(N)
Where N is the number of steps in the window.
🞘 Code extract // Fractal Dimension
calc_fractal(source_, adaptive_window_) =>
// Calculate the total distance (L) traveled by the price
L = 0.0
for i = 1 to adaptive_window_
L += math.abs(source_ - source_ )
// Calculate the maximum distance between first and last price
D = math.max(math.abs(source_ - source_ ), 1e-10) // Avoid division by zero
// Calculate the number of steps (N)
N = adaptive_window_
// Estimate the Fractal Dimension using Katz's formula
math.log(L / D) / math.log(N)
🔶 INSTRUCTIONS The Multi-Scale Adaptive MAs indicator can be set up by adding it to your TradingView chart and configuring the adaptive method (Hurst, CVaR, or Fractal) to match current market conditions. Look for price crossovers and changes in the slope for potential entry signals. Set take profit and stop-loss levels based on dynamic changes in the moving average, and consider combining it with other indicators for confirmation. Adjust settings and use adaptive strategies for enhanced trend detection and risk management.
🔸Step-by-Step Guidelines 🞘 Setting Up the Indicator Adding the Indicator to the Chart: Go to your TradingView chart.
Click on the "Indicators" button at the top.
Search for "Multi-Scale Adaptive MAs (Hurst, CVaR, Fractal)" in the indicators list.
Click on the indicator to add it to your chart.
Configuring the Indicator: Open the indicator settings by clicking on the gear icon next to its name on the chart.
Adaptive Method: Choose between "Hurst," "CVaR," and "Fractal" depending on the market condition and your trading style.
Length: Set the base length for the moving average (e.g., 20, 50, or 100). This length will be adjusted dynamically based on the selected adaptive method.
Other Parameters: Adjust any other parameters as needed, such as window sizes or scaling factors specific to each adaptive method.
Chart Setup: Ensure you have an appropriate timeframe selected (e.g., 1-hour, 4-hour, daily) based on your trading strategy.
Consider using additional indicators like volume or RSI to confirm signals.
🞘 Understanding What to Look For on the Chart Indicator Behavior: Observe how the adaptive moving average (AMA) behaves compared to standard moving averages, e.g. notice how it might change direction with strength (Hurst).
For example, the AMA may become smoother during high market volatility (CVaR) or more responsive during strong trends (Hurst).
Crossovers: Look for crossovers between the price and the adaptive moving average.
A bullish crossover occurs when the price crosses above the AMA, suggesting a potential uptrend.
A bearish crossover occurs when the price crosses below the AMA, indicating a possible downtrend.
Slope and Direction: Pay attention to the slope of the AMA. A rising slope suggests a bullish trend, while a declining slope indicates a bearish trend.
The slope’s steepness can give you clues about the trend's strength.
🞘 Possible Entry Signals Bullish Entry: Crossover Entry: Enter a long position when the price crosses above the AMA and the AMA has a positive slope.
Confirmation Entry: Combine the crossover with other indicators like RSI (above 50) or increasing volume for confirmation.
Bearish Entry: Crossover Entry: Enter a short position when the price crosses below the AMA and the AMA has a negative slope.
Confirmation Entry: Use additional indicators like RSI (below 50) or decreasing volume to confirm the bearish trend.
Adaptive Method Confirmation: Hurst: Enter when the AMA indicates a strong trend (steeper slope). Suitable for trend-following strategies.
CVaR: Be cautious during high-risk periods. Enter only if confirmed by other indicators, as the AMA may become more conservative.
Fractal: Ideal for capturing reversals in complex markets. Look for crossovers in volatile markets.
🞘 Possible Take Profit Strategies Static Take Profit Levels: Set take profit levels based on predefined ratios (e.g., 1:2 or 1:3 risk-reward ratio).
Place take profit orders at recent swing highs (for long positions) or swing lows (for short positions).
Trailing Stop Loss: Use a trailing stop based on a percentage of the AMA value to lock in profits as the trend progresses.
Adjust the trailing stop dynamically to follow the AMA, allowing profits to run while protecting gains.
Adaptive Method Based Exits: Hurst: Exit when the AMA begins to flatten or turn in the opposite direction, signaling a potential trend reversal.
CVaR: Consider taking profits earlier during high-risk periods when the AMA suggests caution.
Fractal: Use the AMA to exit in complex markets when it smooths out, indicating reduced volatility.
🞘 Possible Stop-Loss Levels Initial Stop Loss: Place an initial stop loss below the AMA (for long positions) or above the AMA (for short positions) to protect against adverse movements.
Use a buffer (e.g., ATR value) to avoid being stopped out by normal price fluctuations.
Adaptive Stop Loss: Adjust the stop loss dynamically based on the AMA. Move the stop loss along the AMA as the trend progresses to minimize risk.
This helps in adapting to changing market conditions and avoiding premature exits.
Adaptive Method-Specific Stop Loss: Hurst: Use wider stops during trending markets to allow for minor pullbacks.
CVaR: Adjust stops in high-risk periods to avoid being stopped out prematurely during price fluctuations.
Fractal: Place stops at recent support/resistance levels in highly volatile markets.
🞘 Additional Tips Combine with Other Indicators: Enhance your strategy by combining the AMA with other technical indicators like MACD, RSI, or Bollinger Bands for better signal confirmation.
Backtesting and Practice: Backtest the indicator on historical data to understand how it performs in different market conditions.
Practice using the indicator on a demo account before applying it to live trading.
Market Awareness: Always be aware of market conditions and fundamental events that might impact price movements, as the AMA reacts to price action and may not account for sudden news-driven events.
🔸Customize settings 🞘 Time Override: Enables or disables the ability to override the default time frame for the moving averages. When enabled, you can specify a custom time frame for the calculations.
🞘 Time: Specifies the custom time frame to use when the Time Override setting is enabled.
🞘 Enable MA: Enables or disables the moving average. When disabled, MA will not be displayed on the chart.
🞘 Show Smoothing Line: Enables or disables the display of a smoothing line for the moving average. The smoothing line helps to reduce noise and provide a clearer trend.
🞘 Show as Horizontal Line: Displays the moving average as a horizontal line instead of a dynamic line that follows the price.
🞘 Source: Specifies the data source for the moving average calculation (e.g., close, open, high, low).
🞘 Length: Sets the period length for the moving average. A longer length will result in a smoother moving average, while a shorter length will make it more responsive to price changes.
🞘 Time: Specifies a custom time frame for the moving average, overriding the default time frame if Time Override is enabled.
🞘 Method: Selects the calculation method for the moving average (e.g., SMA, EMA, SMMA, WMA, VWMA).
🞘 Offset: Shifts the moving average forward or backward by the specified number of bars.
🞘 Color: Sets the color for the moving average line.
🞘 Adaptive Method: Selects the adaptive method to dynamically adjust the moving average based on market conditions (e.g., Hurst, CVaR, Fractal).
🞘 Window Size: Sets the window size for the adaptive method, determining how much historical data is used for the calculation.
🞘 CVaR Scaling Factor: Adjusts the influence of CVaR on the moving average length, controlling how much the length changes based on calculated risk.
🞘 CVaR Risk: Specifies the percentile cutoff for the worst-case returns used in the CVaR calculation to assess extreme losses.
🞘 Smoothing Method: Selects the method for smoothing the moving average (e.g., SMA, EMA, SMMA, WMA, VWMA).
🞘 Smoothing Length: Sets the period length for smoothing the moving average.
🞘 Fill Color to Smoothing Moving Average: Enables or disables the color fill between the moving average and its smoothing line.
🞘 Transparency: Sets the transparency level for the color fill between the moving average and its smoothing line.
🞘 Show Label: Enables or disables the display of a label for the moving average on the chart.
🞘 Show Label for Smoothing: Enables or disables the display of a label for the smoothing line of the moving average on the chart.
🔶 CONCLUSION The Multi-Scale Adaptive MAs indicator offers a sophisticated approach to trend analysis and risk management by dynamically adjusting moving averages based on Hurst Exponent, CVaR, and Fractal Dimension. This adaptability allows traders to respond more effectively to varying market conditions, capturing trends and managing risks with greater precision. By incorporating advanced statistical measures, the indicator goes beyond traditional moving averages, providing a nuanced and versatile tool for both short-term and long-term trading strategies. Its unique ability to reflect market complexity and extreme risks makes it an invaluable asset for traders seeking a deeper understanding of market dynamics.

Synthesis DeFi - Fractals - Daily - v7.0This is a free trial version of SynthesisDeFi.com fractals.
A simplified fractal analysis indicator that identifies key market structure points on daily timeframes. This tool automatically detects trend reversals and plots fractal highs and lows with connecting lines, helping traders visualize major support and resistance levels
Why use Synthesis DeFi fractals?
Harmonic Patterns
Wycoff
Elliot Waves
Dow Theory
Created by Oliver Fujimori | SynthesisDeFi.com
Perfect for swing traders and position traders focused on daily market structure analysis

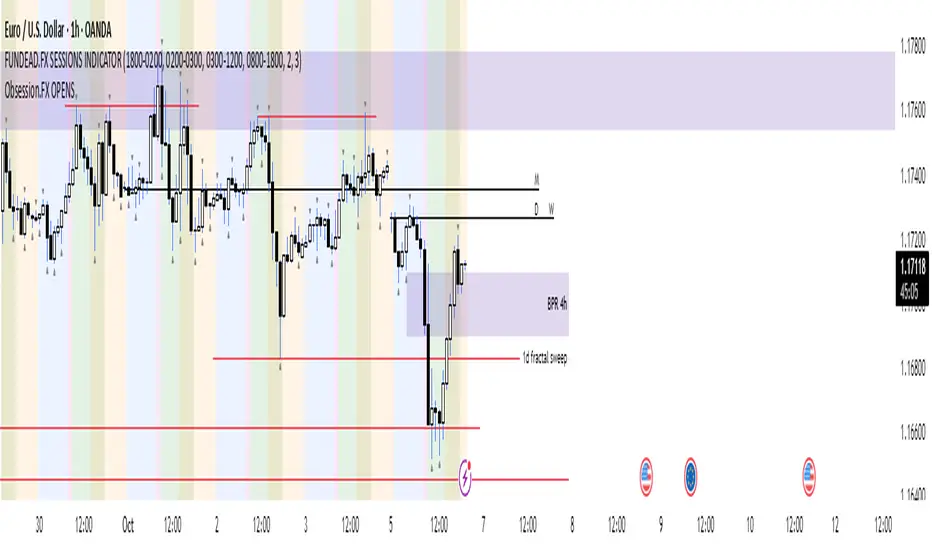
Obsession.FX Sessions IndicatorSession & Fractal Structure Tool — for Market Phases and Microstructure Analysis
This script combines session timeframes with local fractal identification to help traders analyze market context and structural shifts. It is designed for those applying Smart Money Concepts, where precise session boundaries and reactions to key levels are critical.
Session Zones
The script visualizes the three main trading sessions: Asia, London, and New York. It helps to:
– identify active phases of market participation;
– track each session’s Highs and Lows;
– interpret price behavior in relation to intraday liquidity shifts.
Each session is fully customizable — including start/end time, background and border colors, and display style (box, high/low lines, filled zones).
Fractal Structure
Fractals are shown as local highs and lows, supporting:
– detection of BOS/CHOCH on lower timeframes;
– building A→B ranges for structural flow;
– confirming short-term directional changes.
The fractal algorithm is optimized for responsiveness and clarity, with no repainting and minimal delay.
Purpose and Usage
This tool is intended for contextual reading of price action: determining the active session and monitoring price behavior within its boundaries, with a focus on microstructural reactions. It supports building precise entry logic based on the interaction between session ranges and fractal structure.
Closed Source Justification
The script is closed-source due to its use of proprietary logic for fractal detection and session integration, developed as part of a private trading methodology not available in public libraries.
Eliza Ellis Improved FractalsA little side project of mine. may enhance further in the future. Used best for scalping. The longer you're in the market the more the news is waiting to eat you so I'd recommend using high volume and getting in and out quickly

DR/IDR, fractals, break + EMA Clouds + VWAPThis indicator is a powerful, multi-layered trading tool that combines three distinct forms of market analysis—volume, trend, and opening volatility—onto a single chart.
1. Opening Range Breakout (ORB) System
This is the foundation of the indicator, designed to capture the initial volatility and set key price boundaries for the trading day.
Time Focus: The indicator's primary analysis is centered on a specific, user-defined time period (default is 9:30 AM to 10:30 AM New York Time). Nothing related to the ORB drawing will appear on the chart before this session starts.
Wick High/Low (The Trigger): These lines track the absolute highest and lowest prices reached during the time window. They define the full extent of the initial range and are used to determine when a genuine breakout occurs.
Body High/Low (The Range & Targets): These lines track the highest and lowest open/close prices of the candles within the session. This area forms the central, shaded zone, representing the core consolidation area.
Range Shading: The background between the Body High and Body Low is shaded, but this visual feature only appears during the active forming time window (e.g., 9:30 AM to 10:30 AM) to maintain chart clarity.
Fractals: While the range is forming, the indicator detects 5-bar Williams Fractal patterns that occur inside the range. These small triangles (▲ or ▼) highlight minor reversal points established by the early trading action.
Breakout Signal: After the user-defined time window closes, the indicator waits. If a subsequent candle's price moves above the Wick High or below the Wick Low, a "BREAK" label is displayed on that candle. It is programmed to label only the first decisive break in each direction per day.
Extension Targets: When a breakout occurs, target lines are automatically projected above the Body High (for a bullish break) or below the Body Low (for a bearish break). The distance between these targets is calculated based on a user-defined fraction (e.g., 0.5 steps) of the total height of the Body Range.
Line Cutoff: For tidiness, you can set a "Stop Time" (e.g., 4:00 PM) after which the ORB lines will automatically disappear.
2. EMA Clouds (Trend and Momentum)
Four distinct Exponential Moving Average (EMA) clouds are plotted to provide a dynamic, multi-speed view of the market's trend and momentum.
Structure: Each "Cloud" is the shaded area between two EMAs (one shorter length and one longer length). The indicator includes four customizable pairs (defaulting to common settings like 8/9, 8/14, 34/50, and 14/21).
Trend Coloring: The clouds are color-coded:
Bullish (Greenish): The shorter EMA is trading above the longer EMA, signaling upward momentum.
Bearish (Reddish): The shorter EMA is trading below the longer EMA, signaling downward momentum.
Application: These clouds are used to confirm the overall market direction or identify potential zones of support and resistance.
3. Volume-Weighted Average Price (VWAP)
The VWAP is a crucial anchor for measuring the market's efficiency throughout the trading day.
Function: It calculates the average price of the asset, giving more weight to prices where higher volume was traded.
Context: It helps traders quickly determine if the current price is trading at a premium (above VWAP) or a discount (below VWAP) relative to the day's volume.
Reset: The VWAP line automatically resets at the beginning of each trading day.
Customization: The VWAP line can be toggled on or off, and its color and width are fully adjustable.

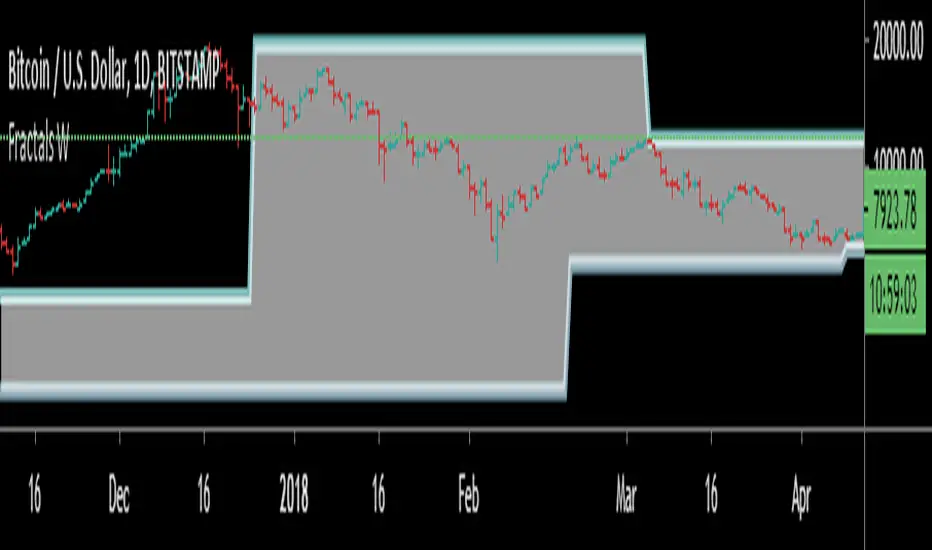
Williams FractalsThis script shows the channel identified by the most recent up and down fractals. When there is a fractal break, the chance of having an impulsive move is much higher than when we are in the fractal range. This script uses the weekly timeframe for fractal identification, but can be applied to any lower timeframes.
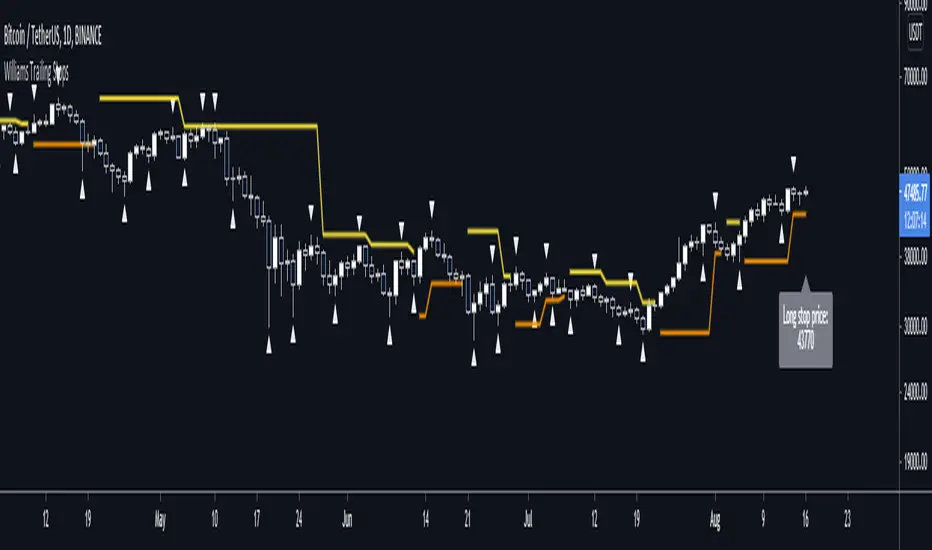
Williams Fractal Trailing StopsUnlike the built-in version, you can configure how many bars it takes to confirm a fractal. This indicator plots all Williams high and low fractals, and a stop line that trails the fractals up and down. Includes long and short stop alerts. You can choose whether the trail flips long-short based on the price being exceeded within a candle or on candle close. This indicator deals only with fractals and doesn't get into the Alligator or anything else.
I've commented it extensively, so that it might be useful for people learning Pinescript. Enjoy!
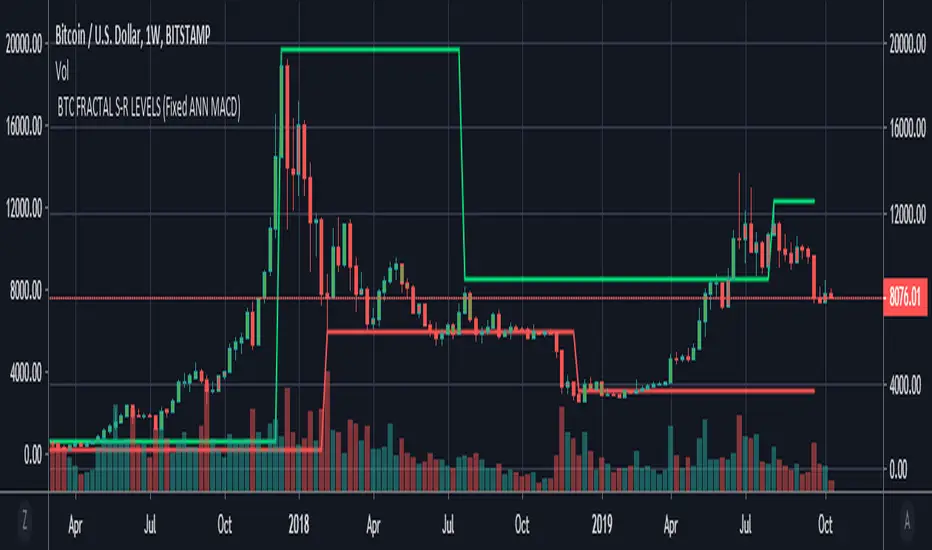
BTC FRACTAL ANN S-R LEVELS (Fixed ANN MACD)
This script is an adaptation of my deep learning system for Bitcoin to fractals.
Fractal codes are not belong to me. Original :
The code for the Deep learning (ANN MACD BTC) work belongs to me. Original:
I didn't get license for this script because the fractal codes don't belong to me.You can use it for any purpose.
This command can be a very helpful guide.You can use that fractals with your indicators for Bitcoin.
You can also combine these levels with ANN - MACD - BTC script.
Scripts about Artificial Neural Networks (ANN) will continue soon !
I hope it will help us to gain insight into technical analysis.
Best regards. Noldo.
[_ParkF]FractalTop gray line is the fractal resistance.
Bottom gray line is the fractal support.
Central red line is the average of the top&bottom fractal.
Fractals can be displayed as support and resistance, and the red fractal average line indicates a trend.
상단 회색선은 프랙탈 저항,
하단 회색선은 프랙탈 지지,
중앙 빨간선은 프랙탈 상,하단의 평균,
프랙탈은 지지와 저항으로 표시되고 빨간색 프랙탈 평균선은 추세입니다.

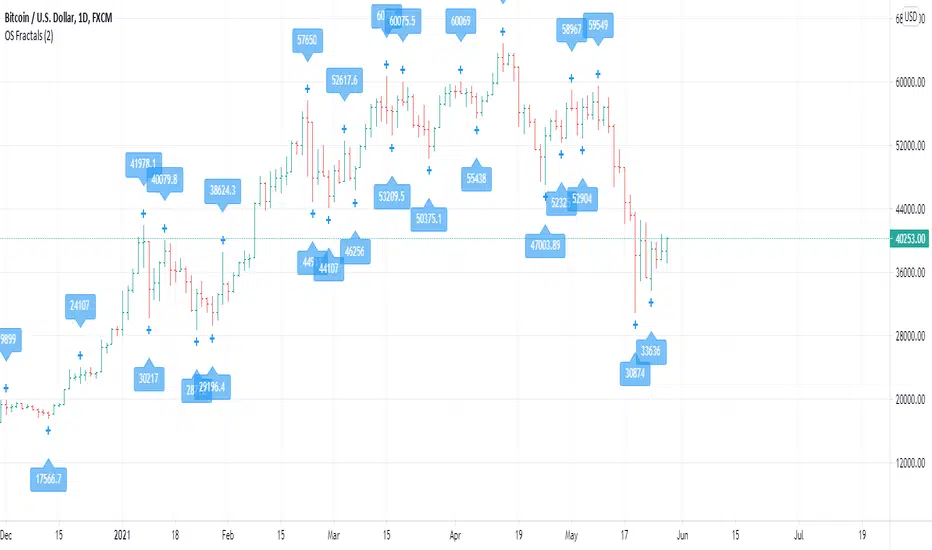
OS FractalsAn up fractal is formed when a high is both preceded and followed by lower highs. A down fractal is formed when a low is both preceded and followed by higher lows.
Bill Williams uses a period of 2 (2 after and 2 before) to define a fractal. This indicator has 2 as default but lets you decide the range you want.
The indicator lets you also select alerts when price crosses an up of down fractal, which would usually mean to entry a position. This indicator works best when used with an alligator, as long signals are valid above the Balance Line and short signals are valid when triggered below the Balance Line.
Any comments for improvement are welcome.
Power of Three FractalsIntroducing Power of Three Fractals—an advanced, all-in-one TradingView toolkit designed to bring higher timeframe context directly onto your primary chart. This isn't just another candle overlay; it's a sophisticated analytical suite built for the serious price action trader. Developed with the core principles of "smart money" concepts, this indicator helps you see the market in a new dimension.
Key Features:
Floating Candlestick Display:
Forget cluttered chart backgrounds. Power of Three Fractals displays your chosen higher timeframe candles as a clean, stylized series of candlesticks in a dedicated space on the right side of your chart, allowing you to analyze HTF structure without losing focus on live price action.
Intelligent Adaptive Timeframe:
This is a game-changer. If you set the indicator to show 4H candles but switch your main chart to the Daily, it won't produce an error. Instead, it automatically adapts, recognizing the invalid selection and seamlessly switching to display the next logical timeframe (e.g., Weekly candles). This provides a flawless analytical experience as you move through timeframes.
Precision High/Low Anchors:
Dotted Lines: Instantly see which lower timeframe (LTF) candle created the high and low of the current HTF candle. This is perfect for visualizing manipulation wicks and the true Power of Three delivery.
Solid Lines: Automatically identify the absolute highest high and lowest low across the entire displayed range of HTF candles. The script then draws a solid line back to the exact LTF candle that formed these critical points, defining your true trading range. This feature intelligently hides itself if the current candle is making the high/low to avoid unnecessary clutter.
Automated Liquidity Sweep Detection:
This powerful, built-in algorithm automatically identifies one of the most critical price action events: a liquidity sweep. When a newer HTF candle takes the low of the oldest displayed candle and then closes back above it, the indicator instantly alerts you.
It draws a dashed line from the initial low to the end of the range and places a bold 'x' marker below the specific candle that performed the sweep, giving you a clear, unmissable signal of this key market event.
Integrated HTF Countdown Timer:
Stay perfectly in sync with the market. A clean, floating timer in the bottom-right corner displays a live countdown to the close of your selected higher timeframe candle, complete with a header so you always know which timeframe you're tracking.
Fully Customizable Aesthetics:
Tailor the indicator to your personal chart theme. You have full control over the colors of bullish/bearish candles, wicks, and all connecting lines, allowing for a seamless visual integration.
Who Is This Indicator For?
The Power of Three Fractals indicator is built for the discerning trader who understands that context is key. It is ideal for:
Day Traders & Scalpers needing constant awareness of higher timeframe control.
Swing Traders looking to time entries based on HTF structure and LTF shifts.
Price Action & "Smart Money Concept" Traders who utilize concepts like liquidity sweeps, order blocks, and fractals.
What You Get:
Access to the Power of Three Fractals indicator on TradingView.
All future updates, bug fixes, and feature enhancements.
Stop trading in the dark. Elevate your analysis, gain a critical edge, and make more informed trading decisions with the Power of Three Fractals indicator.
Disclaimer: The Power of Three Fractals is an analytical tool and should not be considered financial advice or a signal service. All trading involves risk, and past performance is not indicative of future results. Please use this tool as part of a comprehensive trading plan with proper risk management.

A Better Fractal (Williams)DESCRIPTION:
This is a more advanced version of the classic Williams Fractal algo, using a looped barindex iterator to examine highs/lows.
You may choose ideal or regular fractals, along with the amount of bars (periods) used to calculate; the minimum being 3. Oddnums only.
Ideal fractals = fractals with each bar needing to be lower/higher than the preceding bar, with the midbar at the apex.
Regular fractals = the typical Williams fractal, wherein each bar only has to be lower/higher than the midbar (apex) only.
How to trade? Combine with other indicators and use breakout or reversal strategies, typically. Set buy/sell stops at the high/low of a fractal, for instance
... to trade the breakout when it occurs. Or, track momentum when a fractal prints and trade accordingly. Or perhaps trade with the alligator or 3 EMA.
Experiment with different types of fractals to achieve the desired result, with higher period fractals obviously offering more solid indication though with higher lag.
Note: A fractal does not print until n/2 (rounded down) bars after, where n = the period you chose.

Brandon FractalsCustom Indicator developed for a Backtest-Rookies customer. Published for verification and acceptance
Dual Fractal indicator. Display fractals from an upper timeframe and provide alerts when price breaks above/below the upper timeframe fractal.

Smart Money Concepts (SMC)Introductions:
Before explaining the functions of this indicator to you, we need to talk about what theoretical knowledge we need to have. Many different price approaches have been developed over the decades with different analysis methods and are still evolving. Some theories used in classical trend analysis methods are interpreted or blended with different perspectives over time and we try to make more successful analyses by having a consistent market reading strategy. While analyzing the classical market structure with the price action method, some issues that are missing and do not fit into place are brought to light with a higher level analysis method known as the smart money concept.
As a result of the research and developments we have done on this subject from many different sources for a long time, I personally think that the most efficient and logical concept is the smart money concept. Of course, no matter which method we use, acting within a risk management and remaining strictly loyal to our conditions should be our first priority so that we can talk about sustainable success in the market. In light of all this, we decided to make an indicator of this concept, which we believe is consistent.
In order to analyze the market structure correctly, we must first draw fractal structures and interpret them correctly. Because the market consists of fractal structures. Regardless of the technique, if we cannot draw fractals correctly or if we make an incorrect interpretation while determining them, our market structure analysis may also be incorrect.
Instead of manually identifying fractal structures, script writers often choose the following method for ease of use; They leave the number of candles to the user's choice, detect the highest and lowest points among x number of candles, and draw fractal structures accordingly, but in fact this is not an accurate detection method. In the visual I have prepared below, you can see how the correct fractal structures should be drawn. Fractal structures should be made based on the previous and next candle levels, not from a certain group of candles.
To identify market structures, we make an interpretation based on these fractal movements.
While classic market structure analysis with traditional price action follows a relatively simpler path as shown in the example below, this situation is a bit more detailed in the smart money concepts.
To explain the situation in the smart money concept in an easily understandable way, it is as follows; imagine an uptrend that progresses by creating levels HH and HL, when the price creates a new HL, we call this point as inducement and we move this level up as each new HL is formed. When drawing structures in this way, when the price falls below the inducement level, the peak is confirmed. To explain it with a different approach, the price must first get liquidity from these last rising bottoms in order to make a break of structure (BOS). The break of structure occurs when the price passes the approved peak. When BOS occurs, the lowest point between this point and the previous peak is defined as the Swing Low and this is the level that needs to be protected in uptrend. When BOS occurs, the last HL point that made this BOS is also defined as inducement and it continues to move as new HL is formed until the new peak is confirmed. If the price somehow "closes" below the Swing Low point that needs to be protected, CHOCH (change of character) has occurred and the trend direction has changed. After CHOCH, we start applying the same logic for the downtrend, the last LH peak formed after is defined as inducement and as the fractal structure continues downward, this level is also carried as the inducement level until the Swing Low level is determined. An important note is; In order for BOS and CHOCH to be valid, "a closing must definitely occur". If it remains in the form of a wick, we call it a liquidity sweep and the end point of this wick is updated as the point where we need to look for a closing in order to be able to say that the BOS or CHOCH level is determined. By the way, We call these liquidity sweep points as "x" in the indicator.
It may be easier to explain this topic with a few sample images that I have shared below.
The thing to consider in the smart money concept is that if you are going to take a long trade in an uptrend, you should wait for the price to fall below the inducement level or if you are going to take a short trade in a downtrend, you should wait for the price to rise above the inducement level and only then look for suitable structures, order flows, order blocks, price gaps and other structures before this are considered traps in this concept. I have some strategies that I personally apply, but since these are my personal preferences, I do not find it right to share them here in order not to affect your opinions, but I am basically careful to act as I stated above.
While preparing this script, we paid attention to the fact that it can be interpreted with a real human eye, provides ease at the speed of machine language and can work extremely flawlessly.
From the first moment we started preparing the script, we went through a long and seriously laborious preparation process that lasted months until now, which we happily share.
We brought this code to life by putting on the table almost everything the user may want in terms of both flawlessly fulfilling the conditions specified by the concept and convenience.
If we touch on the function of the code in order, our code finds the following;
It perfectly identifies the fractals that form the basis of the market structure, within the framework of the rules that I mentioned above, we taught to the script.
According to smart money concepts, as I explained in detail above, it provides great convenience in this regard by skillfully identifying the direction of the market in the time period you are in, rather than traditional methods.
In addition to identifying the direction of the market, it also detects the direction changes taking place in the internal structure. Indicator tries to detect even the slightest direction changes by making a stricter interpretation while determining the trend and bottom-top points in the internal structure. Theoretically, it determines the top point in a downward fractal breakout, and marks the bottom point in an upward fractal breakout.
In this context, it also uniquely identifies the candle flow direction and we can observe it on the table. I explained this issue in the first image about fractal determination, you can read that part again.
When you identify swing structures correctly, you will also determine the area you need to focus on, and we have also included this in the script.
Another one of our favorite features on the chart is that it can show active swing areas live by following the BOS, CHOCH and Inducement lines. So, I believe that this gives it a more professional appearance.
In the light of all these functions, it provides great ease of use while presenting data on the direction of the market in a table not only in the current time frame but also in 6 different time frames that the user can choose according to his/her preference, including seconds timeframes (1 sec., 5 sec., 15 sec., 30 sec. etc.)
In order to speed up the user, it instantly informs the selected parity and all structural changes (Bos, Choch, Inducement, Liquidity Sweeps etc.) that occur on the market structure of this timeframe by setting a single alarm.
In the settings window, you will find the following settings that we have personalized for you:
Main Options;
Fractal Lines box: You can check this box to see whether the fractals that form the basic interpretation structure of the indicator are visible or not.
Swing Lines box: You can use this box to turn on or off the Bos, Choch, Inducement and Liquidity Sweeps lines, which are the main elements of the market structure.
Internal Structures box: You can check this box to observe the H and L points in the internal structure of the graph and therefore the direction in the internal structure.
Live Bos / Choch / Inducement Lines box: You can turn on / off the visibility of the lines belonging to the current and active Bos, Choch and Inducement levels on the chart.
Range Lines box: You can use it to turn on / off the visibility of range lines drawn between the active Swing high and Swing low points on the chart.
Multitimeframe Tables box: It allows you to open and close the table where you can observe the main trend direction of the current parity on the screen, its internal structure and the candle flow direction in 6 different time frames.
Fractal Settings;
In this section, you can choose the colors, style and thickness of the fractal lines as you wish.
Swing Settings;
In this section you can choose the colors of the Swing High and Swing Low points, their shape and size.
Likewise, you can choose the colors, line style, thickness and text size of Bos and Choch lines for bullish and bearish situations.
There are also settings where you can choose the colors, style, line thickness and text size of the Liquidity Sweep and Inducement lines.
Internal Swing Settings;
In this section, you can determine the colors of the High and Low points detected in the internal structure and select the label size, style and thickness of the direction change lines.
Live BOS / CHOCH / IDM Lines;
In this section, you can select the colors, label sizes, line style and thickness of the bos, choch and inducement lines that show the important levels followed in the current status of the chart.
Range Settings;
As mentioned above, you can choose the color, style, thickness of the range lines drawn between the active swing high and swing low points and the size of the price tags of these levels.
Multitimeframe Table Settings;
In this section, there are settings boxes for 6 selectable timeframes, 9 different position alternatives where you can change the position of the table, and a section where you can find 2 different options to express the directions in the table. In addition to these, you will also be able to choose the background color of the table and the color of the text used to express the directions in the table.
We hope that this script will reach a wide audience by becoming a tool that will be used with pleasure and indispensable, while providing convenience to all users, as we have dreamed of and expected from the first moment we started writing it.
DISCLAIMER: No sharing, copying, reselling, modifying, or any other forms of use are authorized for the documents, script / strategy, and the information published with them. This informational planning script / strategy is strictly for individual use and educational purposes only. This is not financial or investment advice. Investments are always made at your own risk and are based on your personal judgement. We are not responsible for any losses you may incur. Please invest wisely.
Best regards and enjoy it.

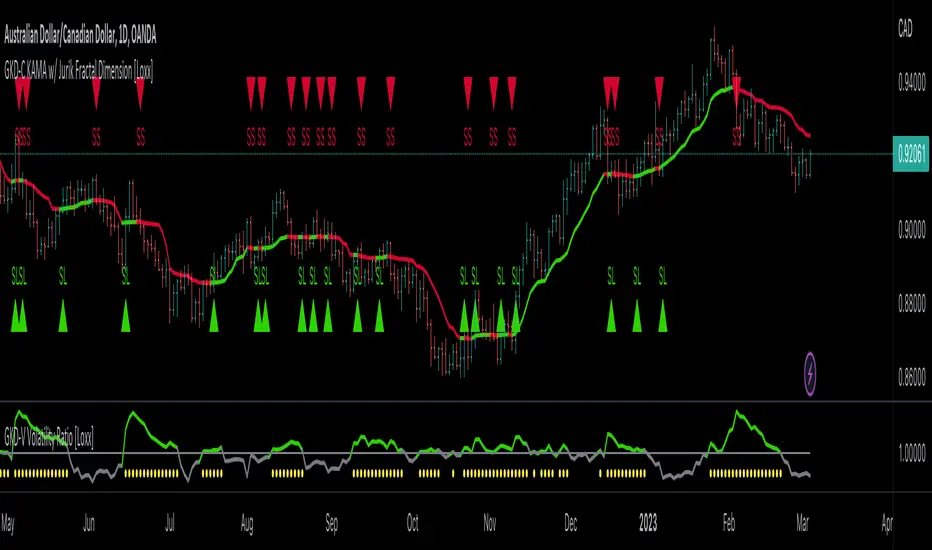
GKD-C KAMA w/ Jurik Fractal Dimension [Loxx]Giga Kaleidoscope KAMA w/ Jurik Fractal Dimension is a Confirmation module included in Loxx's "Giga Kaleidoscope Modularized Trading System".
█ Giga Kaleidoscope Modularized Trading System
What is Loxx's "Giga Kaleidoscope Modularized Trading System"?
The Giga Kaleidoscope Modularized Trading System is a trading system built on the philosophy of the NNFX (No Nonsense Forex) algorithmic trading.
What is an NNFX algorithmic trading strategy?
The NNFX algorithm is built on the principles of trend, momentum, and volatility. There are six core components in the NNFX trading algorithm:
1. Volatility - price volatility; e.g., Average True Range, True Range Double, Close-to-Close, etc.
2. Baseline - a moving average to identify price trend
3. Confirmation 1 - a technical indicator used to identify trends
4. Confirmation 2 - a technical indicator used to identify trends
5. Continuation - a technical indicator used to identify trends
6. Volatility/Volume - a technical indicator used to identify volatility/volume breakouts/breakdown
7. Exit - a technical indicator used to determine when a trend is exhausted
How does Loxx's GKD (Giga Kaleidoscope Modularized Trading System) implement the NNFX algorithm outlined above?
Loxx's GKD v1.0 system has five types of modules (indicators/strategies). These modules are:
1. GKD-BT - Backtesting module (Volatility, Number 1 in the NNFX algorithm)
2. GKD-B - Baseline module (Baseline and Volatility/Volume, Numbers 1 and 2 in the NNFX algorithm)
3. GKD-C - Confirmation 1/2 and Continuation module (Confirmation 1/2 and Continuation, Numbers 3, 4, and 5 in the NNFX algorithm)
4. GKD-V - Volatility/Volume module (Confirmation 1/2, Number 6 in the NNFX algorithm)
5. GKD-E - Exit module (Exit, Number 7 in the NNFX algorithm)
(additional module types will added in future releases)
Each module interacts with every module by passing data between modules. Data is passed between each module as described below:
GKD-B => GKD-V => GKD-C(1) => GKD-C(2) => GKD-C(Continuation) => GKD-E => GKD-BT
That is, the Baseline indicator passes its data to Volatility/Volume. The Volatility/Volume indicator passes its values to the Confirmation 1 indicator. The Confirmation 1 indicator passes its values to the Confirmation 2 indicator. The Confirmation 2 indicator passes its values to the Continuation indicator. The Continuation indicator passes its values to the Exit indicator, and finally, the Exit indicator passes its values to the Backtest strategy.
This chaining of indicators requires that each module conform to Loxx's GKD protocol, therefore allowing for the testing of every possible combination of technical indicators that make up the six components of the NNFX algorithm.
What does the application of the GKD trading system look like?
Example trading system:
Backtest: Strategy with 1-3 take profits, trailing stop loss, multiple types of PnL volatility, and 2 backtesting styles
Baseline: Hull Moving Average
Volatility/Volume: Volatility Ratio as shown on the chart above
Confirmation 1: KAMA w/ Jurik Fractal Dimension as shown on the chart above
Confirmation 2: Williams Percent Range
Continuation: Fisher Transform
Exit: Rex Oscillator
Each GKD indicator is denoted with a module identifier of either: GKD-BT, GKD-B, GKD-C, GKD-V, or GKD-E. This allows traders to understand to which module each indicator belongs and where each indicator fits into the GKD protocol chain.
Giga Kaleidoscope Modularized Trading System Signals (based on the NNFX algorithm)
Standard Entry
1. GKD-C Confirmation 1 Signal
2. GKD-B Baseline agrees
3. Price is within a range of 0.2x Volatility and 1.0x Volatility of the Goldie Locks Mean
4. GKD-C Confirmation 2 agrees
5. GKD-V Volatility/Volume agrees
Baseline Entry
1. GKD-B Baseline signal
2. GKD-C Confirmation 1 agrees
3. Price is within a range of 0.2x Volatility and 1.0x Volatility of the Goldie Locks Mean
4. GKD-C Confirmation 2 agrees
5. GKD-V Volatility/Volume agrees
6. GKD-C Confirmation 1 signal was less than 7 candles prior
Continuation Entry
1. Standard Entry, Baseline Entry, or Pullback; entry triggered previously
2. GKD-B Baseline hasn't crossed since entry signal trigger
3. GKD-C Confirmation Continuation Indicator signals
4. GKD-C Confirmation 1 agrees
5. GKD-B Baseline agrees
6. GKD-C Confirmation 2 agrees
1-Candle Rule Standard Entry
1. GKD-C Confirmation 1 signal
2. GKD-B Baseline agrees
3. Price is within a range of 0.2x Volatility and 1.0x Volatility of the Goldie Locks Mean
Next Candle:
1. Price retraced (Long: close < close or Short: close > close )
2. GKD-B Baseline agrees
3. GKD-C Confirmation 1 agrees
4. GKD-C Confirmation 2 agrees
5. GKD-V Volatility/Volume agrees
1-Candle Rule Baseline Entry
1. GKD-B Baseline signal
2. GKD-C Confirmation 1 agrees
3. Price is within a range of 0.2x Volatility and 1.0x Volatility of the Goldie Locks Mean
4. GKD-C Confirmation 1 signal was less than 7 candles prior
Next Candle:
1. Price retraced (Long: close < close or Short: close > close )
2. GKD-B Baseline agrees
3. GKD-C Confirmation 1 agrees
4. GKD-C Confirmation 2 agrees
5. GKD-V Volatility/Volume Agrees
PullBack Entry
1. GKD-B Baseline signal
2. GKD-C Confirmation 1 agrees
3. Price is beyond 1.0x Volatility of Baseline
Next Candle:
1. Price is within a range of 0.2x Volatility and 1.0x Volatility of the Goldie Locks Mean
3. GKD-C Confirmation 1 agrees
4. GKD-C Confirmation 2 agrees
5. GKD-V Volatility/Volume Agrees
█ KAMA w/ Jurik Fractal Dimension
What is KAMA w/ Jurik Fractal Dimension?
KAMA (Kaufman Adaptive Moving Average) with Jurik Fractal Dimension is a technical analysis indicator that combines the Kaufman Adaptive Moving Average (KAMA) with the Jurik Fractal Dimension indicator.
The KAMA is a type of moving average that is designed to adapt to changes in market volatility and trend. It is calculated by adjusting the smoothing period of an exponential moving average based on the volatility of the asset being analyzed. This makes the KAMA more responsive to changes in price than traditional moving averages, while still providing a stable trend line that reduces lag.
The Jurik Fractal Dimension indicator is a measure of the "fractality" of price movements. It is based on the idea that market prices are fractal in nature, meaning that they exhibit self-similar patterns across different time frames. The Jurik Fractal Dimension indicator measures the degree of fractality in price movements, with higher values indicating more complex and unpredictable price patterns.
By combining the KAMA with the Jurik Fractal Dimension indicator, traders can generate more accurate buy and sell signals. The KAMA helps to identify trends, while the Jurik Fractal Dimension indicator helps to filter out false signals by identifying whether price movements are trending or non-trending. This can help traders to avoid entering trades during periods of low volatility or when markets are trading sideways.
Overall, KAMA with Jurik Fractal Dimension is a sophisticated technical analysis tool that can help traders to identify trends and make more informed trading decisions. However, it is important to note that no indicator is foolproof and traders should always use multiple tools and strategies to confirm their trading decisions.
Requirements
Inputs
Confirmation 1 and Solo Confirmation: GKD-V Volatility / Volume indicator
Confirmation 2: GKD-C Confirmation indicator
Outputs
Confirmation 2 and Solo Confirmation: GKD-E Exit indicator
Confirmation 1: GKD-C Confirmation indicator
Continuation: GKD-E Exit indicator
Additional features will be added in future releases.
Hotch v1.02 RSI+Fractals/VWAP Bands/Smoothed Moving Average. In this script the RSI is used the limit number of displayed fractals to only those fractals that are triggered in the RSI Overbought and Oversold areas. This helps keep the chart cleaner looking when combined with other indicators so other icons that are plotted above and below candles are not covered up.
For example if the RSI drops below 30 the next fractal would be displayed.
If the RSI stays below 30 each fractal would be displayed.
If the RSI dips below 30 and returns above 30 before there is a fractal is displayed, the next valid fractal would still be displayed.
With optimization of the RSI values this indicator can be used in confluence with the included VWAP bands and Moving average to find trend reversal entry points for trades. Also recommended is to use a divergence identifying lower indicator as a secondary confirmation of trade entry.
Example of a potential long entry using the displayed chart.
1) RSI under 30
2) Price was recently outside of your chosen VWAP multiple.
3) a fractal was triggered.
Additionaly:
4) Use other indicators or other confluences for a stronger trade signal.
5) Use your preferred method of determining entry price stop loss and take profit.
NOTE: Fractals normally paint two bars behind the current bar. In this code, with the combination of the RSI and Fractal Trigger, the fractal paints an icon on the current bar.

WiseAnalyze EMA + fractalsCombination of exponential moving averages allow to spot the trend reversal and expansion, Bill Williams fractals and support resistance zones allow to trade without drawing anything. Just follow the trend.
Study your chart. Note which EMA act as support and bounce most of tests. Most often I use 21/34 EMA for new entries.
Most powerful trend indicator is MAWV. Don't try to trade against it. If price above go long. If below - short.
Stops should be placed behind fractals. Breakout entries on price crossing fractals.
BTC Fractal Momentum ExtremesDescription – BTC Fractal Momentum Extremes (BTCFME)
BTC Fractal Momentum Extremes (BTCFME) is a multi-factor, multi-method technical indicator designed to detect potential top and bottom reversal points in Bitcoin price action by integrating a confluence of unconventional signals. It combines fractals, adaptive momentum, volume dynamics, price velocity convergence, and market structure shifts — all filtered through real-time volatility and contextualized by temporal market conditions.
This tool is best used by traders looking to spot high-confidence turning points on intraday or swing timeframes, and works particularly well in volatile, momentum-driven environments.
Key Components & Methodology
BTCFME utilizes five independent signal-generation methods:
1. Fractal Volume Divergence
Detects reversal fractals in price (5-bar patterns) and validates them with volume anomalies:
Volume spikes (e.g., climax moves) or
Volume exhaustion (e.g., waning participation)
2. Adaptive Momentum Oscillator
Calculates momentum normalized by ATR-adjusted volatility, filtering out noise in choppy markets. It spots directional shifts when momentum inflects from extreme levels.
3. Market Structure Breaks
Identifies dynamic support and resistance using a configurable lookback, and flags potential breakouts or breakdowns from those levels.
4. Price Velocity Convergence
Analyzes the rate of change (velocity) and its acceleration. When both compress within a narrow volatility range, it signals a potential inflection zone.
5. Temporal Confluence Filter
Signals are only considered valid during active market hours (9 AM – 4 PM, excluding weekends) to reduce false positives during illiquid or inefficient trading periods.
Signal Logic & Sensitivity
Signals are generated when at least 3 out of 4 core methods agree, controlled by the Signal Sensitivity setting:
1 (High Sensitivity) = Trigger signals with fewer confirmations
5 (Low Sensitivity) = Require stronger multi-factor confluence
🔹 Buy (Bottom) Signals trigger when:
Bullish fractals appear
Momentum is deeply negative but improving
Price tests structure support
Velocity compresses below average
🔺 Sell (Top) Signals trigger when:
Bearish fractals with volume spikes appear
Momentum peaks and starts to decline
Price tests resistance
Velocity compresses near highs
Visual Features
Arrows: Buy signals = green arrow below candle. Sell signals = red arrow above candle.
Background Color: Indicates overall momentum regime (green = bullish bias, red = bearish, gray = neutral).
Dynamic Support & Resistance Lines: Based on recent swing highs/lows.
Signal Table (top-right): Shows real-time stats on:
Momentum value
Volatility factor
Volume strength (vs. 20-SMA)
Market structure status
Alerts
You can set alerts using the built-in conditions:
BTC Bottom Alert → Fires on potential market bottoms.
BTC Top Alert → Fires on potential market tops.
These alerts are filtered to avoid whipsaw conditions, by checking that opposite signals did not trigger in the last 2 candles.
How to Use
Timeframes: Best suited for 1H–4H and Daily BTC charts, but adaptable to others with parameter tuning.
Confirm with Price Action: Use BTCFME signals in conjunction with candlestick patterns or S/R zones for best results.
Adjust Sensitivity: Lower values catch more signals (good for scalping), higher values filter for stronger reversals (ideal for swing trades).
Use in Trending or Reversing Markets: BTCFME performs best during trending environments or volatile reversals — avoid during prolonged flat/ranging zones.
Notes & Recommendations
BTCFME is not a standalone buy/sell signal; combine it with risk management and trend confirmation tools.
Avoid using it during extremely low-volume sessions (e.g., late weekends).
Adjust parameters based on BTC's evolving volatility and your trading style.

CandelaCharts - Fractal Range Model📝 Overview
The Fractal Range Model (FRM) is an all-encompassing and sophisticated trading framework that incorporates multiple market dynamics to provide a deeper understanding of price movements.
This model is built around several key principles, including Market Swing Points, Sweeps, Candle Mean, and Change in State of Delivery (CISD), which together offer a nuanced and effective approach to trading.
At its core, the model focuses on Market Swing Points, which represent crucial turning points in the market where price action shifts direction.
These points provide insight into potential reversals and momentum changes, allowing traders to identify key support and resistance areas.
Recognizing these swings is critical in anticipating future price movements and understanding the market’s underlying structure.
The Fractal Range Model (FRM) is a versatile trading strategy that adapts to various styles, whether you're into scalping, day trading, swing trading, or long-term investment. Its flexibility makes it suitable for traders with different time horizons and risk preferences, allowing it to be effectively applied across multiple market conditions.
📦 Features
Timeframe Alignment: This indicator reveals lower Timeframe movements within higher Timeframe candles, offering insights into micro trends, structure shifts, and key entry points.
Bias Selection: This feature lets analysts control bias and setup detection, viewing bullish, bearish, or neutral formations to align with higher Timeframe trends.
Double Purge Sweeps: A double purge is a type of Sweep where the price exceeds both the high and low of the previous candle (via wicks) and then closes within the range of the prior candle.
Time Filters: Sync Time and price by selecting custom Time windows to focus on relevant formations.
Higher Timeframe Candles: The Fractal Range Model integrates ICT Power of Three, helping traders spot key turning points and market transitions across Timeframes.
Higher Timeframe PD Arrays: The HTF PD Arrays (FVG, IFVG) are key points of interest that indicate significant market levels where valid sweeps are likely to occur.
Lower Timeframe PD Arrays: The LTF PD Arrays (FVG, IFVG), on the other hand, are used for identifying entry points.
Smart Money Technique: In the context of the Fractal Range Model (FRM), the SMT (Smart Money Technique) serves as a crucial confluence indicator that strengthens the reliability of a formed model.
Info Panel: Display a customizable table with key details like timeframe pairing, time to next candle close, bias, and time filter settings, with full control over size, location, and borders.
Suitable for any Market: Ideal for all markets - stocks, forex, crypto, futures, commodities and more - delivering consistent results and insights across diverse trading environments.
⚙️ Settings
Core
Status: Filter models based on status
Bias: Controls what model type will be displayed, bullish or bearish
Fractal: Controls the timeframe pairing will be used
Mean: Plots the equilibrium of the previous HTF candle
Liquidity: Displays the liquidity levels that belongs to the model
Sweep: Shows the sweep that forms a model
I-sweep: Controls the visibility of invalidated sweeps
D-purge: Plots the double purge sweeps
CISD: Displays the Change In State of Delivery for a model
Labels: Adjust the HTF candle label size
C-area: Highlights the region between current candle open and previous candle equilibrium
History
History: Controls the mount of past models displayed on the chart
Filters
Asia: Filter models based on Asia Killzone hours
London: Filter models based on London Killzone hours
NY AM: Filter models based on NY AM Killzone hours
NY Launch: Filter models based on NY Launch Killzone hours
NY PM: Filter models based on NY PM Killzone hours
Custom: Filter models based on user Custom hours
HTF
Candles: Controls the number of HTF candles that will be visible on the chart
Open: Highlights with a line the open price of current HTF candle
Show True Day Open: Display True Day Open line
Offset: Controls the distance of HTF from the current chart
Space: Controls the space between HTF candles
Size: Controls the size of HTF candles
PD Array: Displays ICT PD Arrays
CE Line: Style the equilibrium line of PD Array
Border: Style the border of PD Array
LTF
H/L Line: Displays on the LTF chart High and Low of each HTF candle
O/C Line: Displays on the LTF chart Open and Close of each HTF candle
PD Array: Displays ICT PD Arrays
CE Line: Style the equilibrium line of PD Array
Border: Style the border of PD Array
Projections
StDev: Controls standard deviation available levels
Labels: Controls the size of standard deviation levels
Anchor: Controls the anchor point of standard deviation levels (wick, body)
Lines: Controls the line widths and color of standard deviation levels
SMT
Show: Display SMT
Symbol: Symbol 1
Symbol: Symbol 2
Style: Controls the color of Bearish and Bullish SMTs
Dashboard
Panel: Display information about current model
💡 Framework
The model includes the following timeframe parings:
15s - 5m
1m - 15m
1m - 30m
2m - 20m
3m - 30m
3m - 60m
5m - 1H
15m - 4H
15m - 8H
30m - 9H
30m - 12H
1H - 1D
2H - 2D
3H - 3D
4H - 1W
8H - 2W
12H - 3W
1D - 1M
2D - 2M
1W - 3M
2W - 6M
3W - 9M
1M - 12M
The Fractal Range Model follows a specific lifecycle, which highlights the current state of the model and determines whether a trade opportunity is valid.
The model's lifecycle includes the following statuses:
Formation (grey)
Invalidation (red)
Success (green)
1. Formation
The Formation phase marks the initial setup of the Fractal Range Model. During this stage, the model identifies and plots key components, such as:
Sweeps: Market movements that indicate a potential reversal or strong shift in trend.
CISD (Change In State of Delivery): A structural change that provides insight into trend shifts.
Once these components are detected, the model automatically calculates and displays Projections and Liquidity Levels , offering insights into potential price action movements.
At this stage, the model also identifies and displays the following key elements:
HTF PD Arrays (Higher-Timeframe Price Delivery Arrays)
LTF PD Arrays (Lower-Timeframe Price Delivery Arrays)
Smart Money Technique (SMT)
If any of these elements are present, they will be automatically displayed on the chart.
2. Invalidation
A Fractal Range Model is considered invalidated when the price does not reach the 2 Standard Deviation level or the first identified liquidity level, and when the price breaks above the high that formed the Sweep.
Invalidation signals that the original setup is no longer reliable, and traders should avoid taking action based on the model's original parameters.
Key invalidation conditions:
Price fails to reach the 2 Standard Deviation level.
Price fails to reach the first liquidity level.
Price breaks the high/low that initiated the Sweep.
A potentially invalidated model is marked with a purple color above the label, indicating the sweep is invalidated by the next candle, but not the high that formed the sweep.
3. Success
A Fractal Range Model is considered successful when the price reaches the 2 Standard Deviation level or the first identified liquidity level. This indicates that the model's predictions align with actual market movements, confirming the setup's validity and providing a potential trading signal.
At this stage, alongside Projections and Liquidity levels, you'll also notice the C-area — the region between the current candle's open and the previous candle's mean. If respected, price action will follow the model's direction.
Key success conditions:
Price reaches the 2 Standard Deviation level.
Price reaches the first liquidity level.
By leveraging these phases, Formation, Invalidation, and Success, traders can effectively manage their positions, minimize risk, and capitalize on high-probability setups based on the Fractal Range Model.
⚡️ Showcase
Introducing Fractal Range Model is a powerful trading tool designed to elevate your market analysis and boost your trading success. Built with precision and advanced algorithms, this indicator helps you identify key trends, potential entry and exit points, and optimize your strategy for better decision-making.
History
HTF Candles
HTF PD Arrays
LTF PD Arrays
SMT
Unlock your full trading potential and experience the difference with Fractal Range Model — your ultimate tool for smarter, more informed trading decisions.
🚨 Alerts
This script offers alert options for all model types. The alerts need to be setup manually from Tradingview.
Bearish Model
A bearish model alert is triggered when a model forms, signaling a high sweep and CISD.
Bullish Model
A bullish model alert is triggered when a model forms, signaling a low sweep and CISD.
⚠️ Disclaimer
These tools are exclusively available on the TradingView platform.
Our charting tools are intended solely for informational and educational purposes and should not be regarded as financial, investment, or trading advice. They are not designed to predict market movements or offer specific recommendations. Users should be aware that past performance is not indicative of future results and should not rely on these tools for financial decisions. By using these charting tools, the purchaser agrees that the seller and creator hold no responsibility for any decisions made based on information provided by the tools. The purchaser assumes full responsibility and liability for any actions taken and their consequences, including potential financial losses or investment outcomes that may result from the use of these products.
By purchasing, the customer acknowledges and accepts that neither the seller nor the creator is liable for any undesired outcomes stemming from the development, sale, or use of these products. Additionally, the purchaser agrees to indemnify the seller from any liability. If invited through the Friends and Family Program, the purchaser understands that any provided discount code applies only to the initial purchase of Candela's subscription. The purchaser is responsible for canceling or requesting cancellation of their subscription if they choose not to continue at the full retail price. In the event the purchaser no longer wishes to use the products, they must unsubscribe from the membership service, if applicable.
We do not offer reimbursements, refunds, or chargebacks. Once these Terms are accepted at the time of purchase, no reimbursements, refunds, or chargebacks will be issued under any circumstances.
By continuing to use these charting tools, the user confirms their understanding and acceptance of these Terms as outlined in this disclaimer.

Neo's Divergence FractalsDivergence Fractals combine divergence candlestick patterns with concepts pioneered by Bill Williams and George Lane to create a precise trend following tool that responds very well to the FX market. This indicator is built off of my Neo Fractal data set, which unlike traditional Williams fractals, track highest and lowest closes instead of higher highs and lower lows. Through my own research, I've found Neo Fractals to be a much more accurate way of pinpointing %K and RSI extremes than Williams fractals, especially in scenarios where markets make higher highs or lower lows, but fail to close higher or lower. This can lead to false divergence signals because the stochastic and RSI values aren't referenced at their highest or lowest point.
If divergence is detected between the previous close and the closest fractal above or below the close, the script then waits for a close above (bullish), or below (bearish) the close where divergence was present, at which point, an up (bullish) or down (bearish) fractal will appear on the chart. Divergence signals followed by engulfing candles are also colored, so they're easy to spot. These are the highest quality reversal or in some cases trend continuation signals! Divergence Fractals can be a great entry tool, but can also be great for managing and closing active trades as well. This indicator was designed to work in tandem with my %K as well as my proprietary Lucky7 indicator, mainly on the 1HR chart.
