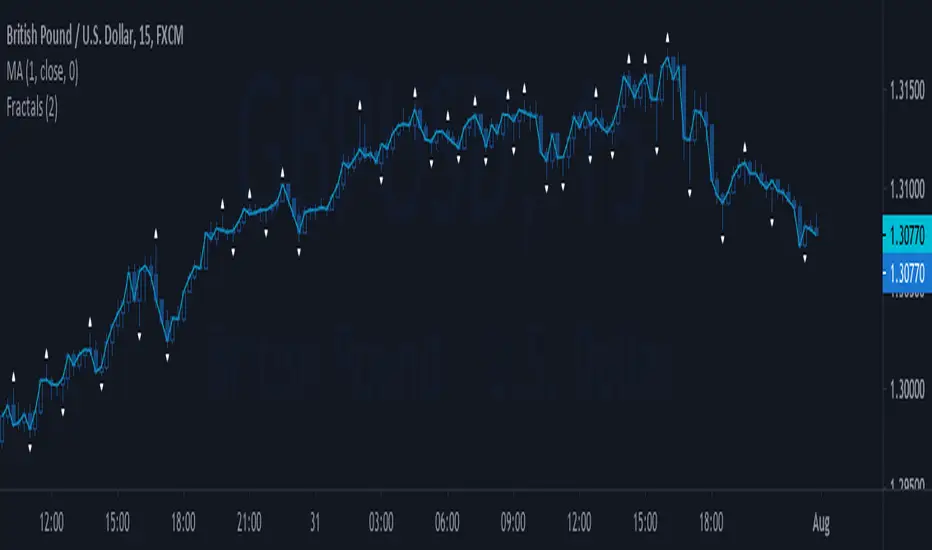
Power Peaks & Valleys (Williams Fractals)This indicator uses Williams Fractals (standard indicator on TradingView) as a base to identify Peaks and Valleys (Pivot Points) that usually act as Resistance and Support levels. What this indicator brings is powerful options to filter those Fractals out based on:
Candle Type : calculated based on candle Open and Close (All / Bullish / Bearish)
Minimum Candle Size : calculated based on a lookback of past range of candles and measuring their sizes (None / Average of Candles Range / Max of Candles Range)
With these features, you can decide whether you want all Fractals or specific ones that could be considered major due to their candle type and size where the Fractal appears. Usually, drawing a horizontal level for the inner side of the candle (the High of the Bearish candle Fractal or the Low of the Bullish candle Fractal could see nice reactions for entries.
All features are configurable from the indicator's settings.
Please leave a comment for improvements or suggestions. Alerts and more Candle Types or Minimum Candle Size might be added in the future, as well as the ability to auto draw the levels as soon as they appear or removing them if they get invalidated.
חפש סקריפטים עבור "Fractal"

Personal Nested Fractal IndicatorThis script implements a nested fractal-based indicator that identifies potential buy and sell signals by analyzing fractal patterns in price action. It calculates larger and smaller fractal highs and lows and uses these patterns to confirm entry points. When smaller fractals appear within the range of larger fractals, the script generates buy or sell signals, which are plotted on the chart as visual markers. The logic is based on detecting price turning points through fractal analysis without any further complexity or additional filters.

Prometheus Fractal WaveThe Fractal Wave is an indicator that uses a fractal analysis to determine where reversals may happen. This is done through a Fractal process, making sure a price point is in a certain set and then getting a Distance metric.
Calculation:
A bullish Fractal is defined by the current bar’s high being less than the last bar’s high, and the last bar’s high being greater than the second to last bar’s high, and the last bar’s high being greater than the third to last bar’s high.
A bearish Fractal is defined by the current low being greater than the last bar’s low, and the last bar’s low being less than the second to last bar’s low, and the last bar’s low being less than the third to last bar’s low.
When there is that bullish or bearish fractal the value we store is either the last bar’s high or low respective to bullish or bearish fractal.
Once we have that value stored we either subtract the last bar’s low from the bullish Fractal value, and subtract the last bar’s high from the bearish Fractal value. Those are our Distances.
Code:
isBullishFractal() =>
high > high and high < high and high > high
isBearishFractal() =>
low < low and low > low and low < low
var float lastBullishFractal = na
var float lastBearishFractal = na
if isBullishFractal() and barstate.isconfirmed
lastBullishFractal := high
if isBearishFractal() and barstate.isconfirmed
lastBearishFractal := low
//------------------------------
//-------CACLULATION------------
//------------------------------
bullWaveDistance = na(lastBullishFractal) ? na : lastBullishFractal - low
bearWaveDistance = na(lastBearishFractal) ? na : high - lastBearishFractal
We then plot the bullish distance and the negative bearish distance.
The trade scenarios come from when one breaks the zero line and then goes back above or below. So if the last bullish distance was below 0 and is now above, or if the last negative bearish distance was above 0 and now below. We plot a green label below a candle for a bullish scenario, or a red label above a candle for a bearish one, you can turn them on or off.
Code:
plot(bullWaveDistance, color=color.green, title="Bull Wave Distance", linewidth=2)
plot(-bearWaveDistance, color=color.red, title="Bear Wave Distance", linewidth=2)
plot(0, "Zero Line", color=color.gray, display = display.pane)
bearish_reversal = plot_labels ? bullWaveDistance < 0 and bullWaveDistance > 0 : na
bullish_reversal = plot_labels ? -bearWaveDistance > 0 and -bearWaveDistance < 0 : na
plotshape(bullish_reversal, location=location.belowbar, color=color.green, style=shape.labelup, title="Bullish Fractal", text="↑", display = display.all - display.status_line, force_overlay = true)
plotshape(bearish_reversal, location=location.abovebar, color=color.red, style=shape.labeldown, title="Bearish Fractal", text="↓", display = display.all - display.status_line, force_overlay = true)
We can see in this daily NASDAQ:QQQ chart that the indicator gives us marks that can either be used as Reversal signals or as breathers in the trend.
Since it is designed to provide reversals, on something like Gold where the uptrend has been strong, the signals may be just short breathers, not full blown strong reversal signs.
The indicator works just as well intra day as it does on larger timeframes.
We encourage traders to not follow indicators blindly, none are 100% accurate. Please comment on any desired updates, all criticism is welcome!

Two Fractals TrendlinesThis study draws a trend line for the last two Bill Williams up-fractals and down-fractals.
Trend line break signals and alerts can optionally be added.

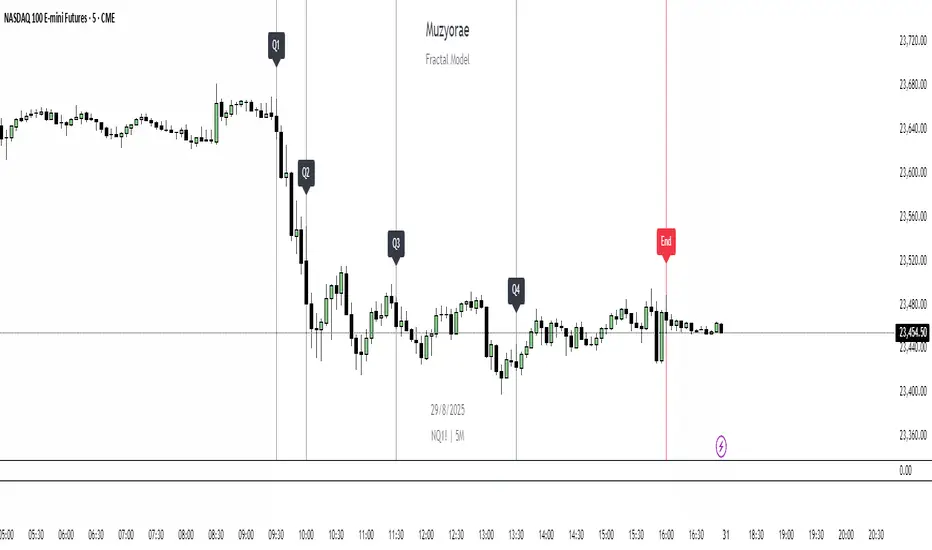
Muzyorae - Quarterly TheoryQuarterly Theory — NY Session Macro Model
The Quarterly Theory Model is a structured framework for analyzing intraday market behavior based on institutional activity and macro-level cycles.
It divides the New York trading session into four sequential “quarters” (Q1–Q4), each representing distinct phases of market participation, liquidity accumulation, and directional bias.
This model is designed for professional traders who aim to align their strategies with institutional flows, key liquidity zones, and market structure shifts.
It accommodates both AMDX (Accumulation → Manipulation → Distribution → Expansion) and XAMD (reversal sequences) fractal patterns, allowing traders to adapt to varying market conditions.
Price action may expand early during Q1 in an XAMD sequence, representing an initial breakout or early liquidity sweep before the typical Q2 manipulation phase. Traders should be aware that Q1 can occasionally produce unexpected volatility or directional bias in such sequences.
Session Breakdown (New York Time)
Q1 – Accumulation
Time: 9:30 – 10:00 AM
Phase Characteristics: Early session positioning, initial liquidity sweeps, and false moves. Institutions build positions while retail participants often react to gaps and premarket activity.
Note: Price may expand early in an XAMD sequence, creating a short-term directional move before Q2.
Q2 – Manipulation / Expansion
Time: 10:00 – 11:30 AM
Phase Characteristics: The main directional move develops, often characterized by breaks of structure, fair value gaps, and liquidity sweeps. This is a prime area for trend initiation.
Q3 – Distribution / Retracement
Time: 11:30 AM – 1:30 PM
Phase Characteristics: Price consolidates and retraces into prior accumulation zones, reflecting profit-taking or redistribution by institutions. Market chop and sideways movement are common.
Q4 – Final Expansion / Repricing
Time: 1:30 – 4:00 PM
Phase Characteristics: The afternoon session often produces final liquidity sweeps, trend continuation, or reversals, setting the high or low of the day and completing the daily macro cycle.
Key Features of the Model
Fractal-Based Structure: Q1–Q4 cycles reflect institutional behavior at a macro level, scalable to other intraday or multi-day fractals.
Supports AMDX & XAMD: Allows for both standard accumulation → manipulation → distribution → expansion sequences and reversal patterns depending on market behavior.
Early Expansion in Q1: Recognizes that in XAMD sequences, Q1 may produce early directional moves or breakout activity.
True Open Q2 Line: Highlights the opening price of Q2 as a reference for trend validation and potential entry zones.
Dynamic Time Alignment: Fully synchronized with New York (ET) time zone, ensuring accurate representation of market cycles.
Professional Visualization: Optional labels and vertical markers for each quarter, supporting quick visual analysis and pattern recognition.
Integration with ICT Concepts: Compatible with Smart Money Techniques (SMT), Fair Value Gaps (FVGs), Order Blocks (OBs), and Break of Structure (BOS) for enhanced trade planning.
Purpose and Application
Anticipates areas of liquidity accumulation and manipulation.
Identifies optimal entry and exit zones within institutional cycles.
Structures trades around probable trend initiation and continuation periods.
Aligns retail activity with institutional flow for higher probability setups.
Adapts to market variability through AMDX and XAMD fractal patterns.
Accounts for early expansions or breakout activity during Q1 in XAMD sequences.
By using the Quarterly Theory Model, traders gain a systematic, time-based framework to interpret market structure and maximize alignment with institutional participants.
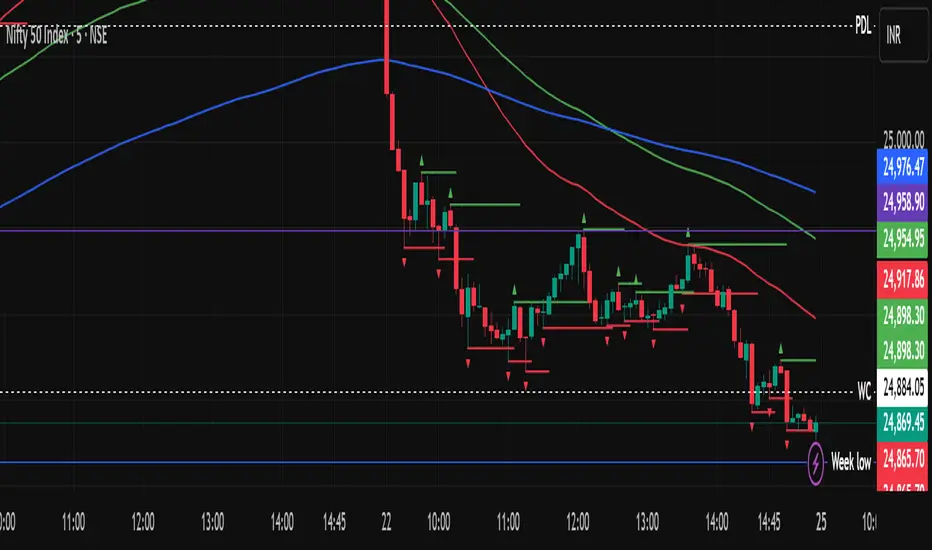
IPDA Logic sessions🔹What Does This Indicator Do?
This indicator helps traders visualize trading sessions (Asia, Frankfurt, London, New York) and analyze key price levels, including:
✅ Previous Day’s High/Low (PDH/PDL) – for liquidity tracking
✅ New York Midnight (NYM) & True Daily Open (TDO) – essential for IPDA Logic
✅ Fractals (local highs and lows) – helps identify reversal points
This is a powerful tool for scalpers, intraday traders, and swing traders who need to track price movements within different trading sessions and monitor liquidity zones.
🔹 Key Features of the Indicator
✅ Trading Sessions Visualization
Highlights Asia, Frankfurt, London, and New York sessions with different colors
Allows traders to enable/disable each session individually
Customizable time zones for personalized trading styles
✅ Key Price Levels
PDH/PDL (Previous High/Low) – helps determine major liquidity zones
Daily Open (DO) – a crucial price level for market structure
New York Midnight (NYM) – used in professional IPDA Logic analysis
✅ Fractals for Market Structure
Displays local swing highs and lows
Option to choose between 3-candle and 5-candle fractals for more precise analysis
Helps traders spot potential reversal zones
🔹 What Makes This Indicator Unique?
🔥 Combines Trading Sessions & Fractals – Most TradingView indicators show either sessions or fractals, but not both in a structured way.
🔥 Flexible Customization – Traders can adjust timeframes, colors, and styles to fit their needs.
🔥 Historical Session Analysis – Review past sessions to identify liquidity pools and price movements.
🔥 Works for Different Trading Styles – Scalpers & swing traders can both benefit from this tool.
📌 How to Use It?
✔ Add the indicator to your chart
✔ Select the sessions, key levels, and fractals you want to display
✔ Use these levels to analyze liquidity, reversals, and market trends
This indicator is designed for those who want a clear visualization of sessions and a better understanding of liquidity behavior. 🚀📊

Quantum Liquidity Fractal Dynamics (QLFD) v2.1The Quantum Liquidity Fractal Dynamics (QLFD) v2.1 is an advanced multi-dimensional market analysis too l engineered for professional traders seeking to identify high-probability liquidity-driven reversals. Built upon a proprietary Fractal-Liquidity Convergence Model (FLCM), QLFD v2.1 leverages quantum-phase liquidity oscillations and institutional absorption mapping to dynamically assess order flow efficiency within multi-timeframe market structures.
Core Algorithmic Methodology
QLFD v2.1 integrates a Hybridized Recursive Liquidity Matrix (HRLM) with High-Frequency Adaptive EMA Displacement (HFAED) to model non-linear liquidity density clusters. This proprietary framework is further reinforced by a Multi-Layered RSI Vorticity Filter (MLRVF), enhancing the signal integrity by filtering out stochastic noise anomalies.
The EMA-200 Rejection Dynamics, combined with the Vortex RSI Momentum Refraction Index (VRMRI), allow the system to isolate institutional footprint imbalances. By capturing transient liquidity voids and microstructure inefficiencies, QLFD v2.1 enables traders to position themselves ahead of high-probability liquidity sweeps.
Signal Efficiency & Institutional Calibration
While QLFD v2.1 exhibits an exceptionally high accuracy rate in identifying potential reversal vectors, it is imperative for traders to exercise institutional-grade signal filtration. The indicator autonomously detects Phase-Induced False Signal Clusters (PIFSCs), yet discretion remains paramount in avoiding transient liquidity mirages—a common occurrence in markets exhibiting hyper-fractalized liquidity dislocations.
For optimal performance, professional traders must apply a Multi-Stage Confirmation Protocol (MSCP), leveraging additional confluence layers such as:
Order Flow Delta Cohesion (OFDC)
Gamma-Weighted Imbalance Deviation (GWID)
Synthetic Volume Shockwave Ratio (SVSR)
These advanced methodologies ensure that traders engage only with high-probability fractal reversals, filtering out structurally unreliable signals induced by inter-market arbitrage distortions.
Final Thoughts
QLFD v2.1 is not designed for retail-grade signal chasing. It is an institutional-grade analytical framework tailored for professionals who understand the fractal complexity of modern liquidity landscapes. Mastering the art of discretionary filtration—by distinguishing true liquidity-driven reversals from algorithmically-induced decoy impulses—is the key to leveraging this system’s full potential.

Makuchaku's Trade Tools - Pivots/Fractals & CrossoversPivots/Fractals are at minimum a 3 candlestick pattern.
Bearish pivot/fractal is formed when a candle is flanked by 2 lower candles on either side
Bullish pivot/fractal is formed when a candle is flanked by 2 higher candles on either side
They are great to determine market structure.
This indicator also prints boxes when those pivots/fractals are crossed over, printing bearish & bullish boxes.

Advanced Fractal Dimension Index [DW]This is an experimental study based on Benoit Mandelbrot's fractal dimension concepts.
Fractal dimension is a ratio providing a statistical measure of complexity comparing how detail in a pattern changes with the scale at which it's measured.
The concept of a fractional or fractal dimension was derived from an unconventional approach to standard geometric definitions.
We all know the standard geometric rules of dimension: D=0 is a point, D=1 is a line, D=2 is a plane, and D=3 is a volume, based on the number of axes being occupied.
However, by taking a fractal geometric approach, we can define dimension like so:
N = s^-D , where N is the number of measurement segments, s is the scale factor, and D is the dimension of the object being measured.
This approach typifies conventional knowledge of dimensions as well. Here are some basic examples:
If we divide a line segment into 4 equal line segments, then we'd get 4 = (1/4)^-D. Solving for D, we get D=1, which is what we'd expect from a line.
If we divide a square into 16 equal squares, we'd be separating each line on the square into 4 pieces, so 16 = (1/4)^-D. Solving for D, we get D=2, which is what we'd expect from a square.
If we divide a cube into 64 equal cubes, we'd be separating each line on the cube into 4 pieces, so 64 = (1/4)^-D. Solving for D, we get D=3, which is what we'd expect from a cube.
The same approach can be applied to fractal objects, although admittedly it's less intuitive.
Let's say you use a stick to measure a curve, then you divide the stick into 3 equal segments and re-measure the length.
But rather than the re-measured curve showing a length of 3 of the smaller segments, it is actually 4 segments long.
This irregularity means that detail has increased as you scaled your measurement down, so the curve is dimensionally higher than the space it resides in.
In this example: 4 = (1/3)^-D. Solving for D, we get D=1.2619.
For a true fractal, this scaling of self-similar measurements would continue infinitely.
However, unlike true fractals, most real world phenomena exhibit limited fractal properties, in which they can be scaled down to some limited quantity.
Many forms of time series data (seismic data, ECG data, financial data, etc.) have been theoretically shown to have limited fractal properties.
Consequently, we can estimate fractal dimension from this data to get an approximate measure of how rough or convoluted the data stream is.
Financial data's fractal dimension is limited to between 1 and 2, so it can be used to roughly approximate the Hurst Exponent by the relationship H = 2 - D.
When D=1.5, data statistically behaves like a random walk. D above 1.5 can be considered more rough or "mean reverting" due to the increase in complexity of the series.
D below 1.5 can be considered more prone to trending due to the decrease in complexity of the series.
In this study, you are given the option to apply equalization (EQ) to the dataset before estimating dimension.
This enables you to transform your data and observe how its complexity changes as well.
Whether you want to give emphasis to some frequencies, isolate specific bands, or completely alter the shape of your waveform, EQ filtration makes for an interesting experience.
The default EQ preset in this script removes the low shelf, then attenuates low end and high end oscillations.
The dominant cyclical components (bands 3 - 5 on default settings) are passed at 100%, keeping emphasis on 8 to 64 sample per cycle oscillations.
In addition, if you're wanting a simpler filter process, or if you want a little extra, there are options included to pre and post smooth the data with 2 pole Butterworth LPFs.
The dimension estimation in this script works by measuring changes in detail using source's maximum range over a given lookback length.
In essence, it recursively updates its length parameter based on changes in range compared to the maximum over the lookback period, then uses the data to solve for D.
The FDI algorithm works on any length greater than 1. However, I didn't notice any particularly meaningful results with lookback lengths of 15 or less.
A custom color scheme is included in this script as well for FDI fill and bar colors.
The color scheme in this script is a multicolored thermal styled gradient.
The scale of gradient values is determined by the designated high and low dimension thresholds. These thresholds determine what range of values the gradient will focus on.
Values at the high threshold are the coolest and darkest, and values at the low threshold are the warmest and brightest.
Basically, the "trendier" the data is, the brighter and warmer the color will be.
Signals and alerts are included as well for crossovers on the high and low dimension thresholds.
These signals can also be externally linked to another script.
The output format is 1 for the trigger, and 0 otherwise. Basic boolean logic.
To integrate these signals with your script, simply use a source input and select the signal output from this script that you wish to use from the dropdown menu.
Fractal dimension is a powerful tool that can give valuable insight about the complexity and persistence / anti-persistence of price movements.
When used in conjunction with other analytical methods, it can prove to be a surprisingly beneficial tool to have in the arsenal.
-----------------------------------------------------
This is a premium script, and access is granted on an invite-only basis.
To gain access, get a copy of the indicator overview, or for additional inquiries, send me a direct message.
I look forward to hearing from you!
-----------------------------------------------------
General Disclaimer:
Trading stocks, futures, Forex, options, ETFs, cryptocurrencies or any other financial instrument has large potential rewards, but also large potential risk.
You must be aware of the risks and be willing to accept them in order to invest in stocks, futures, Forex, options, ETFs or cryptocurrencies.
Don’t trade with money you can’t afford to lose.
This is neither a solicitation nor an offer to Buy/Sell stocks, futures, Forex, options, ETFs, cryptocurrencies or any other financial instrument.
No representation is being made that any account will or is likely to achieve profits or losses of any kind.
The past performance of any trading system or methodology is not necessarily indicative of future results.

$MTF Fractal Echo DetectorMIL:MTVFR FRACTAL ECHO DETECTOR by Timmy741
The first public multi-timeframe fractal convergence system that actually works.
Market makers don’t move price randomly.
They test the same fractal structure on lower timeframes first → then execute the real move on higher timeframes.
This indicator catches the “echo” — when 3–5 timeframes are printing fractals at almost the exact same price level.
That’s not coincidence. That’s preparation.
FEATURES
• 5 simultaneous timeframes (1min → 4H by default)
• Real Williams Fractal detection (configurable period)
• Dynamic echo tolerance & minimum TF alignment
• Visual S/R zones from every timeframe
• Bullish / Bearish echo convergence signals
• Strength meter (3/5, 4/5, 5/5 TF alignment)
• Zero repainting — uses proper lookahead=off
• Fully Pine v6 typed + optimized
USE CASE
When you see a 4/5 or 5/5 echo:
→ That level is being defended or attacked with intent
→ 80%+ chance the next real move comes from there
→ Trade the breakout or reversal at that exact fractal cluster
Works insane on:
• BTC / ETH (all timeframes)
• Nasdaq / SPX futures
• Forex majors (especially GBP & gold)
• 2025 small-cap rotation setups
100% Open Source • MPL 2.0 • Built by Timmy741 • December 2024
If you know about fractal echoes… you already know.
#fractal #mtf #echo #williamsfractal #multitimeframe #smartmoney #ict #smc #orderflow #convergence #timmy741 #snr #structure

Time-Weighted Fractality (TWF)The Time-Weighted Fractality (TWF) indicator is your secret weapon to measure how stable or volatile a market truly is — by tracking how long trends persist, and weighting that against recent history.
Why you need TWF in your toolkit:
Markets aren’t always trending or choppy in a simple on/off way. TWF quantifies trend duration dynamics — revealing when the market is locked into a strong, stable trend or stuck in erratic, unpredictable moves.
How it works — sharp and simple:
Trend Duration Tracking:
Measures how many bars since the last highest high changed within a specified lookback. This tells you how long the current trend has been running.
Smoothed Average Duration:
Uses an EMA to smooth trend duration, providing a reliable baseline of recent trend behavior.
Ratio Calculation (TWF):
The core metric — current trend duration divided by average trend duration.
TWF > 1.2 means the current trend is stronger and more persistent than usual.
TWF < 0.8 signals a volatile, choppy market struggling to hold any trend.
What you see on the chart:
A clean TWF line plotted with clear zones:
Green zone = Strong, stable trend environment
Red zone = Choppy, volatile conditions to avoid or trade cautiously
Background shading highlights these zones for instant clarity
Markers appear at critical points for quick visual cues
Why traders swear by it:
✅ Reliable trend confirmation: Avoid false signals by only acting when TWF confirms sustained market momentum.
✅ Timing tool: Perfect for spotting when a trend is building strength or losing grip — invaluable for entries and exits.
✅ Versatile: Works on all timeframes and instruments, from forex to stocks to crypto.
✅ Simple but powerful: Combines fractal concept with time weighting and smoothing — giving you a next-level understanding of market rhythm.
Pro tip:
Use TWF alongside your favorite price or volume-based indicators for unmatched precision. For example, confirm breakouts only when TWF signals a stable trend zone to increase your win rate.
In a sea of noise, TWF cuts through to give you real, actionable insight. Trust it, build your strategy around it — it’s that good.

Alpha Fractal BandsWilliams fractals are remarkable support and resistance levels used by many traders. However, it can sometimes be challenging to use them frequently and get confirmation from other oscillators and indicators. With the new "Alpha Fractal Bands", a unique blend of Williams Fractals and Bollinger Bands emerges, offering a fresh perspective. Extremes can be utilized as price reversals or for taking profits. I look forward to hearing your thoughts. Best regards... Happy trading!
An easy solution for long positions is to:
Identify a bullish trend or a potential entry point for a long position.
Set a stop-loss order to limit potential losses if the trade goes against you.
Determine a target price or take-profit level to lock in profits.
Consider using technical indicators or analysis tools to confirm the strength of the bullish trend.
Regularly monitor the trade and make necessary adjustments based on market conditions.
An easy solution for short positions could be to follow these steps:
Identify a bearish trend or a potential entry point for a short position.
Set a stop-loss order to limit potential losses if the trade goes against you.
Determine a target price or take-profit level to lock in profits.
Consider using technical indicators or analysis tools to confirm the strength of the bearish trend.
Regularly monitor the trade and make necessary adjustments based on market conditions.
Remember, it's important to conduct thorough research and analysis before entering any trade and to manage your risk effectively.
To stay updated with the content, don't forget to follow and engage with it on TV, my friends. Remember to leave comments as well :)

Trading Energy FractalsThis script uses fractals from 4 different sources to calculate a final fractal sequence. These fractals are then used to find entries and exits.
Fractals are calculated from PRICE, RSI, STOCHASTIC and STOCHASTIC RSI using a consensus algorithm.
At the moment it works only for long entries.
There are also 2 MA. (50 and 15) to help us determine the direction of the trend. Take only the entries in the direction of the trend.

Trend FriendTrend Friend — What it is and how to use it
I built Trend Friend to stop redrawing the same trendlines all day. It automatically connects confirmed swing points (fractals) and keeps the most relevant lines in front of you. The goal: give you clean, actionable structure without the guesswork.
What it does (in plain English)
Finds swing highs/lows using a Fractal Period you choose.
Draws auto-trendlines between the two most recent confirmed highs and the two most recent confirmed lows.
Colours by intent:
Lines drawn from highs (potential resistance / bearish) = Red
Lines drawn from lows (potential support / bullish) = Green
Keeps the chart tidy: The newest lines are styled as “recent,” older lines are dimmed as “historical,” and it prunes anything beyond your chosen limit.
Optional crosses & alerts: You can highlight when price closes across the most recent line and set alerts for new lines formed and upper/lower line crosses.
Structure labels: It tags HH, LH, HL, LL at the swing points, so you can quickly read trend/rotation.
How it works (under the hood)
A “fractal” here is a confirmed pivot: the highest high (or lowest low) with n bars on each side. That means pivots only confirm after n bars, so signals are cleaner and less noisy.
When a new pivot prints, the script connects it to the prior pivot of the same type (high→high, low→low). That gives you one “bearish” line from highs and one “bullish” line from lows.
The newest line is marked as recent (brighter), and the previous recent line becomes historical (dimmed). You can keep as many pairs as you want, but I usually keep it tight.
Inputs you’ll actually use
Fractal Period (n): this is the big one. It controls how swingy/strict the pivots are.
Lower n → more swings, more lines (faster, noisier)
Higher n → fewer swings, cleaner lines (slower, swing-trade friendly)
Max pair of lines: how many pairs (up+down) to keep on the chart. 1–3 is a sweet spot.
Extend: extend lines Right (my default) or Both ways if you like the context.
Line widths & colours: recent vs. historical are separate so you can make the active lines pop.
Show crosses: toggle the X markers when price crosses a line. I turn this on when I’m actively hunting breakouts/retests.
Reading the chart
Red lines (from highs): I treat these as potential resistance. A clean break + hold above a red line often flips me from “fade” to “follow.”
Green lines (from lows): Potential support. Same idea in reverse: break + hold below and I stop buying dips until I see structure reclaim.
HH / LH / HL / LL dots: quick read on structure.
HH/HL bias = uptrend continuation potential
LH/LL bias = downtrend continuation potential
Mixed prints = rotation/chop—tighten risk or wait for clarity.
My H1 guidance (fine-tuning Fractal Period)
If you’re mainly on H1 (my use case), tune like this:
Fast / aggressive: n = 6–8 (lots of signals, good for momentum days; more chop risk)
Balanced (recommended): n = 9–12 (keeps lines meaningful but responsive)
Slow / swing focus: n = 13–21 (filters noise; better for trend days and higher-TF confluence)
Rule of thumb: if you’re getting too many touches and whipsaws, increase n. If you’re late to obvious breaks, decrease n.
How I trade it (example workflow)
Pick your n for the session (H1: start at 9–12).
Mark the recent red & green lines. That’s your immediate structure.
Look for interaction:
Rejections from a line = fade potential back into the range.
Break + close across a line = watch the retest for continuation.
Confirm with context: session bias, HTF structure, and your own tools (VWAP, RSI, volume, FVG/OB, etc.).
Plan the trade: enter on retest or reclaim, stop beyond the line/last swing, target the opposite side or next structure.
Alerts (set and forget)
“New trendline formed” — fires when a new high/low pivot confirms and a fresh line is drawn.
“Upper/lower trendline crossed” — fires when price crosses the most recent red/green line.
Use these to track structure shifts without staring at the screen.
Good to know (honest limitations)
Confirmation lag: pivots need n bars on both sides, so signals arrive after the swing confirms. That’s by design—less noise, fewer fake lines.
Lines update as structure evolves: when a new pivot forms, the previous “recent” line becomes “historical,” and older ones can be removed based on your max setting.
Not an auto trendline crystal ball: it won’t predict which line holds or breaks—it just keeps the most relevant structure clean and up to date.
Final notes
Works on any timeframe; I built it with H1 in mind and scale to H4/D1 by increasing n.
Pairs nicely with session tools and VWAP for intraday, or with supply/demand / FVGs for swing planning.
Risk first: lines are structure, not guarantees. Manage position size and stops as usual.
Not financial advice. Trade your plan. Stay nimble.

Varma Fractal TEMA IndicatorThe Indicator uses Fractals and Three EMAs. A fractal is a repeating price pattern, typically consisting of five candlesticks, used to identify potential trend reversals or continuations. A bullish fractal suggests a possible upward price movement, while a bearish fractal indicates a potential downward trend. These patterns, popularized by Bill Williams, can be found across different timeframes and are considered a key part of his technical analysis system. Every Fractal line acts as an immediate support or resistance. The use of three EMAs in trading is well known. One can make own strategies with them.
FVG TheoryThe indicator is intended to facilitate trading with FVGs. It consists of 3 components:
1. Swings:
A swing is a 3-candle formation based on the Williams Fractal Indicator.
The interaction with the last swing is always displayed as a red line. This allows you to recognize the last interaction directly and draw conclusions about the further course of the price (sweep / break).
In addition, the closest fractal is always shown as a green line, which acts as a potential target.
2. FVGs:
FVGs are also known as Inbalance, it is a 3 candle formation where a gap is created in the market. The market often runs into this and reacts.
If the market reacts from an imbalance before it has reached the swing low in the bullish case, the next FVG appears in a different color.
This formation has more power and is therefore color-coded.
If the FVG is particularly strong, measured by the fact that the 3rd candle in the formation breaks the 2nd candle with a candle body, this is marked with a small arrow in the FVG (break away gap).
3. overlapping
If there is a structure point within an FVG (order block, significant swing), a line is drawn there.
These overlaps have a higher confluence than FVGs alone. The wick is preferred, but if there is no overlap, the body of the structure is used.
The line thickness and colors are individually adjustable.

Nandy -Quantified Swing Highs & Lows v.2Uses 3 bar fractals ( Bill Williams - Trading Chaos) and differential standard deviation bands to quantify swing highs and swing lows

MultiTimeFrame Fractals D W M [xdecow]This indicator shows fractals in different timeframes. With the possibility of coloring the bars with any combination of current, daily, weekly and monthly timeframes.
The return points are calculated as follows:
high > last 3 highs and close above highest low
low < last 3 lows and closes below lowest high
The direction of higher timeframes fractals tend to be more durable and reliable. This indicator helps to find the fractal alignment of different timeframes, so that you can look for trade opportunities in the same direction as the higher timeframes and improve your chances.

Keltner Channels+Parabolic Sar+Fractals+MACDA mixture of 4 indicators on the same overlay. Keltner Channels, Parabolic Sar, Fractals. MACD is integrated for yellow candles in order to show huge macd and trigger line gaps. MACD integration focuses on hist line by determining negative upper level and positive bottom level.

Price Action + Fractals DetectorThe Price Action Patterns Detector indicator also includes a Fractal (WICK.ED style). This way, you'll see Pinbar, Engulfing, Doji, Inside/Outside Bar, Morning/Evening Star formations, and fractals will appear. 🔥

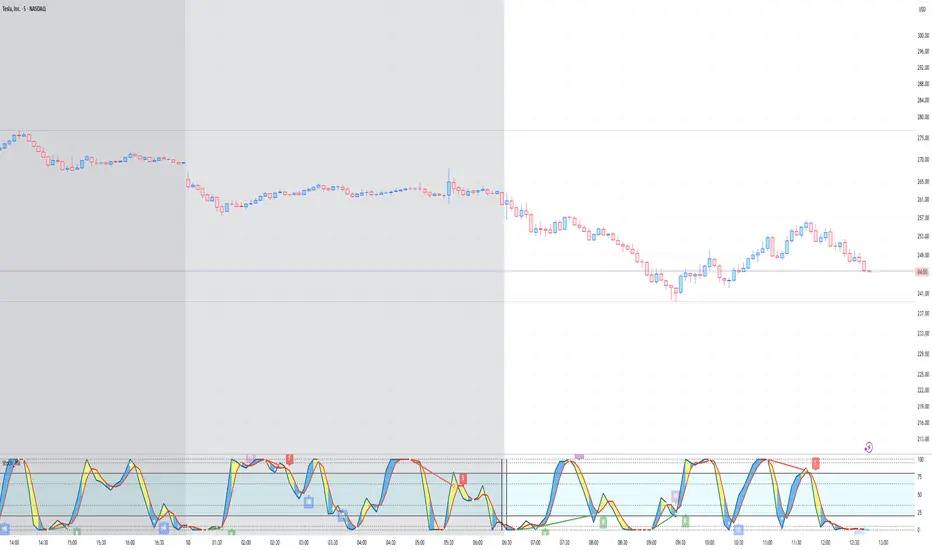
Stoch_RSIStochastic RSI – Advanced Divergence Indicator
This custom indicator is an advanced version of the Stochastic RSI that not only smooths and refines the classic RSI input but also automatically detects both regular and hidden divergences using two powerful methods: fractal-based and pivot-based detection. Originally inspired by contributions from @fskrypt, @RicardoSantos, and later improved by developers like @NeoButane and @FYMD, this script has been fully refined for clarity and ease-of-use.
Key Features:
Dual Divergence Detection:
Fractal-Based Divergence: Uses a four-candle pattern to confirm top and bottom fractals for bullish and bearish divergences.
Pivot-Based Divergence: Employs TradingView’s built-in pivot functions for an alternate view of divergence conditions.
Customizable Settings:
The inputs are organized into logical groups (Stoch RSI settings, Divergence Options, Labels, and Market Open Settings) allowing you to adjust smoothing periods, RSI and Stochastic lengths, and divergence thresholds with a user-friendly interface.
Visual Enhancements:
Plots & Fills: The indicator plots both the K and D lines with corresponding fills and horizontal bands for quick visual reference.
Divergence Markers: Diamond shapes and labeled markers indicate regular and hidden divergences on the chart.
Market Open Highlighting: Optional histogram plots highlight the market open candle based on different timeframes for stocks versus non-forex symbols.
Intrinsic Event (Multi DC OS)Overview
This indicator implements an event-based approach to analyze price movements in the foreign exchange market, inspired by the intrinsic time framework introduced in Fractals and Intrinsic Time - A Challenge to Econometricians by U. A. Müller et al. (1995). It identifies significant price events using an intrinsic time perspective and supports multi-agent analysis to reflect the heterogeneous nature of financial markets. The script plots these events as lines and labels on the chart, offering a visual tool for traders to understand market dynamics at different scales.
Key Features
Intrinsic Events : The indicator detects directional change (DC) and overshoot (OS) events based on user-defined thresholds (delta), aligning with the paper’s concept of intrinsic time (Section 6). Intrinsic time redefines time based on market activity, expanding during volatile periods and contracting during inactive ones, rather than relying on a physical clock.
Multi-Agent Analysis : Supports up to five agents, each with its own threshold and color settings, reflecting the heterogeneous market hypothesis (Section 5). This allows the indicator to capture the perspectives of market participants with different time horizons, such as short-term FX dealers and long-term central banks.
How It Works
Intrinsic Events Detection : The script identifies two types of events using intrinsic time principles:
Directional Change (DC) : Triggered when the price reverses by the threshold (delta) against the current trend (e.g., a drop by delta in an uptrend signals a "Down DC").
Overshoot (OS) : Occurs when the price continues in the trend direction by the threshold (e.g., a rise by delta in an uptrend signals an "Up OS").
DC events are plotted as solid lines, and OS events as dashed lines, with labels like "Up DC" or "OS Down" for clarity. The label style adjusts based on the trend to ensure visibility.
Multi-Agent Setup : Each agent operates independently with its own threshold, mimicking market participants with varying time horizons (Section 5). Smaller thresholds detect frequent, short-term events, while larger thresholds capture broader, long-term movements.
Settings
Each agent can be configured with:
Enable Agent : Toggle the agent on or off.
Threshold (%) : The percentage threshold (delta) for detecting DC and OS events (default values: 0.1%, 0.2%, 0.5%, 1%, 2% for agents 1–5).
Up Mode Color : Color for lines and labels in up mode (DC events).
Down Mode Color : Color for lines and labels in down mode (OS events).
Usage Notes
This indicator is designed for the foreign exchange market, leveraging its high liquidity, as noted in the paper (Section 1). Adjust the threshold values based on the instrument’s volatility—higher volatility leads to more intrinsic events (Section 4). It can be adapted to other markets where event-based analysis applies.
Reference
The methodology is based on:
Fractals and Intrinsic Time - A Challenge to Econometricians by U. A. Müller, M. M. Dacorogna, R. D. Davé, O. V. Pictet, R. B. Olsen, and J. R. Ward (June 28, 1995). Olsen & Associates Preprint.

Normal FractalsNormal size fractal
For those who like Charts as clean as possible, I modified build in fractals in smaller size clean chart pollution