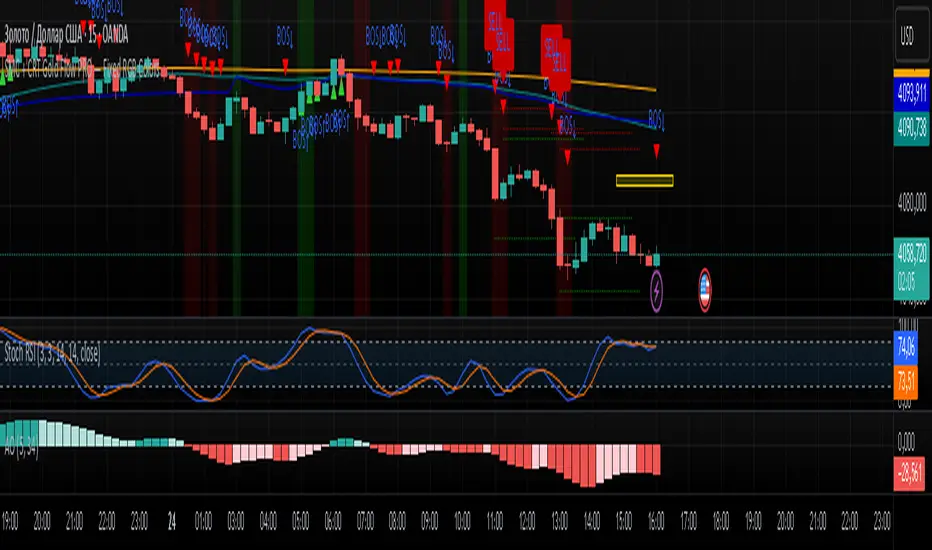
Auto Fib Golden Pocket Band - Strategy with Buy Signalsthis strategy is based on the Indicator "Auto Fib Golden Pocket Band - "Autofib Moving Average"
it's the same as the indicator but with:
- the strategy tester included
- several entry Signal filter
- Dynamic SL
חפש סקריפטים עבור "GOLD"
Auto Fib Golden Pocket Band - Autofib Moving Averageplots the fib retracement Golden pocket moving average band on two different pivots
Three Golden By Moonalert =========================
English
=========================
Three Golden By Moonalert
(Green Bar) BUY = All three conditions are agree uptrend.
1 candlestick is on the middle line of Bollinger Bands
2 RSI is more than 50
3 MACD cross up Zero Line
(Red Bar) SELL = All three conditions are agree downtrend
1 candlestick is under the middle line of Bollinger Bands
2 RSI is less than 50
3 MACD cross down Zero Line
(Yello Bar) Wait and see = some candition are agree uptrend or downtrend
Basic logic is
Green = Buy
Red = Sell
Yello = wait and see
Working Good for TF Daily.
=========================
THAI
=========================
เขียว = ซื้อ ( Bollinger bands , Rsi , Macd บอกขึ้นทั้งหมด )
เเดง = ขาย ( Bollinger bands , Rsi , Macd บอกลงทั้งหมด )
เหลือง = นั่งนิ่งๆ ( Bollinger bands , Rsi , Macd บอกขั้นหรือลงบางตัว )
สามารถปรับMACD ระหว่าง
Cross Signal กับ Cross Zeroได้ เเนะนำอย่างหลัง
สามารถปรับ EMA 20 50 200 เปิดปิดได้ที่ตั้งค่า
RSI Divergency and Golden RatioHow to calculate:
Positive mismatch finds the lowest trough within the distance you choose. It then compares it to the current closing value.
If the past low is above the current closing level, it means that the bottoms of the price are descending.
The RSI level at the furthest bottom of the price is detected. And the current RSI level is detected. If the current RSI level is higher than the previous RSI level, there is a positive divergence.
When a positive divergence occurs, a green pole forms above the RSI indicator on the chart.
Negative finds the highest peak level within the distance you choose. It then compares it to the current closing value.
If the past high is below the current close, it means that the highs of the price are rising.
The RSI level at the furthest high of the price is detected. And the current RSI level is detected. If the current RSI level is lower than the previous RSI level, there is negative divergence.
When a negative divergence occurs, a red pole forms above the RSI indicator on the chart.
As can be seen in the image, the points marked with red are the regions where incompatibility occurs. At the same time, the signals that occur when the RSI cuts its own moving average and the signals that occur when the RSI cuts its own golden ratio are also very strong signals.
Waiting for your ideas and comments. I am open to criticism. We can improve.
Easy Entry/Exit Trend Colors (With Alerts)This is an updated version of user Algokid's script called 'AK MACD BB INDICATOR V 1.00'. You can find that original script here:
I added many alerts along with the Bullish and Bearish alerts when the MACD crosses over the Upperband or crosses down on the Lowerband.
I personally use this indicator with Crypto charts (Bitcoin on a 15min, 1hour, and 4 hour timeframe) as one of many confirmations that it's a good time to enter a trade. This script was made to be easy to follow with the colors of GREEN triangles being a good uptrend or entry confirmation, and RED being a confirmation to sell/short or exit your trade.
It's important to use this indicator in combination with other indicators that can give you more confirmations to enter or exit a trade, and make sure you are on normal candles and not HA or any other candles as you can get wildly inaccurate results.
This script also has the Death & Golden crosses, which is the slow and fast moving averages crossing over each other. I don't use this as an additional confirmation, it's just nice to know where the cross happens.
Ceyhun Auto Golden Zone Hunter_V1.2Ceyhun Auto Golden Zone Hunter_V1.2 indikatörünü içermektedir güncellemeler için takipte kalın..
350DMA Golden ratio Higher timeframe ma'sThis Script take a 350 day moving average (bright yellow line) and multiplies it by the golden ratio 1.6... and by the Fibonacci sequence (0, 1, 2, 3, 5)
It is a great tool for finding tops and critical supports on higher timeframes.
The script also includes and higher timeframe ma (gray line) that can be set to your liking (default is 21 week).
[Strategy] Simple Golden CrossSimple Golden Cross Strategy.
Works best on a daily chart on "Blue Chip" cryptos such as BTC, ETH, and LTC.
Entry Signal:
-50 day moving average crosses over the 100 day moving average.
Exit Signal:
-50 day moving average crosses under the 100 day moving average.
-Daily candle closes under the 100 day moving average (support).
-100 day moving average crosses under the 200 day moving average.
Key EMAsSimple trade helper script that plots:
- 10 & 20 EMA crosses for fast moves
- 10 & 200 EMA crosses for trends
- 50 & 200 EMA golden and death crosses
Alerts built in.
Moving Averages CrossThis Indicator helps you spot crosses between moving averages.
Thought to combine short term and long term strategies.
A complementary element for your trading tool belt.
The First study (short term):
Helps you visualise the relation between two simple moving averages (9,21) by default.
The Second study (long term):
Helps you identify the relation between three simple moving averages (50,100, 200) by default.
Spot Golden Crosses and Death Crosses from far.
The Golden PivotsThe Golden Pivots indicator is a combination of the following:
1. Central Pivot Range
2. Floor Pivots
3. Camarilla Pivots
4. Monthly, Weekly, Daily Highs and lows
5. Candlestick Setups
All the pivot calculations are based on Secret of Pivot Boss book by Frank Ochoa.
One can also view tomorrow's central pivot range by today end of the day.
Bollinger Band Strategy (Basic) Version 1 This strategy is for learning purposes only. Pay special attention to these strategies on longer aggregation periods (like 1 hr chart or more). Don't expect accurate results when you set a limit to 10 cents above your entry to be accurate. For example if you set the chart to 1 day, the price may move down and hit a stop 10 times then tag your limit. If this doesn't make sense, just don't use strategies here. Learn more first. That being said, I don't have specific recommendations for each aggregation period, backtesting isn't always perfect.
Now then, this strategy can be used as the traditional BB method by setting the "Stop" and "Limit Out" to like 10000, check "Reversal Entry" and uncheck "Limit Time of Day" This will keep the strategy running just reverse your position when price crosses outside each band.
INPUTS:
Length - length of WMA that I used for mean of Bollinger Band (this may suppose to be SMA, too bad)
Source - O-H-L-C basis for WMA
Deviation - normal Standard deviation that would be set when using Bollinger Band
Trailing stop check box - your stop value will be either a hard stop or trailing stop for an exit
Stop - the stop value - remember you can set this really high and it won't stop out
Limit Out - the limit value for exit
Reversal Entry check box - This changes each entry from a reversal (traditional idea of BB) to enter a trend trade - hopefully version 2 will have choice to trend one direction and reversal in the other.
Limit Time of Day - Especially when trading futures, you may want to only trade a specific time of day, when this box is checked, you can set the entry times below, exit will still only occur based on limit/stop or a flip entry order (the opposite entry condition is met)
Tips:
when I don't know a thing about a price range, like gold. I can set the limit out to 10000 and play with a trailing stop to get a better idea of what is even possible before tuning further.
Bitcoin Golden RatioGives the top and bottom of the cryptocurrencies cycles.
When DMA111 crosses DMA350*2, the top is in.
Show accumulation phases and resistances with very precise accuracy.
3-day Death/Golden CrossBased on Crypto Crew University youtube video, "Emergency Update: New Bitcoin GOLDEN Cross Emerges (btc crypto live news market price today 2019 ta" (19 June 2019), comparing 2015 and 2018 bull runs.
(YEK) Combo(YEK) Combo is a combination of several indicators (listed below). You can use them together or one by one. Just click settings, and choose which of them to be shown.
Here are the indicators included in this script:
- Ichimoku Cloud
- Bollinger Bands
- Moving Average 1
- Moving Average 2 (In case of detecting golden crosses or death crosses)
- Exponential Moving Average
- T3 Tillson
- MavilimW
Enjoy!
Macd_Reader_Signal_Moriceau_Thesis_indicatorThe idea is to create a MACD "Reader" that can tell you when you should buy (yellow candle sticks) and when to Sell (black one) you have also strong signal of with B and S write on graphic automatically. This indicator is set and back tested with BTCUSD and Gold. I used also for french equities and it works really good.
Let me know if you want any change or have comments.
Hugo Moriceau
Lot Size CalculatorLot Size Calculator for Gold (XAU)
This indicator helps traders calculate the proper lot size for Gold (XAU) based on their entry, stop loss, and risk amount in USD.
You can set your entry and stop levels directly on the chart, and adjust your dollar risk from the settings panel.
The indicator measures the distance between entry and stop to calculate the position size that matches your selected risk.
A clean, customizable table displays key values such as Risk, Entry, Stop, Target, Lots, and Pips.
You can easily hide specific rows, change colors, and adjust layout options to fit your chart style.
Designed specifically for Gold traders, this tool provides a simple and visual way to manage risk directly on the chart.
MTF Trend - Gold/XAU with DXY FilterI published this earlier and I had it on a chart with multiple other Indicators and It was very confusing so i am publishing it again on a clean chart
This Indicator is for Gold only buy can be used in other assets If the Filter toggle is turned off in the settings
This Indicator measures the strength of the Dollar Index which will determine the direction of the Gold asset
If the DXY is weak and all timeframes align then you can tide in that direction, the opposite is true foe a strong Dollar all timeframes must be opposite to the Dollar as as DXY and Gold trade together very well it also plots a large Triangle on the chart to warn of the Direction
You can trade however you wish but it is best to sell gold when Dollar is strong and buy gold when Dollar is weak, money is moved from Dollar to Gold and Gold to Dollar when weak and strong
Purchasing Power vs Gold, Stocks, Real Estate, BTC (1971 = 100)Visual comparison of U.S. dollar purchasing power versus major assets since 1971, when the U.S. ended the gold standard. Each asset is normalized to 100 in 1971, showing how real value has shifted across gold, real estate, stocks, and Bitcoin over time.
Source: FRED (CPIAUCSL, SP500, MSPUS) • OANDA (XAUUSD) • TradingView (INDEX:BTCUSD/BLX)
Visualization by 3xplain


