Micho 150 SMA indicatorAMEX:SPY NASDAQ:MSFT This Pine Script indicator is designed to assist traders by displaying a 150-day Simple Moving Average (SMA) and a stop loss level based on a user-defined percentage below the 150-day SMA. It also marks significant crossover events with labels and highlights potential trend changes using Golden Cross and Death Cross indicators.
Features:
150-Day Simple Moving Average (SMA):
The script calculates and plots the 150-day SMA of the closing prices. This is a common technical indicator used to determine the overall trend of a security. The 150-day SMA is plotted in gray on the chart.
Stop Loss Price:
Users can define a stop loss percentage through an input field. This percentage is used to calculate a stop loss price that is plotted 1% (or user-defined percentage) below the 150-day SMA. The stop loss line is plotted in red on the chart. This helps traders manage risk by indicating a price level where they might consider exiting a trade to prevent further losses.
Buy and Sell Signals:
The script identifies potential buy and sell signals based on crossovers of the closing price with the 150-day SMA:
Buy Signal: When the closing price crosses above the 150-day SMA.
Sell Signal: When the closing price crosses below the 150-day SMA.
Labels are plotted at the crossover points to indicate "start follow" for buy signals (in green) and "check stoploss" for sell signals (in red).
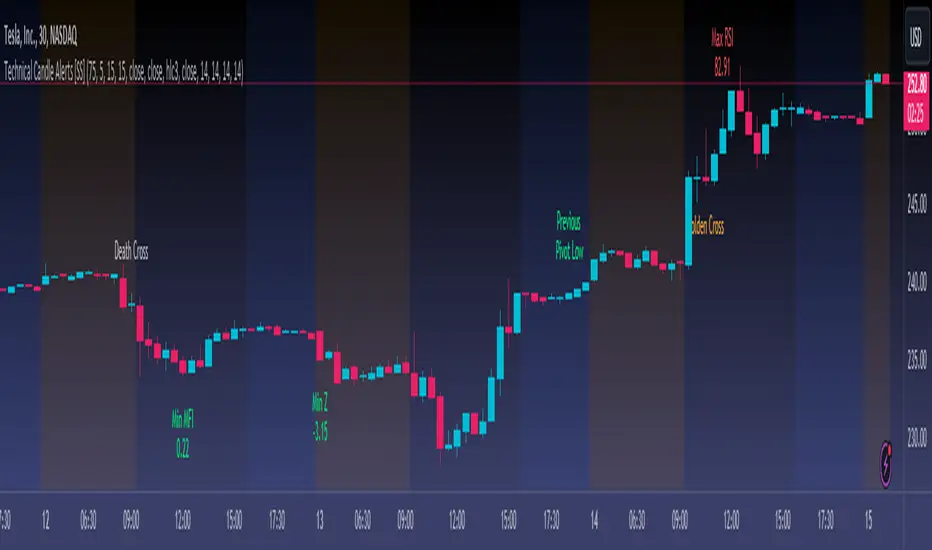
Golden Cross and Death Cross:
The script also identifies Golden Cross and Death Cross events:
Golden Cross: Occurs when the 50-day SMA crosses above the 200-day SMA. This is generally considered a bullish signal indicating a potential upward trend.
Death Cross: Occurs when the 50-day SMA crosses below the 200-day SMA. This is generally considered a bearish signal indicating a potential downward trend.
These crossover events are marked with labels on the chart: "Golden Cross" (in yellow) and "Death Cross" (in yellow)
אינדיקטור Pine Script®