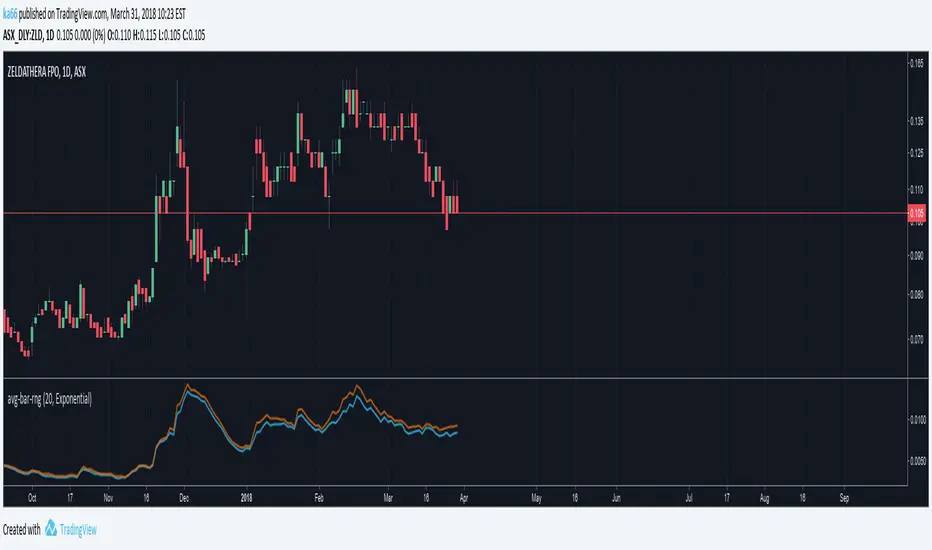
ka66: Average Bar RangeAverages price ranges (high - low) across a set of bars in a given timeframe. Additionally, also plots the Average True Range (ATR) as a better comparison for volatility.
Configurable period and averaging mechanism.
Useful for gauging minimum profits and price movement over a period, a filter for historical volatility.
Furthermore, executing trades is better done with channels like ATR/Keltner channels, or Bollinger Bands.
חפש סקריפטים עבור "KELTNER"
Ethan BB and KC Script - Antarticafor 4h chart, based on bollinger and keltner channels. For BTC only

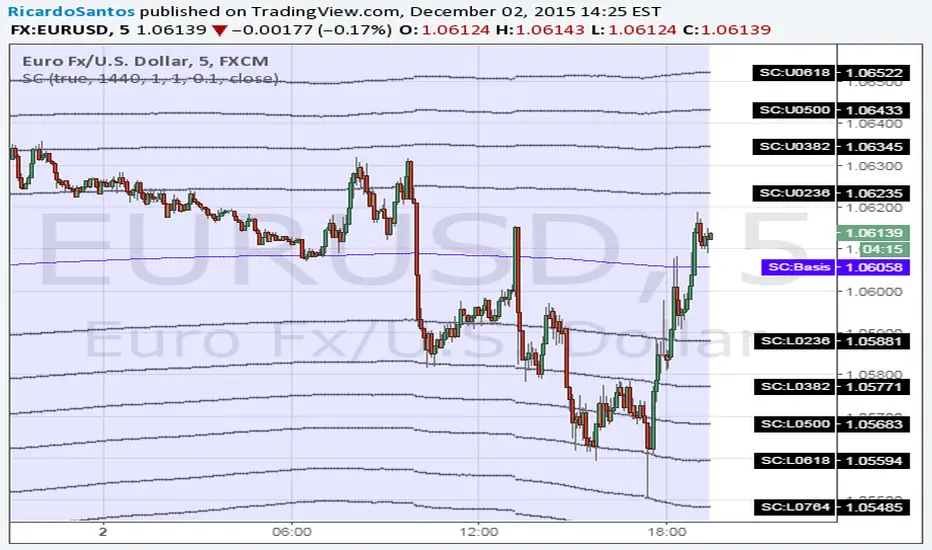
Bollinger Band Ribbon R1.0 by JustUncleLThis study is a Bollinger Band indicator that shows the fractional stddev levels between the main bands. You can choose upto 6 Stddev Main Levels (ie 6*StdDev), with 0,1,3,4, or 9 fractional levels.
Other options available are:
Use different MA types for Basis of Bollinger: SMA, EMA, WMA and VWMA are good choices.
Show previous days closing price.
Show Previous days High and Low prices.
Use Keltner Channel in place of Bollinger.

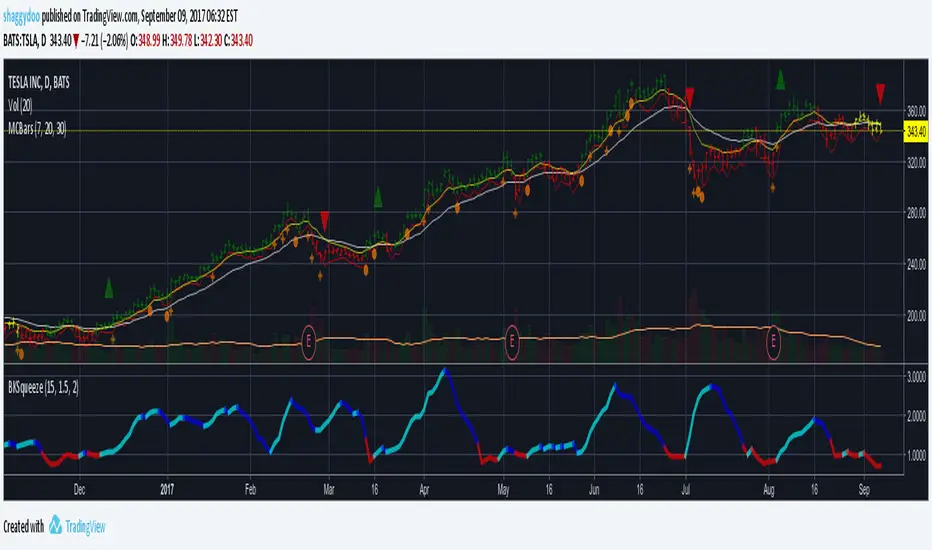
BKSqueezeThis is a price volatility compression and expansion indicator that uses the ratio of the Bollinger Band and Keltner Ratio.
Red segments indicate extreme price volatility compression that can be ideal entry points for stock/futures/forex and/or options positions.
Aqua segments indicate price volatility is expanding.
Blue segments indicate price volatility is compressing - can be used as an exit point or partial scale out point.
Note that the indicator doesn't indicate direction. One suggestion is to use the DMI indicator for this purpose - really depends on how early you enter the trade.
Suggest using a time period of 15 bars for volatile stocks, such as TSLA for example, otherwise a period of 20 bars suits most stocks/futures/forex symbols.
Price Action Channel Master by JustUncleLThis indicator combines a number of PAC types into one indicator and will replace some of my previously PAC scripts (some were not published).
It draws a Moving Average (MA) channel based on various boundary criteria. Even though the MA choices are not limited to SMA and EMA, these would be the your first choices with most PAC requirements, feel free to experiment though.
Optional Bar colouring around that channel.
Options Available:
(1) Select between 11 different types of moving averages for the base (centre) MA line choices are :
SMA = Simple Moving Average (default)
EMA = Exponential Moving Average.
WMA = Weighted Moving Average
VWMA = Volume Weighted Moving Average
SMMA = Smoothed Simple Moving Average.
DEMA = Double Exponential Moving Average
TEMA = Triple Exponential Moving Average.
HullMA = Hull Moving Average
SSMA = Ehlers Super Smoother Moving average
ZEMA = Near Zero Lag Exponential Moving Average.
TMA = Triangular (smoothed) Simple Moving Average.
(2) Select Channel Boundary Criteria:
HILO = Channel boundaries based on High and Low MAs (default).
ATR = Channel boundaries are Multiplier * ATR distance from base line
PIP = Channel boundaries are Multiplier * PIPs distance from base line
STDEV = Channel boundaries are Multiplier * StdDev(price) distance from base line (this is the same as Bollinger bands if SMA is the base MA)
KC = Channel boundaries are Multiplier * StdDev(True Range) distance from base line (this is the same as Keltner channel if SMA is the base MA)
(3) Option to display coloured Candles around the Ribbon, the colouring uses the Default candle 3-tone colour scheme:
Lime = candle closed above Ribbon.
Red = candle closed below Ribbon.
Gray = Candle Closed inside Ribbon.
The Grab candles 6-tone colour scheme:
Lime = Bull candle closed above Ribbon.
Green = Bear candle closed above Ribbon.
Red = Bull candle closed below Ribbon.
DarkRed = Bear candle closed below Ribbon.
Aqua = Bull candle closed inside Ribbon.
Blue = Bear candle closed inside Ribbon.

LBR Paintbars [LazyBear]
Added coloring of LB bars above/below Keltner Channel (as suggested by user @20813 below in the comments).
Updated code: pastebin.com
See comments section below for a sample chart. Copy the code from the pastebin above and update your local copy (TV doesn't allow me to update an already published code -- yet!).
Added features:
- Switch ON/OFF KC
- Mark LB bars above/below KC
----------------------------------------------------------------------
The LBR PaintBars indicator changes the colour of the price bars based on the trend direction (derived from price & volatility bands). This is mostly used as a confirmation indicator.
For the Pine coders: I suggest trying stdev() in lieu of atr()...some wild combinations can be derived from this simple idea :)
Indicator supports the following options:
- Switching on/off volatility bands
- Switching on/off LBR colors (lime/maroon).
- Color non-LBR bars (blue).
Thanks @mseaworthy for pinging me with this idea.
Complete list of my indicators:
-----------------------------
docs.google.com

Squeeze Momentum Indicator [LazyBear]
Fixed a typo in the code where BB multiplier was stuck at 1.5. Thanks @ucsgears for bringing it to my notice.
Updated source: pastebin.com
Use the updated source instead of the what TV shows below.
This is a derivative of John Carter's "TTM Squeeze" volatility indicator, as discussed in his book "Mastering the Trade" (chapter 11).
Black crosses on the midline show that the market just entered a squeeze (Bollinger Bands are with in Keltner Channel). This signifies low volatility, market preparing itself for an explosive move (up or down). Gray crosses signify "Squeeze release".
Mr.Carter suggests waiting till the first gray after a black cross, and taking a position in the direction of the momentum (for ex., if momentum value is above zero, go long). Exit the position when the momentum changes (increase or decrease --- signified by a color change). My (limited) experience with this shows, an additional indicator like ADX / WaveTrend, is needed to not miss good entry points. Also, Mr.Carter uses simple momentum indicator, while I have used a different method (linreg based) to plot the histogram.
More info:
- Book: Mastering The Trade by John F Carter
List of all my indicators:
